制作仪表板以显示指标和EA中的数据

目录
概述
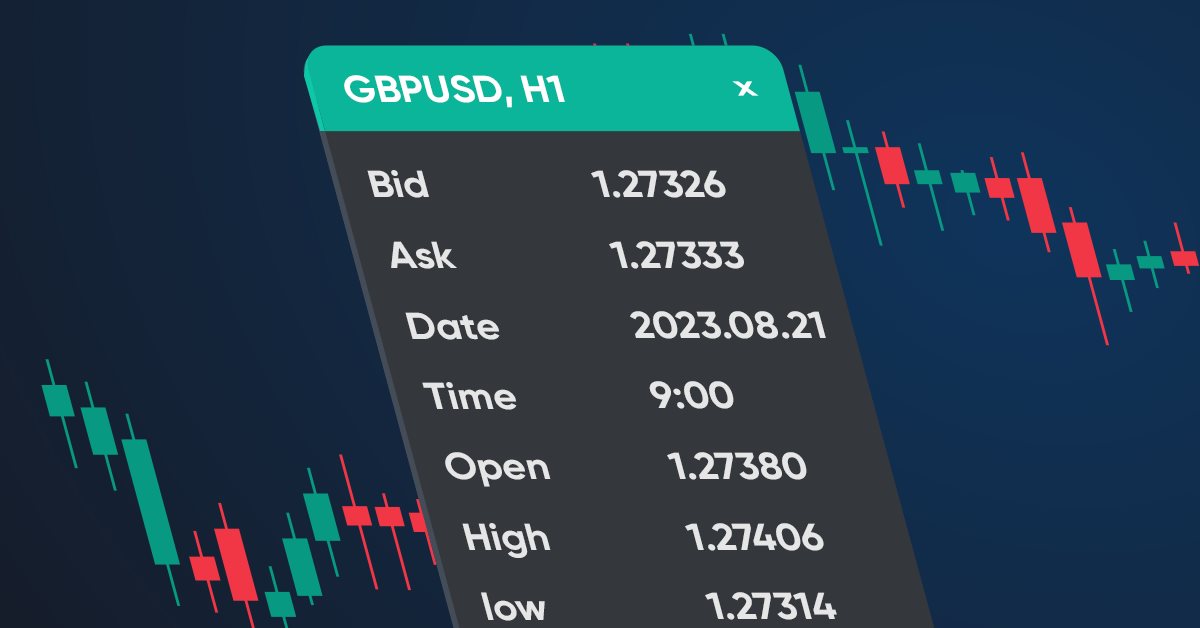
在本文中,我将创建一个可以显示开发人员指定的数据的仪表板。这样的面板将便于在图表上直观地显示数据和进行可视化调试,因为在面板上查看必要的值比在调试器中跟踪它们更方便。我指的是根据某些数据值调试策略的情况。
我将以终端数据窗口原型的形式制作面板,并用相同的数据填充:
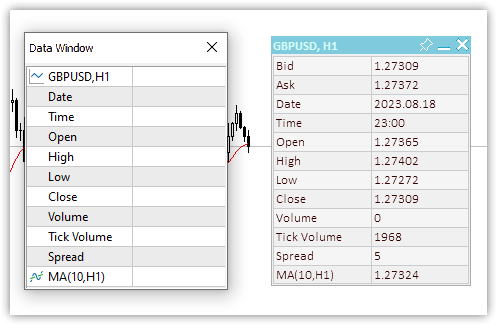
图1数据窗口和仪表板
我们的自定义面板将允许我们向其添加任何所需数量的必要数据,对其进行签名,以及显示和更新程序代码的读数。
应该可以用鼠标在图表周围移动面板,将其固定在所需的图表位置,以及折叠/展开它。为了方便在面板上放置数据,可以显示具有指定行数和列数的表格。该表中的数据可以显示在日志中(每个表单元格的X和Y坐标),并通过编程获得,以指示该数据应位于的行和列的索引,或者只需打印坐标并在显示文本和数据时将所需坐标输入到代码中。第一种方法由于其完全自动化而更加方便。面板也将有一个活动的关闭按钮,但我们将其处理委托给控制程序,因为只有程序开发人员才能决定如何对按下关闭按钮做出反应。单击按钮时,将向程序事件处理程序发送一个自定义事件。开发人员可以自行处理。
用于获取表格数据的类
由于根据可见的或者虚拟的预先确定的坐标在面板上排列数据很方便,我们将首先创建用于排列表格数据的类。表格可以表示为一个简单的网格,其线交点将是表格单元格的坐标。可以将任何可见数据放置在这样的坐标处。该表具有一定数量的行(水平行),每行具有一定数量(垂直行)的单元格。在一个简单的网格表中,所有行都有相同数量的单元格。
基于此,我们需要三个类:
- 表格单元格类,
- 表格行类,
- 表格类。
表格单元格类包括表格中的行索引和列索引,以及面板中表格单元格视觉位置的坐标——相对于面板左上角表格原点的X和Y坐标。
表格行类包括表单元格类。我们可以在一行中创建所需数量的单元格。
表格类包括一个表行列表。可以创建表中的行,并添加所需数量的行。
让我们简单地看一下这三个类。
表格单元格类
//+------------------------------------------------------------------+
//| Table cell class                                                 |
//+------------------------------------------------------------------+
class CTableCell : public CObject
  {
private:
   int               m_row;                     // Row
   int               m_col;                     // Column
   int               m_x;                       // X coordinate
   int               m_y;                       // Y coordinate
public:
//--- Methods of setting values
   void              SetRow(const uint row)     { this.m_row=(int)row;  }
   void              SetColumn(const uint col)  { this.m_col=(int)col;  }
   void              SetX(const uint x)         { this.m_x=(int)x;      }
   void              SetY(const uint y)         { this.m_y=(int)y;      }
   void              SetXY(const uint x,const uint y)
                       {
                        this.m_x=(int)x;
                        this.m_y=(int)y;
                       }
//--- Methods of obtaining values
   int               Row(void)            const { return this.m_row;    }
   int               Column(void)         const { return this.m_col;    }
   int               X(void)              const { return this.m_x;      }
   int               Y(void)              const { return this.m_y;      }
//--- Virtual method for comparing two objects
   virtual int       Compare(const CObject *node,const int mode=0) const
                       {
                        const CTableCell *compared=node;
                        return(this.Column()>compared.Column() ? 1 : this.Column()<compared.Column() ? -1 : 0);
                       }
//--- Constructor/destructor
                     CTableCell(const int row,const int column) : m_row(row),m_col(column){}
                    ~CTableCell(void){}
  };
该类继承自基类,用于构建MQL5标准库,因为它将搭配MQL5 标准库的CArrayObj列表,而列表只能包含CObject对象或从基本CObject继承的对象。
所有变量和方法的函数都非常透明且易于理解。变量用于存储表格行(Row)和列(Column)的值,而坐标是面板中表格单元格左上角的相对坐标。使用这些坐标,可以绘制一些东西或将其放置在面板上。
需要Compare虚拟方法来查找和比较两个表单元格对象,该方法是在基类CObject类中声明的:
   //--- method of comparing the objects
   virtual int       Compare(const CObject *node,const int mode=0) const { return(0);      }
它返回空值,应在继承的类中重写。
由于表格单元格是添加到表格行中的,即在视觉上是水平的,因此搜索和比较应按水平单元格编号进行,即按列值进行。这正是重写的虚拟Compare方法在这里所做的:
//--- Virtual method for comparing two objects
   virtual int       Compare(const CObject *node,const int mode=0) const
                       {
                        const CTableCell *compared=node;
                        return(this.Column()>compared.Column() ? 1 : this.Column()<compared.Column() ? -1 : 0);
                       }
如果当前对象的列值大于正在比较的对象的值(传递给方法的指针),则返回1。如果列值小于要比较的列值,则返回-1。否则,返回零。因此,该方法返回的零值表示被比较的对象的值相等。
表格行类
单元格对象将添加到表格行中。如果一行中的单元格是水平相邻的,则表中的行就是垂直排列的。
这里我们只需要知道行索引及其在面板上的Y坐标:
//+------------------------------------------------------------------+
//| Table row class                                                  |
//+------------------------------------------------------------------+
class CTableRow : public CObject
  {
private:
  CArrayObj          m_list_cell;               // Cell list
  int                m_row;                     // Row index
  int                m_y;                       // Y coordinate
public:
//--- Return the list of table cells in a row
   CArrayObj        *GetListCell(void)       { return &this.m_list_cell;         }
//--- Return (1) the number of table cells in a row (2) the row index in the table
   int               CellsTotal(void)  const { return this.m_list_cell.Total();  }
   int               Row(void)         const { return this.m_row;                }
//--- (1) Set and (2) return the Y row coordinate
   void              SetY(const int y)       { this.m_y=y;                       }
   int               Y(void)           const { return this.m_y;                  }
//--- Add a new table cell to the row
   bool              AddCell(CTableCell *cell)
                       {
                        this.m_list_cell.Sort();
                        if(this.m_list_cell.Search(cell)!=WRONG_VALUE)
                          {
                           ::PrintFormat("%s: Table cell with index %lu is already in the list",__FUNCTION__,cell.Column());
                           return false;
                          }
                        if(!this.m_list_cell.InsertSort(cell))
                          {
                           ::PrintFormat("%s: Failed to add table cell with index %lu to list",__FUNCTION__,cell.Column());
                           return false;
                          }
                        return true;
                       }
//--- Return the pointer to the specified cell in the row
   CTableCell       *GetCell(const int column)
                       {
                        const CTableCell *obj=new CTableCell(this.m_row,column);
                        int index=this.m_list_cell.Search(obj);
                        delete obj;
                        return this.m_list_cell.At(index);
                       }
//--- Virtual method for comparing two objects
   virtual int       Compare(const CObject *node,const int mode=0) const
                       {
                        const CTableRow *compared=node;
                        return(this.Row()>compared.Row() ? 1 : this.Row()<compared.Row() ? -1 : 0);
                       }
//--- Constructor/destructor
                     CTableRow(const int row) : m_row(row)  { this.m_list_cell.Clear();   }
                    ~CTableRow(void)                        { this.m_list_cell.Clear();   }
  };
包含新添加的单元格对象的CArrayObj列表在类中声明。
在Compare虚拟方法中,我们按行索引值(Row)比较对象,因为添加新行时,我们只需要按行索引进行搜索。如果未找到具有此类索引的行,则搜索方法(Search)将返回-1,否则搜索将返回列表中找到的对象位置的索引。Search方法在CArrayObj类中声明和实现:
//+------------------------------------------------------------------+
//| Search of position of element in a sorted array                  |
//+------------------------------------------------------------------+
int CArrayObj::Search(const CObject *element) const
  {
   int pos;
//--- check
   if(m_data_total==0 || !CheckPointer(element) || m_sort_mode==-1)
      return(-1);
//--- search
   pos=QuickSearch(element);
   if(m_data[pos].Compare(element,m_sort_mode)==0)
      return(pos);
//--- not found
   return(-1);
  }
正如我们所看到的,它使用比较两个对象的虚拟Compare方法来确定对象的相等性。
向列表中添加新单元格的方法:
//--- Add a new table cell to the row
   bool              AddCell(CTableCell *cell)
                       {
                        this.m_list_cell.Sort();
                        if(this.m_list_cell.Search(cell)!=WRONG_VALUE)
                          {
                           ::PrintFormat("%s: Table cell with index %lu is already in the list",__FUNCTION__,cell.Column());
                           return false;
                          }
                        if(!this.m_list_cell.InsertSort(cell))
                          {
                           ::PrintFormat("%s: Failed to add table cell with index %lu to list",__FUNCTION__,cell.Column());
                           return false;
                          }
                        return true;
                       }
由于单元格严格按照列编号(Column)一个接一个地位于列表中,并且我们按排序顺序添加它们,因此列表应首先设置排序列表标志。如果搜索未返回-1,则表示该对象已存在于列表中,会将相应的消息发送到日志,并返回false。如果未能将对象指针添加到列表,就要发出通知并返回false。如果一切正常,则返回true。
返回指向行中指定单元格的指针的方法:
//--- Return the pointer to the specified cell in the row
   CTableCell       *GetCell(const int column)
                       {
                        const CTableCell *obj=new CTableCell(this.m_row,column);
                        int index=this.m_list_cell.Search(obj);
                        delete obj;
                        return this.m_list_cell.At(index);
                       }
标准库的CArrayObj类的Search方法根据指针传递给该方法的对象的实例在列表中搜索相等项。因此,在这里,我们创建一个新的临时对象,指定在其构造函数中传递给方法的列号,以及在列表中获取对象索引,或者如果在列表中没有找到具有此类参数的对象,则为-1。此外,请确保删除临时对象并返回指向列表中找到的对象的指针。
如果找不到对象并且索引等于-1,则CArrayObj类的At方法将返回NULL。
表格类
该表由行列表组成,而行列表又由单元格列表组成。换言之,表格数据类仅包含CArrayObj对象——要创建的行以及添加和接收表行和单元格的方法:
//+------------------------------------------------------------------+
//| Table data class                                                 |
//+------------------------------------------------------------------+
class CTableData : public CObject
  {
private:
   CArrayObj         m_list_rows;               // List of rows
public:
//--- Return the list of table rows
   CArrayObj        *GetListRows(void)       { return &this.m_list_rows;   }
//--- Add a new row to the table
   bool              AddRow(CTableRow *row)
                       {
                        //--- Set the sorted list flag
                        this.m_list_rows.Sort();
                        //--- If such an object is already in the list (the search returns the object index, not -1),
                        //--- inform of that in the journal and return 'false'
                        if(this.m_list_rows.Search(row)!=WRONG_VALUE)
                          {
                           ::PrintFormat("%s: Table row with index %lu is already in the list",__FUNCTION__,row.Row());
                           return false;
                          }
                        //--- If failed to add the pointer to the sorted list, inform of that and return 'false'
                        if(!this.m_list_rows.InsertSort(row))
                          {
                           ::PrintFormat("%s: Failed to add table cell with index %lu to list",__FUNCTION__,row.Row());
                           return false;
                          }
                        //--- Successful - return 'true'
                        return true;
                       }
//--- Return the pointer to the (1) specified row and (2) specified cell in the specified table row
   CTableRow        *GetRow(const int index) { return this.m_list_rows.At(index);   }
   CTableCell       *GetCell(const int row,const int column)
                       {
                        //--- Get a pointer to a string object in a list of strings
                        CTableRow *row_obj=this.GetRow(row);
                        //--- If failed to get the object, return NULL
                        if(row_obj==NULL)
                           .return NULL;
                        //--- Get the pointer to the cell object in the row by a column number and
                        CTableCell *cell=row_obj.GetCell(column);
                        //--- return the result (object pointer or NULL)
                        return cell;
                       }
//--- Write the X and Y coordinates of the specified table cell into the variables passed to the method
   void              CellXY(const uint row,const uint column, int &x, int &y)
                       {
                        x=WRONG_VALUE;
                        y=WRONG_VALUE;
                        CTableCell *cell=this.GetCell(row,column);
                        if(cell==NULL)
                           return;
                        x=cell.X();
                        y=cell.Y();
                       }
//--- Return the X coordinate of the specified table cell
   int               CellX(const uint row,const uint column)
                       {
                        CTableCell *cell=this.GetCell(row,column);
                        return(cell!=NULL ? cell.X() : WRONG_VALUE);
                       }
//--- Return the Y coordinate of the specified table cell
   int               CellY(const uint row,const uint column)
                       {
                        CTableCell *cell=this.GetCell(row,column);
                        return(cell!=NULL ? cell.Y() : WRONG_VALUE);
                       }
//--- Return the number of table (1) rows and (2) columns
   int               RowsTotal(void)            { return this.m_list_rows.Total();  }
   int               ColumnsTotal(void)
                       {
                        //--- If there is no row in the list, return 0
                        if(this.RowsTotal()==0)
                           return 0;
                        //--- Get a pointer to the first row and return the number of cells in it
                        CTableRow *row=this.GetRow(0);
                        return(row!=NULL ? row.CellsTotal() : 0);
                       }
//--- Return the total number of cells in the table
   int               CellsTotal(void){ return this.RowsTotal()*this.ColumnsTotal(); }
//--- Clear lists of rows and table cells
   void              Clear(void)
                       {
                        //--- In the loop by the number of rows in the list of table rows,
                        for(int i=0;i<this.m_list_rows.Total();i++)
                          {
                           //--- get the pointer to the next row
                           CTableRow *row=this.m_list_rows.At(i);
                           if(row==NULL)
                              continue;
                           //--- get cell list from the obtained row object,
                           CArrayObj *list_cell=row.GetListCell();
                           //--- clear cell list
                           if(list_cell!=NULL)
                              list_cell.Clear();
                          }
                        //--- Clear cell list
                        this.m_list_rows.Clear();
                       }
//--- Print the table cell data in the journal
   void              Print(const uint indent=0)
                       {
                        //--- Print the header in the journal
                        ::PrintFormat("Table: Rows: %lu, Columns: %lu",this.RowsTotal(),this.ColumnsTotal());
                        //--- In the loop by table rows
                        for(int r=0;r<this.RowsTotal();r++)
                           //--- in the loop by the next row cells,
                           for(int c=0;c<this.ColumnsTotal();c++)
                             {
                              //--- get the pointer to the next cell and display its data in the journal
                              CTableCell *cell=this.GetCell(r,c);
                              if(cell!=NULL)
                                 ::PrintFormat("%*s%-5s %-4lu %-8s %-6lu %-8s %-6lu %-8s %-4lu",indent,"","Row",r,"Column",c,"Cell X:",cell.X(),"Cell Y:",cell.Y());
                             }
                       }
//--- Constructor/destructor
                     CTableData(void)  { this.m_list_rows.Clear();   }
                    ~CTableData(void)  { this.m_list_rows.Clear();   }
  };
这里几乎所有的方法都在代码中进行了注释。我将只注意返回表中的行数和列数以及表单元格总数的方法。
行数是行列表大小。我们获得了表的确切行数:
int RowsTotal(void) { return this.m_list_rows.Total(); }
与行不同,这里的列数仅在假设每行的列数相同的情况下返回。因此,仅返回第一行中的单元格数(列表中具有零索引的行):
   int               ColumnsTotal(void)
                       {
                        //--- If there is no row in the list, return 0
                        if(this.RowsTotal()==0)
                           return 0;
                        //--- Get a pointer to the first row and return the number of cells in it
                        CTableRow *row=this.GetRow(0);
                        return(row!=NULL ? row.CellsTotal() : 0);
                       }
在扩展和最终确定此类时,可以添加返回指定行中单元格数的方法,因此,不通过将表中的(确切的)行数乘以第一行中的单元格数来返回表中的单元格总数(假设如上所述):
int CellsTotal(void){ return this.RowsTotal()*this.ColumnsTotal(); }
这对于这个版本的表格数据类的精确计算来说已经足够了,而且还没有必要使事情复杂化——这些只是信息面板类的辅助类,我们将使用表格(晶格)标记将数据放置在面板上。
仪表板类
让我们定义所有可能的鼠标状态:
- 鼠标按钮(左、右)未被按下,
- 在面板窗口外按下鼠标按钮,
- 在面板窗口内按下鼠标按钮,
- 在面板窗口标题内按下鼠标按钮,
- 在“关闭”控制元件上按下鼠标按钮,
- 在“折叠/展开”控制元件上按下鼠标按钮,
- 在“大头针”控制元件上按下鼠标按钮,
- 鼠标光标在面板窗口之外,
- 鼠标光标位于面板窗口内,
- 鼠标光标位于面板窗口标题内,
- 鼠标光标位于“关闭”控制元素内,
- 鼠标光标位于“折叠/展开”控制元素内,
- 鼠标光标位于“大头针”控制元素内。
让我们创建相应的枚举:
enum ENUM_MOUSE_STATE
  {
   MOUSE_STATE_NOT_PRESSED,
   MOUSE_STATE_PRESSED_OUTSIDE_WINDOW,
   MOUSE_STATE_PRESSED_INSIDE_WINDOW,
   MOUSE_STATE_PRESSED_INSIDE_HEADER,
   MOUSE_STATE_PRESSED_INSIDE_CLOSE,
   MOUSE_STATE_PRESSED_INSIDE_MINIMIZE,
   MOUSE_STATE_PRESSED_INSIDE_PIN,
   MOUSE_STATE_OUTSIDE_WINDOW,
   MOUSE_STATE_INSIDE_WINDOW,
   MOUSE_STATE_INSIDE_HEADER,
   MOUSE_STATE_INSIDE_CLOSE,
   MOUSE_STATE_INSIDE_MINIMIZE,
   MOUSE_STATE_INSIDE_PIN
  };
目前,已经实现了在面板的控制元件上按住或点击鼠标按钮的跟踪。换句话说,第一次按键是用于固定状态的触发器。然而,在Windows应用程序中,这样的触发器是在按下按钮后释放按钮——点击。按住可用于拖动对象。但就目前而言,一个简单的解决方案对我们来说已经足够了——第一次按下将被视为点击或按住。如果我们进一步开发面板,将有可能补充鼠标按钮的处理,以匹配上述行为。
CDashboard信息面板类将由两个元素组成:画布(背景)和工作区,画布上将绘制面板设计和控制元素,工作区上放置的数据将绘制在画布上。工作空间将始终是完全透明的,画布对于表头和其他所有内容将具有单独的透明度值:
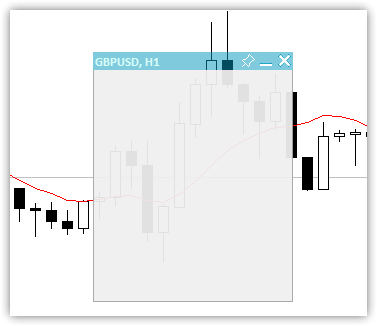
图2. 只有标题透明度不同的画布和带边框的字段
标题下的区域由一个框架勾勒,用于在其上放置一个工作区域。该区域完全透明,包含数据文本。此外,标题下方的画布区域可用于可视化设计。在这种情况下,将在其上绘制表格:
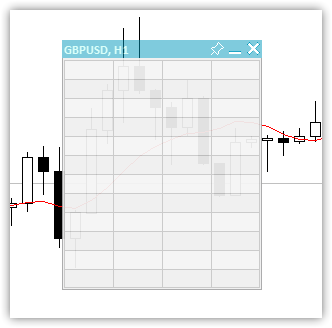
图3. 12行4列的表格
一个包含数据的工作区域叠加在设计的画布上。这样,我们就得到了一个完整的面板:
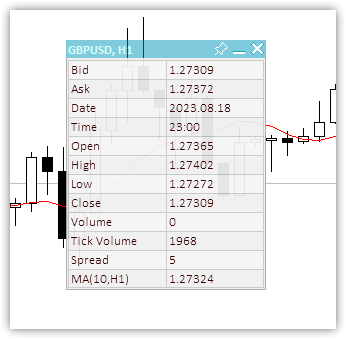
图4. 带有12x2背景表格和数据的面板
我们将把一些面板参数的值保存到全局终端变量中,以便面板记住其状态,并在重新启动时恢复它们-X和Y坐标、最小化状态和面板可移动性标志。以折叠形式将面板固定在图表上时,会保存此固定位置,下次折叠固定面板时,它会显示在保存的位置。
图5. 如果面板以折叠的形式固定,它会“记住”其固定位置
我们可以看到,为了记住折叠面板的绑定位置,需要将其折叠、移动到绑定位置并固定。当面板固定在折叠状态时,会记住其位置。然后可以展开、取消固定和移动它。为了使面板返回到保存的绑定位置,应将其固定并折叠。在没有固定的情况下,面板将折叠到其当前位置。
类的主体:
//+------------------------------------------------------------------+
//| Dashboard class                                                  |
//+------------------------------------------------------------------+
class CDashboard : public CObject
  {
private:
   CCanvas           m_canvas;                  // Canvas
   CCanvas           m_workspace;               // Work space
   CTableData        m_table_data;              // Table cell array
   ENUM_PROGRAM_TYPE m_program_type;            // Program type
   ENUM_MOUSE_STATE  m_mouse_state;             // Mouse button status
   uint              m_id;                      // Object ID
   long              m_chart_id;                // ChartID
   int               m_chart_w;                 // Chart width
   int               m_chart_h;                 // Chart height
   int               m_x;                       // X coordinate
   int               m_y;                       // Y coordinate
   int               m_w;                       // Width
   int               m_h;                       // Height
   int               m_x_dock;                  // X coordinate of the pinned collapsed panel
   int               m_y_dock;                  // Y coordinate of the pinned collapsed panel

   bool              m_header;                  // Header presence flag
   bool              m_butt_close;              // Close button presence flag
   bool              m_butt_minimize;           // Collapse/expand button presence flag
   bool              m_butt_pin;                // Pin button presence flag
   bool              m_wider_wnd;               // Flag for exceeding the horizontal size of the window width panel
   bool              m_higher_wnd;              // Flag for exceeding the vertical size of the window height panel
   bool              m_movable;                 // Panel movability flag
   int               m_header_h;                // Header height
   int               m_wnd;                     // Chart subwindow index

   uchar             m_header_alpha;            // Header transparency
   uchar             m_header_alpha_c;          // Current header transparency
   color             m_header_back_color;       // Header background color
   color             m_header_back_color_c;     // Current header background color
   color             m_header_fore_color;       // Header text color
   color             m_header_fore_color_c;     // Current header text color
   color             m_header_border_color;     // Header border color
   color             m_header_border_color_c;   // Current header border color

   color             m_butt_close_back_color;   // Close button background color
   color             m_butt_close_back_color_c; // Current close button background color
   color             m_butt_close_fore_color;   // Close button icon color
   color             m_butt_close_fore_color_c; // Current close button color

   color             m_butt_min_back_color;     // Expand/collapse button background color
   color             m_butt_min_back_color_c;   // Current expand/collapse button background color
   color             m_butt_min_fore_color;     // Expand/collapse button icon color
   color             m_butt_min_fore_color_c;   // Current expand/collapse button icon color

   color             m_butt_pin_back_color;     // Pin button background color
   color             m_butt_pin_back_color_c;   // Current pin button background color
   color             m_butt_pin_fore_color;     // Pin button icon color
   color             m_butt_pin_fore_color_c;   // Current pin button icon color

   uchar             m_alpha;                   // Panel transparency
   uchar             m_alpha_c;                 // Current panel transparency
   uchar             m_fore_alpha;              // Text transparency
   uchar             m_fore_alpha_c;            // Current text transparency
   color             m_back_color;              // Background color

   color             m_back_color_c;            // Current background color

   color             m_fore_color;              // Text color
   color             m_fore_color_c;            // Current text color
   color             m_border_color;            // Border color
   color             m_border_color_c;          // Current border color

   string            m_title;                   // Title text
   string            m_title_font;              // Title font
   int               m_title_font_size;         // Title font size
   string            m_font;                    // Font
   int               m_font_size;               // Font size

   bool              m_minimized;               // Collapsed panel window flag
   string            m_program_name;            // Program name
   string            m_name_gv_x;               // Name of the global terminal variable storing the X coordinate
   string            m_name_gv_y;               // Name of the global terminal variable storing the Y coordinate
   string            m_name_gv_m;               // Name of the global terminal variable storing the collapsed panel flag

   string            m_name_gv_u;               // Name of the global terminal variable storing the flag of the pinned panel

   uint              m_array_wpx[];             // Array of pixels to save/restore the workspace
   uint              m_array_ppx[];             // Array of pixels to save/restore the panel background

//--- Return the flag that the panel exceeds (1) the height and (2) the width of the corresponding chart size
   bool              HigherWnd(void)      const { return(this.m_h+2>this.m_chart_h);   }
   bool              WiderWnd(void)       const { return(this.m_w+2>this.m_chart_w);   }
//--- Enable/disable modes of working with the chart
   void              SetChartsTool(const bool flag);

//--- Save (1) the working space and (2) the panel background to the pixel array
   void              SaveWorkspace(void);
   void              SaveBackground(void);
//--- Restore (1) the working space and (2) the panel background from the pixel array
   void              RestoreWorkspace(void);
   void              RestoreBackground(void);

//--- Save the pixel array (1) of the working space and the (2) panel background to the file
   bool              FileSaveWorkspace(void);
   bool              FileSaveBackground(void);
//--- Load the pixel array of the (1) working space and (2) the panel background from the file
   bool              FileLoadWorkspace(void);
   bool              FileLoadBackground(void);

//--- Return the subwindow index
   int               GetSubWindow(void) const
                       {
                        return(this.m_program_type==PROGRAM_EXPERT || this.m_program_type==PROGRAM_SCRIPT ? 0 : ::ChartWindowFind());
                       }

protected:
//--- (1) Hide, (2) show and (3) bring the panel to the foreground
   void              Hide(const bool redraw=false);
   void              Show(const bool redraw=false);
   void              BringToTop(void);
//--- Return the chart ID
   long              ChartID(void)        const { return this.m_chart_id;              }
//--- Draw the header area
   void              DrawHeaderArea(const string title);
//--- Redraw the header area using a new color and text values
   void              RedrawHeaderArea(const color new_color=clrNONE,const string title="",const color title_new_color=clrNONE,const ushort new_alpha=USHORT_MAX);
//--- Draw the panel frame
   void              DrawFrame(void);
//--- (1) Draw and (2) redraw the panel closing button
   void              DrawButtonClose(void);
   void              RedrawButtonClose(const color new_back_color=clrNONE,const color new_fore_color=clrNONE,const ushort new_alpha=USHORT_MAX);
//--- (1) Draw and (2) redraw the panel collapse/expand button
   void              DrawButtonMinimize(void);
   void              RedrawButtonMinimize(const color new_back_color=clrNONE,const color new_fore_color=clrNONE,const ushort new_alpha=USHORT_MAX);
//--- (1) Draw and (2) redraw the panel pin button
   void              DrawButtonPin(void);
   void              RedrawButtonPin(const color new_back_color=clrNONE,const color new_fore_color=clrNONE,const ushort new_alpha=USHORT_MAX);

//--- Return the flag for working in the visual tester
   bool              IsVisualMode(void) const
                       { return (bool)::MQLInfoInteger(MQL_VISUAL_MODE);               }
//--- Return the timeframe description
   string            TimeframeDescription(const ENUM_TIMEFRAMES timeframe) const
                       { return ::StringSubstr(EnumToString(timeframe),7);             }

//--- Return the state of mouse buttons
   ENUM_MOUSE_STATE  MouseButtonState(const int x,const int y,bool pressed);
//--- Shift the panel to new coordinates
   void              Move(int x,int y);

//--- Convert RGB to color
   color             RGBToColor(const double r,const double g,const double b) const;
//--- Write RGB component values to variables
   void              ColorToRGB(const color clr,double &r,double &g,double &b);
//--- Return (1) Red, (2) Green, (3) Blue color components
   double            GetR(const color clr)      { return clr&0xff ;                    }
   double            GetG(const color clr)      { return(clr>>8)&0xff;                 }
   double            GetB(const color clr)      { return(clr>>16)&0xff;                }
//--- Return a new color
   color             NewColor(color base_color, int shift_red, int shift_green, int shift_blue);

//--- Draw a panel
   void              Draw(const string title);
//--- (1) Collapse and (2) expand the panel
   void              Collapse(void);
   void              Expand(void);

//--- Set the (1) X and (2) Y panel coordinates
   bool              SetCoordX(const int coord_x);
   bool              SetCoordY(const int coord_y);
//--- Set the panel (1) width and (2) height
   bool              SetWidth(const int width,const bool redraw=false);
   bool              SetHeight(const int height,const bool redraw=false);

public:
//--- Display the panel
   void              View(const string title)   { this.Draw(title);                    }
//--- Return the (1) CCanvas object, (2) working space, (3) object ID
   CCanvas          *Canvas(void)               { return &this.m_canvas;               }
   CCanvas          *Workspace(void)            { return &this.m_workspace;            }
   uint              ID(void)                   { return this.m_id;                    }

//--- Return the panel (1) X and (2) Y coordinates
   int               CoordX(void)         const { return this.m_x;                     }
   int               CoordY(void)         const { return this.m_y;                     }
//--- Return the panel (1) width and (2) height
   int               Width(void)          const { return this.m_w;                     }
   int               Height(void)         const { return this.m_h;                     }

//--- Return the (1) width, (2) height and (3) size of the specified text
   int               TextWidth(const string text)
                       { return this.m_workspace.TextWidth(text);                      }
   int               TextHeight(const string text)
                       { return this.m_workspace.TextHeight(text);                     }
   void              TextSize(const string text,int &width,int &height)
                       { this.m_workspace.TextSize(text,width,height);                 }

//--- Set the close button (1) presence, (2) absence flag
   void              SetButtonCloseOn(void);
   void              SetButtonCloseOff(void);
//--- Set the collapse/expand button (1) presence, (2) absence flag
   void              SetButtonMinimizeOn(void);
   void              SetButtonMinimizeOff(void);

//--- Set the panel coordinates
   bool              SetCoords(const int x,const int y);
//--- Set the panel size
   bool              SetSizes(const int w,const int h,const bool update=false);
//--- Set panel coordinates and size
   bool              SetParams(const int x,const int y,const int w,const int h,const bool update=false);

//--- Set the transparency of the panel (1) header and (2) working space
   void              SetHeaderTransparency(const uchar value);
   void              SetTransparency(const uchar value);
//--- Set default panel font parameters
   void              SetFontParams(const string name,const int size,const uint flags=0,const uint angle=0);
//--- Display a text message at the specified coordinates
   void              DrawText(const string text,const int x,const int y,const int width=WRONG_VALUE,const int height=WRONG_VALUE);
//--- Draw a (1) background grid (2) with automatic cell size
   void              DrawGrid(const uint x,const uint y,const uint rows,const uint columns,const uint row_size,const uint col_size,const color line_color=clrNONE,bool alternating_color=true);
   void              DrawGridAutoFill(const uint border,const uint rows,const uint columns,const color line_color=clrNONE,bool alternating_color=true);
//--- Print grid data (line intersection coordinates)
   void              GridPrint(const uint indent=0)   { this.m_table_data.Print(indent);  }
//--- Write the X and Y coordinate values of the specified table cell to variables
   void              CellXY(const uint row,const uint column, int &x, int &y) { this.m_table_data.CellXY(row,column,x,y);  }
//--- Return the (1) X and (2) Y coordinate of the specified table cell
   int               CellX(const uint row,const uint column)         { return this.m_table_data.CellX(row,column);         }
   int               CellY(const uint row,const uint column)         { return this.m_table_data.CellY(row,column);         }

//--- Event handler
   void              OnChartEvent(const int id,const long &lparam,const double &dparam,const string &sparam);
//--- Constructor/destructor
                     CDashboard(const uint id,const int x,const int y, const int w,const int h,const int wnd=-1);
                    ~CDashboard();
  };
声明的变量和类方法在代码中有详细的注释。让我们来看看一些方法的实现。
类的构造函数:
//+------------------------------------------------------------------+
//| Constructor                                                      |
//+------------------------------------------------------------------+
CDashboard::CDashboard(const uint id,const int x,const int y, const int w,const int h,const int wnd=-1) :
                        m_id(id),
                        m_chart_id(::ChartID()),
                        m_program_type((ENUM_PROGRAM_TYPE)::MQLInfoInteger(MQL_PROGRAM_TYPE)),
                        m_program_name(::MQLInfoString(MQL_PROGRAM_NAME)),
                        m_wnd(wnd==-1 ? GetSubWindow() : wnd),
                        m_chart_w((int)::ChartGetInteger(m_chart_id,CHART_WIDTH_IN_PIXELS,m_wnd)),
                        m_chart_h((int)::ChartGetInteger(m_chart_id,CHART_HEIGHT_IN_PIXELS,m_wnd)),
                        m_mouse_state(MOUSE_STATE_NOT_PRESSED),
                        m_x(x),
                        m_y(::ChartGetInteger(m_chart_id,CHART_SHOW_ONE_CLICK) ? (y<79 ? 79 : y) : y),
                        m_w(w),
                        m_h(h),
                        m_x_dock(m_x),
                        m_y_dock(m_y),
                        m_header(true),
                        m_butt_close(true),
                        m_butt_minimize(true),
                        m_butt_pin(true),
                        m_header_h(18),

                        //--- Panel header implementation
                        m_header_alpha(128),
                        m_header_alpha_c(m_header_alpha),
                        m_header_back_color(C'0,153,188'),
                        m_header_back_color_c(m_header_back_color),
                        m_header_fore_color(C'182,255,244'),
                        m_header_fore_color_c(m_header_fore_color),
                        m_header_border_color(C'167,167,168'),
                        m_header_border_color_c(m_header_border_color),
                        m_title("Dashboard"),
                        m_title_font("Calibri"),
                        m_title_font_size(-100),

                        //--- close button
                        m_butt_close_back_color(C'0,153,188'),
                        m_butt_close_back_color_c(m_butt_close_back_color),
                        m_butt_close_fore_color(clrWhite),
                        m_butt_close_fore_color_c(m_butt_close_fore_color),

                        //--- collapse/expand button
                        m_butt_min_back_color(C'0,153,188'),
                        m_butt_min_back_color_c(m_butt_min_back_color),
                        m_butt_min_fore_color(clrWhite),
                        m_butt_min_fore_color_c(m_butt_min_fore_color),

                        //--- pin button
                        m_butt_pin_back_color(C'0,153,188'),
                        m_butt_pin_back_color_c(m_butt_min_back_color),
                        m_butt_pin_fore_color(clrWhite),
                        m_butt_pin_fore_color_c(m_butt_min_fore_color),

                        //--- Panel implementation
                        m_alpha(240),
                        m_alpha_c(m_alpha),
                        m_fore_alpha(255),
                        m_fore_alpha_c(m_fore_alpha),
                        m_back_color(C'240,240,240'),
                        m_back_color_c(m_back_color),
                        m_fore_color(C'53,0,0'),
                        m_fore_color_c(m_fore_color),
                        m_border_color(C'167,167,168'),
                        m_border_color_c(m_border_color),
                        m_font("Calibri"),
                        m_font_size(-100),

                        m_minimized(false),
                        m_movable(true)
  {
//--- Set the permission for the chart to send messages about events of moving and pressing mouse buttons,
//--- mouse scroll events, as well as graphical object creation/deletion
   ::ChartSetInteger(this.m_chart_id,CHART_EVENT_MOUSE_MOVE,true);
   ::ChartSetInteger(this.m_chart_id,CHART_EVENT_MOUSE_WHEEL,true);
   ::ChartSetInteger(this.m_chart_id,CHART_EVENT_OBJECT_CREATE,true);
   ::ChartSetInteger(this.m_chart_id,CHART_EVENT_OBJECT_DELETE,true);

//--- Set the names of global terminal variables to store panel coordinates, collapsed/expanded state and pinning
   this.m_name_gv_x=this.m_program_name+"_id_"+(string)this.m_id+"_"+(string)this.m_chart_id+"_X";
   this.m_name_gv_y=this.m_program_name+"_id_"+(string)this.m_id+"_"+(string)this.m_chart_id+"_Y";
   this.m_name_gv_m=this.m_program_name+"_id_"+(string)this.m_id+"_"+(string)this.m_chart_id+"_Minimize";
   this.m_name_gv_u=this.m_program_name+"_id_"+(string)this.m_id+"_"+(string)this.m_chart_id+"_Unpin";

//--- If a global variable does not exist, create it and write the current value,
//--- otherwise - read the value from the terminal global variable into it
//--- X coordinate
   if(!::GlobalVariableCheck(this.m_name_gv_x))
      ::GlobalVariableSet(this.m_name_gv_x,this.m_x);
   else
      this.m_x=(int)::GlobalVariableGet(this.m_name_gv_x);
//--- Y coordinate
   if(!::GlobalVariableCheck(this.m_name_gv_y))
      ::GlobalVariableSet(this.m_name_gv_y,this.m_y);
   else
      this.m_y=(int)::GlobalVariableGet(this.m_name_gv_y);
//--- Collapsed/expanded
   if(!::GlobalVariableCheck(this.m_name_gv_m))
      ::GlobalVariableSet(this.m_name_gv_m,this.m_minimized);
   else
      this.m_minimized=(int)::GlobalVariableGet(this.m_name_gv_m);
//--- Collapsed/not collapsed
   if(!::GlobalVariableCheck(this.m_name_gv_u))
      ::GlobalVariableSet(this.m_name_gv_u,this.m_movable);
   else
      this.m_movable=(int)::GlobalVariableGet(this.m_name_gv_u);

//--- Set the flags for the size of the panel exceeding the size of the chart window
   this.m_higher_wnd=this.HigherWnd();
   this.m_wider_wnd=this.WiderWnd();

//--- If the panel graphical resource is created,
   if(this.m_canvas.CreateBitmapLabel(this.m_chart_id,this.m_wnd,"P"+(string)this.m_id,this.m_x,this.m_y,this.m_w,this.m_h,COLOR_FORMAT_ARGB_NORMALIZE))
     {
      //--- set the canvas font and fill the canvas with the transparent color
      this.m_canvas.FontSet(this.m_title_font,this.m_title_font_size,FW_BOLD);
      this.m_canvas.Erase(0x00FFFFFF);
     }
//--- otherwise - report unsuccessful object creation to the journal
   else
      ::PrintFormat("%s: Error. CreateBitmapLabel for canvas failed",(string)__FUNCTION__);

//--- If a working space of a graphical resource is created,
   if(this.m_workspace.CreateBitmapLabel(this.m_chart_id,this.m_wnd,"W"+(string)this.m_id,this.m_x+1,this.m_y+this.m_header_h,this.m_w-2,this.m_h-this.m_header_h-1,COLOR_FORMAT_ARGB_NORMALIZE))
     {
      //--- set the font for the working area and fill it with the transparent color
      this.m_workspace.FontSet(this.m_font,this.m_font_size);
      this.m_workspace.Erase(0x00FFFFFF);
     }
//--- otherwise - report unsuccessful object creation to the journal
   else
      ::PrintFormat("%s: Error. CreateBitmapLabel for workspace failed",(string)__FUNCTION__);
  }
该类有一个含一个参数的构造函数和一个默认创建的构造函数。当然,我们只对参数型感兴趣。它将在创建类对象时使用。一个唯一的对象ID、面板的初始坐标、面板的宽度和高度以及将放置面板的子窗口的索引通过形式参数传递给构造函数。
需要唯一的面板ID,以便类可以创建具有唯一名称的对象。如果在一个图表上使用多个带有面板的指标,则为了避免对象名称冲突,您需要此唯一编号,该编号将在创建面板对象时添加到面板对象的名称中。ID的唯一性应该是可重复的——每次新发布时,编号应该与上次发布时相同。例如,GetTickCount()不适合ID。
如果子窗口索引是默认设置的(-1),则会以编程方式进行搜索,否则我们将使用参数中指定的索引。
默认参数在构造函数初始化列表中设置。一些负责视觉效果的参数具有两个变量——默认值和当前属性值。这对于交互式更改是必要的,例如,当悬停在这些参数负责的面板区域上时。
构造函数主体包含全局终端变量的值。创建了两个图形对象-画布和面板工作区。
所有构造函数代码都有详细的注释。
类的析构函数:
//+------------------------------------------------------------------+
//| Destructor                                                       |
//+------------------------------------------------------------------+
CDashboard::~CDashboard()
  {
//--- Write the current values to global terminal variables
   ::GlobalVariableSet(this.m_name_gv_x,this.m_x);
   ::GlobalVariableSet(this.m_name_gv_y,this.m_y);
   ::GlobalVariableSet(this.m_name_gv_m,this.m_minimized);
   ::GlobalVariableSet(this.m_name_gv_u,this.m_movable);
//--- Delete panel objects
   this.m_canvas.Destroy();
   this.m_workspace.Destroy();
  }
在这里,我们首先将坐标和标志重置为全局终端变量,然后删除画布和工作空间对象。
要使用光标和鼠标按钮与面板交互,我们需要知道光标相对于面板及其控制元素的位置。当光标移动时,我们可以跟踪它的坐标和类事件处理程序中按钮的状态。类事件处理函数具有与标准OnChartEvent处理函数相同的参数:
void  OnChartEvent()
   const int       id,       // event ID
   const long&     lparam,   // long type event parameter
   const double&   dparam,   // double type event parameter
   const string&   sparam    // string type event parameter
   );
参数
id
[in]ENUM_CHART_Event枚举中的事件ID。
lparam
[in]long类型事件参数
dparam
[in] double 类型事件参数
sparam
[in] string 类型事件参数
返回值
没有返回值
注意
使用预定义的OnChartEvent()函数可以处理11种类型的事件。为自定义事件提供了65535个ID,从CHARTEVENT_CUSTOM 到 CHARTEVENT_CUSTOM_LAST。要生成自定义事件,请使用EventChartCustom()函数。
ENUM_CHART_event枚举中的简短事件描述:
- CHARTEVENT_KEYDOWN——当图表窗口处于焦点位置时,按下键盘上的一个键;
- CHARTEVENT_MOUSE_MOVE——移动鼠标并点击鼠标按钮(如果图表设置了CHART_EVENT_MOUSE_MOVE=true);
- CHARTEVENT_OJECT_CREATE——创建图形对象(如果为图表设置了CHART_EVENT_OBJECT_CREATE=true);
- CHARTEVENT_OJECT_CHANGE--通过属性对话框更改对象属性;
- CHARTEVENT_OJECT_DELETE—删除图形对象(如果图表设置了CHART_EVENT_OBJECT_DELETE=true);
- CHARTEVENT_CLICK--单击图表;
- CHARTEVENT_OJECT_CLICK——鼠标单击属于图表的图形对象;
- CHARTEVENT_OJECT_DRAG—用鼠标拖动图形对象;
- CHARTEVENT_OBJECT_ENDEDIT——完成图形对象的编辑输入框中的文本编辑(OBJ_EDIT);
- CHARTEVENT_CHART_CHANGE--更改图表;
- CHARTEVENT_CUSTOM+n—自定义事件ID,其中n在0到65535之间。CHARTEVENT_CCUSTOM_LAST包含最后一个可接受的自定义事件ID(CHARTEVENT_CCUSTOM+65535)。
lparam参数包含X坐标,dparam包含Y坐标,而sparam包含用于确定鼠标按钮状态的标志值组合。所有这些参数都需要相对于面板及其元素的坐标进行接收和处理。应该确定状态并将其发送到类事件处理程序,在该处理程序中将指定对所有这些状态的反应。
返回光标和鼠标按钮相对于面板的状态的方法:
//+------------------------------------------------------------------+
//| Returns the state of the mouse cursor and button                 |
//+------------------------------------------------------------------+
ENUM_MOUSE_STATE CDashboard::MouseButtonState(const int x,const int y,bool pressed)
  {
//--- If the button is pressed
   if(pressed)
     {
      //--- If the state has already been saved, exit
      if(this.m_mouse_state!=MOUSE_STATE_NOT_PRESSED)
         return this.m_mouse_state;
      //--- If the button is pressed inside the window
      if(x>this.m_x && x<this.m_x+this.m_w && y>this.m_y && y<this.m_y+this.m_h)
        {
         //--- If the button is pressed inside the header
         if(y>this.m_y && y<=this.m_y+this.m_header_h)
           {
            //--- Bring the panel to the foreground
            this.BringToTop();
            //--- Coordinates of the close, collapse/expand and pin buttons
            int wc=(this.m_butt_close ? this.m_header_h : 0);
            int wm=(this.m_butt_minimize ? this.m_header_h : 0);
            int wp=(this.m_butt_pin ? this.m_header_h : 0);
            //--- If the close button is pressed, return this state
            if(x>this.m_x+this.m_w-wc)
               return MOUSE_STATE_PRESSED_INSIDE_CLOSE;
            //--- If the collapse/expand button is pressed, return this state
            if(x>this.m_x+this.m_w-wc-wm)
               return MOUSE_STATE_PRESSED_INSIDE_MINIMIZE;
            //--- If the pin button is pressed, return this state
            if(x>this.m_x+this.m_w-wc-wm-wp)
               return MOUSE_STATE_PRESSED_INSIDE_PIN;
            //--- If the button is not pressed on the control buttons of the panel, record and return the state of the button press inside the header
            this.m_mouse_state=MOUSE_STATE_PRESSED_INSIDE_HEADER;
            return this.m_mouse_state;
           }
         //--- If a button inside the window is pressed, write the state to a variable and return it
         else if(y>this.m_y+this.m_header_h && y<this.m_y+this.m_h)
           {
            this.m_mouse_state=MOUSE_STATE_PRESSED_INSIDE_WINDOW;
            return this.m_mouse_state;
           }
        }
      //--- The button is pressed outside the window - write the state to a variable and return it
      else
        {
         this.m_mouse_state=MOUSE_STATE_PRESSED_OUTSIDE_WINDOW;
         return this.m_mouse_state;
        }
     }
//--- If the button is not pressed
   else
     {
      //--- Write the state of the unpressed button to the variable
      this.m_mouse_state=MOUSE_STATE_NOT_PRESSED;
      //--- If the cursor is inside the panel
      if(x>this.m_x && x<this.m_x+this.m_w && y>this.m_y && y<this.m_y+this.m_h)
        {
         //--- If the cursor is inside the header
         if(y>this.m_y && y<=this.m_y+this.m_header_h)
           {
            //--- Specify the width of the close, collapse/expand and pin buttons
            int wc=(this.m_butt_close ? this.m_header_h : 0);
            int wm=(this.m_butt_minimize ? this.m_header_h : 0);
            int wp=(this.m_butt_pin ? this.m_header_h : 0);
            //--- If the cursor is inside the close button, return this state
            if(x>this.m_x+this.m_w-wc)
               return MOUSE_STATE_INSIDE_CLOSE;
            //--- If the cursor is inside the minimize/expand button, return this state
            if(x>this.m_x+this.m_w-wc-wm)
               return MOUSE_STATE_INSIDE_MINIMIZE;
            //--- If the cursor is inside the pin button, return this state
            if(x>this.m_x+this.m_w-wc-wm-wp)
               return MOUSE_STATE_INSIDE_PIN;
            //--- If the cursor is outside the buttons inside the header area, return this state
            return MOUSE_STATE_INSIDE_HEADER;
           }
         //--- Otherwise, the cursor is inside the working space. Return this state
         else
            return MOUSE_STATE_INSIDE_WINDOW;
        }
     }
//--- In any other case, return the state of the unpressed mouse button
   return MOUSE_STATE_NOT_PRESSED;
  }
方法逻辑已在代码注释中详细描述。我们只需确定光标、面板及其元素的相互坐标,然后返回状态。按下或释放鼠标按钮的标志会立即发送到该方法。对于每个这样的状态,都有自己的代码块,用于定义按下按钮或释放按钮时的状态。以这种方式使用逻辑非常简单快捷,但也有一些缺点——你无法检测到鼠标点击了控制元素。相反,你只能检测到点击它。通常,当释放鼠标按钮时会记录单击,当按下鼠标按钮时则会记录按住。按照这里使用的逻辑,按下鼠标按钮是唯一被认为是点击并按住的动作。
此方法中获得的状态应发送到事件处理函数,其中每个事件都有自己的处理过程,可以更改面板的行为和外观:
//+------------------------------------------------------------------+
//| Event handler                                                    |
//+------------------------------------------------------------------+
void CDashboard::OnChartEvent(const int id,const long &lparam,const double &dparam,const string &sparam)
  {
//--- If a graphical object is created
   if(id==CHARTEVENT_OBJECT_CREATE)
     {
      this.BringToTop();
      ::ObjectSetInteger(this.m_chart_id,sparam,OBJPROP_SELECTED,true);
     }
//--- If the chart is changed
   if(id==CHARTEVENT_CHART_CHANGE)
     {
      //--- Get the chart subwindow index (it may change when removing the window of any indicator)
      this.m_wnd=this.GetSubWindow();
      //--- Get the new chart size
      int w=(int)::ChartGetInteger(this.m_chart_id,CHART_WIDTH_IN_PIXELS,this.m_wnd);
      int h=(int)::ChartGetInteger(this.m_chart_id,CHART_HEIGHT_IN_PIXELS,this.m_wnd);
      //--- Determine whether the panel dimensions extend beyond the chart window
      this.m_higher_wnd=this.HigherWnd();
      this.m_wider_wnd=this.WiderWnd();
      //--- If the chart height has changed, adjust the panel vertical position
      if(this.m_chart_h!=h)
        {
         this.m_chart_h=h;
         int y=this.m_y;
         if(this.m_y+this.m_h>h-1)
            y=h-this.m_h-1;
         if(y<1)
            y=1;
         this.Move(this.m_x,y);
        }
      //--- If the chart weight has changed, adjust the panel horizontal position
      if(this.m_chart_w!=w)
        {
         this.m_chart_w=w;
         int x=this.m_x;
         if(this.m_x+this.m_w>w-1)
            x=w-this.m_w-1;
         if(x<1)
            x=1;
         this.Move(x,this.m_y);
        }
     }

//--- Declare variables to store the current cursor shift relative to the initial coordinates of the panel
   static int diff_x=0;
   static int diff_y=0;

//--- Get the flag of the held mouse button. We also take into account the right button for the visual tester (sparam=="2")
   bool pressed=(!this.IsVisualMode() ? (sparam=="1" || sparam=="" ? true : false) : sparam=="1" || sparam=="2" ? true : false);
//--- Get the cursor X and Y coordinates. Take into account the shift for the Y coordinate when working in the chart subwindow
   int  mouse_x=(int)lparam;
   int  mouse_y=(int)dparam-(int)::ChartGetInteger(this.m_chart_id,CHART_WINDOW_YDISTANCE,this.m_wnd);
//--- Get the state of the cursor and mouse buttons relative to the panel
   ENUM_MOUSE_STATE state=this.MouseButtonState(mouse_x,mouse_y,pressed);
//--- If the cursor moves
   if(id==CHARTEVENT_MOUSE_MOVE)
     {
      //--- If a button is pressed inside the working area of the panel
      if(state==MOUSE_STATE_PRESSED_INSIDE_WINDOW)
        {
         //--- Disable chart scrolling, right-click menu and crosshair
         this.SetChartsTool(false);
         //--- Redraw the header area with the default background color
         if(this.m_header_back_color_c!=this.m_header_back_color)
           {
            this.RedrawHeaderArea(this.m_header_back_color);
            this.m_canvas.Update();
           }
         return;
        }
      //--- If a button is pressed inside the panel header area
      else if(state==MOUSE_STATE_PRESSED_INSIDE_HEADER)
        {
         //--- Disable chart scrolling, right-click menu and crosshair
         this.SetChartsTool(false);
         //--- Redraw the header area with a new background color
         color new_color=this.NewColor(this.m_header_back_color,-10,-10,-10);
         if(this.m_header_back_color_c!=new_color)
           {
            this.RedrawHeaderArea(new_color);
            this.m_canvas.Update();
           }
         //--- Shift the panel following the cursor taking into account the amount of cursor displacement relative to the initial coordinates of the panel
         if(this.m_movable)
            this.Move(mouse_x-diff_x,mouse_y-diff_y);
         return;
        }

      //--- If the close button is pressed
      else if(state==MOUSE_STATE_PRESSED_INSIDE_CLOSE)
        {
         //--- Disable chart scrolling, right-click menu and crosshair
         this.SetChartsTool(false);
         //--- Redraw the close button with a new background color
         color new_color=this.NewColor(clrRed,0,40,40);
         if(this.m_butt_close_back_color_c!=new_color)
           {
            this.RedrawButtonClose(new_color);
            this.m_canvas.Update();
           }
         //--- Close button press handling should be defined in the program.
         //--- Send the click event of this button to its OnChartEvent handler.
         //--- Event ID 1001,
         //--- lparam=panel ID (m_id),
         //--- dparam=0
         //--- sparam="Close button pressed"
         ushort event=CHARTEVENT_CUSTOM+1;
         ::EventChartCustom(this.m_chart_id,ushort(event-CHARTEVENT_CUSTOM),this.m_id,0,"Close button pressed");
        }
      //--- If the panel collapse/expand button is pressed
      else if(state==MOUSE_STATE_PRESSED_INSIDE_MINIMIZE)
        {
         //--- Disable chart scrolling, right-click menu and crosshair
         this.SetChartsTool(false);
         //--- "flip" the panel collapse flag,
         this.m_minimized=!this.m_minimized;
         //--- redraw the panel taking into account the new state of the flag,
         this.Draw(this.m_title);
         //--- redraw the panel header area
         this.RedrawHeaderArea();
         //--- If the panel is pinned and expanded, move it to the stored location coordinates
         if(this.m_minimized && !this.m_movable)
            this.Move(this.m_x_dock,this.m_y_dock);
         //--- Update the canvas with chart redrawing and
         this.m_canvas.Update();
         //--- write the state of the panel expand flag to the global terminal variable
         ::GlobalVariableSet(this.m_name_gv_m,this.m_minimized);
        }
      //--- If the panel pin button is pressed
      else if(state==MOUSE_STATE_PRESSED_INSIDE_PIN)
        {
         //--- Disable chart scrolling, right-click menu and crosshair
         this.SetChartsTool(false);
         //--- "flip" the panel collapse flag,
         this.m_movable=!this.m_movable;
         //--- Redraw the pin button with a new background color
         color new_color=this.NewColor(this.m_butt_pin_back_color,30,30,30);
         if(this.m_butt_pin_back_color_c!=new_color)
            this.RedrawButtonPin(new_color);
         //--- If the panel is collapsed and pinned, save its coordinates
         //--- When expanded and collapsed again, the panel returns to these coordinates
         //--- Relevant for pinning a collapsed panel at the bottom of the screen
         if(this.m_minimized && !this.m_movable)
           {
            this.m_x_dock=this.m_x;
            this.m_y_dock=this.m_y;
           }
         //--- Update the canvas with chart redrawing and
         this.m_canvas.Update();
         //--- write the state of the panel movability flag to the global terminal variable
         ::GlobalVariableSet(this.m_name_gv_u,this.m_movable);
        }

      //--- If the cursor is inside the panel header area
      else if(state==MOUSE_STATE_INSIDE_HEADER)
        {
         //--- Disable chart scrolling, right-click menu and crosshair
         this.SetChartsTool(false);
         //--- Redraw the header area with a new background color
         color new_color=this.NewColor(this.m_header_back_color,20,20,20);
         if(this.m_header_back_color_c!=new_color)
           {
            this.RedrawHeaderArea(new_color);
            this.m_canvas.Update();
           }
        }

      //--- If the cursor is inside the close button
      else if(state==MOUSE_STATE_INSIDE_CLOSE)
        {
         //--- Disable chart scrolling, right-click menu and crosshair
         this.SetChartsTool(false);
         //--- Redraw the header area with a minimal change in the background color
         color new_color=this.NewColor(this.m_header_back_color,0,0,1);
         if(this.m_header_back_color_c!=new_color)
            this.RedrawHeaderArea(new_color);
         //--- Redraw the collapse/expand button with the default background color
         if(this.m_butt_min_back_color_c!=this.m_butt_min_back_color)
            this.RedrawButtonMinimize(this.m_butt_min_back_color);
         //--- Redraw the pin button with the default background color
         if(this.m_butt_pin_back_color_c!=this.m_butt_pin_back_color)
            this.RedrawButtonPin(this.m_butt_pin_back_color);
         //--- Redraw the close button with the red background color
         if(this.m_butt_close_back_color_c!=clrRed)
           {
            this.RedrawButtonClose(clrRed);
            this.m_canvas.Update();
           }
        }

      //--- If the cursor is inside the collapse/expand button
      else if(state==MOUSE_STATE_INSIDE_MINIMIZE)
        {
         //--- Disable chart scrolling, right-click menu and crosshair
         this.SetChartsTool(false);
         //--- Redraw the header area with a minimal change in the background color
         color new_color=this.NewColor(this.m_header_back_color,0,0,1);
         if(this.m_header_back_color_c!=new_color)
            this.RedrawHeaderArea(new_color);
         //--- Redraw the close button with the default background color
         if(this.m_butt_close_back_color_c!=this.m_butt_close_back_color)
            this.RedrawButtonClose(this.m_butt_close_back_color);
         //--- Redraw the pin button with the default background color
         if(this.m_butt_pin_back_color_c!=this.m_butt_pin_back_color)
            this.RedrawButtonPin(this.m_butt_pin_back_color);
         //--- Redraw the collapse/expand button with a new background color
         new_color=this.NewColor(this.m_butt_min_back_color,20,20,20);
         if(this.m_butt_min_back_color_c!=new_color)
           {
            this.RedrawButtonMinimize(new_color);
            this.m_canvas.Update();
           }
        }

      //--- If the cursor is inside the pin button
      else if(state==MOUSE_STATE_INSIDE_PIN)
        {
         //--- Disable chart scrolling, right-click menu and crosshair
         this.SetChartsTool(false);
         //--- Redraw the header area with a minimal change in the background color
         color new_color=this.NewColor(this.m_header_back_color,0,0,1);
         if(this.m_header_back_color_c!=new_color)
            this.RedrawHeaderArea(new_color);
         //--- Redraw the close button with the default background color
         if(this.m_butt_close_back_color_c!=this.m_butt_close_back_color)
            this.RedrawButtonClose(this.m_butt_close_back_color);
         //--- Redraw the collapse/expand button with the default background color
         if(this.m_butt_min_back_color_c!=this.m_butt_min_back_color)
            this.RedrawButtonMinimize(this.m_butt_min_back_color);
         //--- Redraw the pin button with a new background color
         new_color=this.NewColor(this.m_butt_pin_back_color,20,20,20);
         if(this.m_butt_pin_back_color_c!=new_color)
           {
            this.RedrawButtonPin(new_color);
            this.m_canvas.Update();
           }
        }

      //--- If the cursor is inside the working space
      else if(state==MOUSE_STATE_INSIDE_WINDOW)
        {
         //--- Disable chart scrolling, right-click menu and crosshair
         this.SetChartsTool(false);
         //--- Redraw the header area with the default background color
         if(this.m_header_back_color_c!=this.m_header_back_color)
           {
            this.RedrawHeaderArea(this.m_header_back_color);
            this.m_canvas.Update();
           }
        }
      //--- Otherwise (the cursor is outside the panel, and we need to restore the chart parameters)
      else
        {
         //--- Enable chart scrolling, right-click menu and crosshair
         this.SetChartsTool(true);
         //--- Redraw the header area with the default background color
         if(this.m_header_back_color_c!=this.m_header_back_color)
           {
            this.RedrawHeaderArea(this.m_header_back_color);
            this.m_canvas.Update();
           }
        }
      //--- Write the cursor shift by X and Y relative to the panel initial coordinates
      diff_x=mouse_x-this.m_x;
      diff_y=mouse_y-this.m_y;
     }
  }
事件处理程序的逻辑在代码中有足够详细的注释。我们应该在这里考虑一些值得注意的要点。
处理创建新图形对象的事件是在一开始就指定的:
//--- If a graphical object is created
   if(id==CHARTEVENT_OBJECT_CREATE)
     {
      this.BringToTop();
      ::ObjectSetInteger(this.m_chart_id,sparam,OBJPROP_SELECTED,true);
     }
它的功能是什么?如果我们创建一个新的图形对象,它会被放置在图表上其他图形对象的上方,并相应地叠加在面板的顶部。因此,当定义这样的事件时,面板立即被带到前台,然后一个新的图形对象被高亮显示。为什么呢?如果不这样做,那么需要多个点进行构建的图形对象(例如趋势线)将无法正常创建——它们的所有控制点都位于同一坐标中,对象本身将不可见。这种情况是由于在创建图形对象的过程中,当面板被带到前台时,图形对象失去了控制。因此,在将面板置于前景之后,应该强制选择新的图形对象。
因此,面板和图形对象在创建时的相互行为如下:
图6. 新的图形对象构建在面板的“下方”,创建时不会失去焦点
事件处理函数对每个状态都有自己的处理块,所有这些块的逻辑都是相同的。例如,处理面板标题上的鼠标单击并按住:
      //--- If a button is pressed inside the panel header area
      else if(state==MOUSE_STATE_PRESSED_INSIDE_HEADER)
        {
         //--- Disable chart scrolling, right-click menu and crosshair
         this.SetChartsTool(false);
         //--- Redraw the header area with a new background color
         color new_color=this.NewColor(this.m_header_back_color,-10,-10,-10);
         if(this.m_header_back_color_c!=new_color)
           {
            this.RedrawHeaderArea(new_color);
            this.m_canvas.Update();
           }
         //--- Shift the panel following the cursor taking into account the amount of cursor displacement relative to the initial coordinates of the panel
         if(this.m_movable)
            this.Move(mouse_x-diff_x,mouse_y-diff_y);
         return;
        }
为了防止图表与面板一起移动,将禁用鼠标滚动图表、右键单击菜单和十字光标等事件。由于表头应在视觉上响应鼠标捕捉,因此其颜色会变暗。在将颜色更改为新颜色之前,我们需要检查它是否已经更改。不断地将其更改为相同颜色而浪费CPU资源是没有意义的。如果未禁用移动(面板未固定),我们会将其移动到新的坐标,该坐标是根据鼠标坐标减去光标位置相对于面板左上角的偏移量计算得出的。如果不考虑偏移,面板将精确定位在左上角的光标坐标处。
将面板移动到指定坐标的方法:
//+------------------------------------------------------------------+
//| Move the panel                                                   |
//+------------------------------------------------------------------+
void CDashboard::Move(int x,int y)
  {
   int h=this.m_canvas.Height();
   int w=this.m_canvas.Width();
   if(!this.m_wider_wnd)
     {
      if(x+w>this.m_chart_w-1)
         x=this.m_chart_w-w-1;
      if(x<1)
         x=1;
     }
   else
     {
      if(x>1)
         x=1;
      if(x<this.m_chart_w-w-1)
         x=this.m_chart_w-w-1;
     }
   if(!this.m_higher_wnd)
     {
      if(y+h>this.m_chart_h-2)
         y=this.m_chart_h-h-2;
      if(y<1)
         y=1;
     }
   else
     {
      if(y>1)
         y=1;
      if(y<this.m_chart_h-h-2)
         y=this.m_chart_h-h-2;
     }
   if(this.SetCoords(x,y))
      this.m_canvas.Update();
  }
应移动面板的坐标将传递给该方法。如果更改坐标时面板位于图表外部,则会调整坐标,使面板始终位于图表窗口内部,从任何边缘缩进1个像素。在完成面板坐标的所有检查和调整后,将建立其在图表上位置的新坐标。
设置面板坐标的方法:
//+------------------------------------------------------------------+
//| Set the panel X coordinate                                       |
//+------------------------------------------------------------------+
bool CDashboard::SetCoordX(const int coord_x)
  {
   int x=(int)::ObjectGetInteger(this.m_chart_id,this.m_canvas.ChartObjectName(),OBJPROP_XDISTANCE);
   if(x==coord_x)
      return true;
   if(!::ObjectSetInteger(this.m_chart_id,this.m_canvas.ChartObjectName(),OBJPROP_XDISTANCE,coord_x))
      return false;
   if(!::ObjectSetInteger(this.m_chart_id,this.m_workspace.ChartObjectName(),OBJPROP_XDISTANCE,coord_x+1))
      return false;
   this.m_x=coord_x;
   return true;
  }
//+------------------------------------------------------------------+
//| Set the panel Y coordinate                                       |
//+------------------------------------------------------------------+
bool CDashboard::SetCoordY(const int coord_y)
  {
   int y=(int)::ObjectGetInteger(this.m_chart_id,this.m_canvas.ChartObjectName(),OBJPROP_YDISTANCE);
   if(y==coord_y)
      return true;
   if(!::ObjectSetInteger(this.m_chart_id,this.m_canvas.ChartObjectName(),OBJPROP_YDISTANCE,coord_y))
      return false;
   if(!::ObjectSetInteger(this.m_chart_id,this.m_workspace.ChartObjectName(),OBJPROP_YDISTANCE,coord_y+this.m_header_h))
      return false;
   this.m_y=coord_y;
   return true;
  }
如果将与面板坐标相等的坐标传递给该方法,则无需再次设置该坐标-只需返回该方法的成功。首先移动画布,然后移动工作空间。考虑到工作空间在画布上的相对位置,工作空间在面板内部的左侧移动一个像素,在顶部移动标题的高度。
设置面板尺寸的方法:
//+------------------------------------------------------------------+
//| Set the panel width                                              |
//+------------------------------------------------------------------+
bool CDashboard::SetWidth(const int width,const bool redraw=false)
  {
   if(width<4)
     {
      ::PrintFormat("%s: Error. Width cannot be less than 4px",(string)__FUNCTION__);
      return false;
     }
   if(width==this.m_canvas.Width())
      return true;
   if(!this.m_canvas.Resize(width,this.m_canvas.Height()))
      return false;
   if(width-2<1)
      ::ObjectSetInteger(this.m_chart_id,this.m_workspace.ChartObjectName(),OBJPROP_TIMEFRAMES,OBJ_NO_PERIODS);
   else
     {
      ::ObjectSetInteger(this.m_chart_id,this.m_workspace.ChartObjectName(),OBJPROP_TIMEFRAMES,OBJ_ALL_PERIODS);
      if(!this.m_workspace.Resize(width-2,this.m_workspace.Height()))
         return false;
     }
   this.m_w=width;
   return true;
  }
//+------------------------------------------------------------------+
//| Set the panel height                                             |
//+------------------------------------------------------------------+
bool CDashboard::SetHeight(const int height,const bool redraw=false)
  {
   if(height<::fmax(this.m_header_h,1))
     {
      ::PrintFormat("%s: Error. Width cannot be less than %lupx",(string)__FUNCTION__,::fmax(this.m_header_h,1));
      return false;
     }
   if(height==this.m_canvas.Height())
      return true;
   if(!this.m_canvas.Resize(this.m_canvas.Width(),height))
      return false;
   if(height-this.m_header_h-2<1)
      ::ObjectSetInteger(this.m_chart_id,this.m_workspace.ChartObjectName(),OBJPROP_TIMEFRAMES,OBJ_NO_PERIODS);
   else
     {
      ::ObjectSetInteger(this.m_chart_id,this.m_workspace.ChartObjectName(),OBJPROP_TIMEFRAMES,OBJ_ALL_PERIODS);
      if(!this.m_workspace.Resize(this.m_workspace.Width(),height-this.m_header_h-2))
         return false;
     }
   this.m_h=height;
   return true;
  }
这里所有的都与设置坐标时完全相同-如果传递给方法的大小与面板已经具有的大小相同,那么方法只需返回true。一个值得注意的细节是,工作空间总是比画布小。如果在减小工作空间的大小时,结果发现该大小小于1,那么为了避免调整大小的错误,只需隐藏工作空间而不更改其大小。
同时设置两个坐标、所有尺寸和坐标以及面板尺寸的辅助方法:
//+------------------------------------------------------------------+
//| Set the panel coordinates                                        |
//+------------------------------------------------------------------+
bool CDashboard::SetCoords(const int x,const int y)
  {
   bool res=true;
   res &=this.SetCoordX(x);
   res &=this.SetCoordY(y);
   return res;
  }
//+------------------------------------------------------------------+
//| Set the panel size                                               |
//+------------------------------------------------------------------+
bool CDashboard::SetSizes(const int w,const int h,const bool update=false)
  {
   bool res=true;
   res &=this.SetWidth(w);
   res &=this.SetHeight(h);
   if(res && update)
      this.Expand();
   return res;
  }
//+------------------------------------------------------------------+
//| Set panel coordinates and size                                   |
//+------------------------------------------------------------------+
bool CDashboard::SetParams(const int x,const int y,const int w,const int h,const bool update=false)
  {
   bool res=true;
   res &=this.SetCoords(x,y);
   res &=this.SetSizes(w,h);
   if(res && update)
      this.Expand();
   return res;
  }
这些方法接收参数和更新标志。如果参数和更新标志设置成功,将调用面板展开方法,在该方法中,所有面板元素都将被重新绘制。
绘制标题区域的方法:
//+------------------------------------------------------------------+
//| Draw the header area                                             |
//+------------------------------------------------------------------+
void CDashboard::DrawHeaderArea(const string title)
  {
//--- Exit if the header is not used
   if(!this.m_header)
      return;
//--- Set the title text
   this.m_title=title;
//--- The Y coordinate of the text is located vertically in the center of the header area
   int y=this.m_header_h/2;
//--- Fill the area with color
   this.m_canvas.FillRectangle(0,0,this.m_w-1,this.m_header_h-1,::ColorToARGB(this.m_header_back_color,this.m_header_alpha));
//--- Display the header text
   this.m_canvas.TextOut(2,y,this.m_title,::ColorToARGB(this.m_header_fore_color,this.m_header_alpha),TA_LEFT|TA_VCENTER);
//--- Save the current header background color
   this.m_header_back_color_c=this.m_header_back_color;
//--- Draw control elements (close, collapse/expand and pin buttons) and
   this.DrawButtonClose();
   this.DrawButtonMinimize();
   this.DrawButtonPin();
//--- update the canvas without redrawing the screen
   this.m_canvas.Update(false);
  }
该方法绘制标题区域-在标题坐标处绘制一个矩形区域,并绘制控件-关闭、折叠/展开和固定按钮。将使用默认的标题区域颜色和透明度。
重新绘制标题区域的方法:
//+------------------------------------------------------------------+
//| Redraw header area                                               |
//+------------------------------------------------------------------+
void CDashboard::RedrawHeaderArea(const color new_color=clrNONE,const string title="",const color title_new_color=clrNONE,const ushort new_alpha=USHORT_MAX)
  {
//--- Exit if the header is not used or all passed parameters have default values
   if(!this.m_header || (new_color==clrNONE && title=="" && title_new_color==clrNONE && new_alpha==USHORT_MAX))
      return;
//--- Exit if all passed parameters are equal to those already set
   if(new_color==this.m_header_back_color && title==this.m_title && title_new_color==this.m_header_fore_color && new_alpha==this.m_header_alpha)
      return;
//--- If the title is not equal to the default value, set a new title
   if(title!="")
      this.m_title=title;
//--- Define new background and text colors, and transparency
   color back_clr=(new_color!=clrNONE ? new_color : this.m_header_back_color);
   color fore_clr=(title_new_color!=clrNONE ? title_new_color : this.m_header_fore_color);
   uchar alpha=uchar(new_alpha==USHORT_MAX ? this.m_header_alpha : new_alpha>255 ? 255 : new_alpha);
//--- The Y coordinate of the text is located vertically in the center of the header area
   int y=this.m_header_h/2;
//--- Fill the area with color
   this.m_canvas.FillRectangle(0,0,this.m_w-1,this.m_header_h-1,::ColorToARGB(back_clr,alpha));
//--- Display the header text
   this.m_canvas.TextOut(2,y,this.m_title,::ColorToARGB(fore_clr,alpha),TA_LEFT|TA_VCENTER);
//--- Save the current header background color, text and transparency
   this.m_header_back_color_c=back_clr;
   this.m_header_fore_color_c=fore_clr;
   this.m_header_alpha_c=alpha;
//--- Draw control elements (close, collapse/expand and pin buttons) and
   this.RedrawButtonClose(back_clr,clrNONE,alpha);
   this.RedrawButtonMinimize(back_clr,clrNONE,alpha);
   this.RedrawButtonPin(back_clr,clrNONE,alpha);
//--- update the canvas without redrawing the screen
   this.m_canvas.Update(true);
  }
新的背景颜色、新的标题文本、新的标题文本颜色和新的透明度将传递给该方法。如果传递的参数与已设置的参数完全相同,则退出该方法。该方法用于更新标题颜色、文本和透明度。
绘制面板边框的方法:
//+------------------------------------------------------------------+
//| Draw the panel frame                                             |
//+------------------------------------------------------------------+
void CDashboard::DrawFrame(void)
  {
   this.m_canvas.Rectangle(0,0,this.m_w-1,this.m_h-1,::ColorToARGB(this.m_border_color,this.m_alpha));
   this.m_border_color_c=this.m_border_color;
   this.m_canvas.Update(false);
  }
在画布周边绘制一个框架,并将设置的颜色保存为当前颜色。
绘制面板关闭按钮的方法:
//+------------------------------------------------------------------+
//| Draws the panel close button                                     |
//+------------------------------------------------------------------+
void CDashboard::DrawButtonClose(void)
  {
//--- Exit if the button is not used
   if(!this.m_butt_close)
      return;
//--- The button width is equal to the height of the header area
   int w=this.m_header_h;
//--- Button coordinates and size
   int x1=this.m_w-w;
   int x2=this.m_w-1;
   int y1=0;
   int y2=w-1;
//--- Shift of the upper left corner of the rectangular area of the image from the upper left corner of the button
   int shift=4;
//--- Draw the button background
   this.m_canvas.FillRectangle(x1,y1,x2,y2,::ColorToARGB(this.m_butt_close_back_color,this.m_header_alpha));
//--- Draw the close button
   this.m_canvas.LineThick(x1+shift+1,y1+shift+1,x2-shift,y2-shift,::ColorToARGB(this.m_butt_close_fore_color,255),3,STYLE_SOLID,LINE_END_ROUND);
   this.m_canvas.LineThick(x1+shift+1,y2-shift-1,x2-shift,y1+shift,::ColorToARGB(this.m_butt_close_fore_color,255),3,STYLE_SOLID,LINE_END_ROUND);
//--- Remember the current background color and button design
   this.m_butt_close_back_color_c=this.m_butt_close_back_color;
   this.m_butt_close_fore_color_c=this.m_butt_close_fore_color;
//--- update the canvas without redrawing the screen
   this.m_canvas.Update(false);
  }
代码注释中描述了整个逻辑:绘制背景和顶部的关闭图标(十字)。
重新绘制面板关闭按钮的方法:
//+------------------------------------------------------------------+
//| Redraw the panel close button                                    |
//+------------------------------------------------------------------+
void CDashboard::RedrawButtonClose(const color new_back_color=clrNONE,const color new_fore_color=clrNONE,const ushort new_alpha=USHORT_MAX)
  {
//--- Exit if the button is not used or all passed parameters have default values
   if(!this.m_butt_close || (new_back_color==clrNONE && new_fore_color==clrNONE && new_alpha==USHORT_MAX))
      return;
//--- The button width is equal to the height of the header area
   int w=this.m_header_h;
//--- Button coordinates and size
   int x1=this.m_w-w;
   int x2=this.m_w-1;
   int y1=0;
   int y2=w-1;
//--- Shift of the upper left corner of the rectangular area of the image from the upper left corner of the button
   int shift=4;
//--- Define new background and text colors, and transparency
   color back_color=(new_back_color!=clrNONE ? new_back_color : this.m_butt_close_back_color);
   color fore_color=(new_fore_color!=clrNONE ? new_fore_color : this.m_butt_close_fore_color);
   uchar alpha=uchar(new_alpha==USHORT_MAX ? this.m_header_alpha : new_alpha>255 ? 255 : new_alpha);
//--- Draw the button background
   this.m_canvas.FillRectangle(x1,y1,x2,y2,::ColorToARGB(back_color,alpha));
//--- Draw the close button
   this.m_canvas.LineThick(x1+shift+1,y1+shift+1,x2-shift,y2-shift,::ColorToARGB(fore_color,255),3,STYLE_SOLID,LINE_END_ROUND);
   this.m_canvas.LineThick(x1+shift+1,y2-shift-1,x2-shift,y1+shift,::ColorToARGB(fore_color,255),3,STYLE_SOLID,LINE_END_ROUND);
//--- Remember the current background color and button design
   this.m_butt_close_back_color_c=back_color;
   this.m_butt_close_fore_color_c=fore_color;
//--- update the canvas without redrawing the screen
   this.m_canvas.Update(false);
  }
为了重新绘制,至少有一个传递的参数应该与当前参数不同。除了选择和设置新的绘图参数外,其余部分与按钮绘图方法相同。
绘制和重绘折叠/展开和固定按钮的其他方法:
//+------------------------------------------------------------------+
//| Draw the panel collapse/expand button                            |
//+------------------------------------------------------------------+
void CDashboard::DrawButtonMinimize(void)
  {
//--- Exit if the button is not used
   if(!this.m_butt_minimize)
      return;
//--- The button width is equal to the height of the header area
   int w=this.m_header_h;
//--- The width of the close button is zero if the button is not used
   int wc=(this.m_butt_close ? w : 0);
//--- Button coordinates and size
   int x1=this.m_w-wc-w;
   int x2=this.m_w-wc-1;
   int y1=0;
   int y2=w-1;
//--- Shift of the upper left corner of the rectangular area of the image from the upper left corner of the button
   int shift=4;
//--- Draw the button background
   this.m_canvas.FillRectangle(x1,y1,x2,y2,::ColorToARGB(this.m_butt_min_back_color,this.m_header_alpha));
//--- If the panel is collapsed, draw a rectangle
   if(this.m_minimized)
      this.m_canvas.Rectangle(x1+shift,y1+shift,x2-shift,y2-shift,::ColorToARGB(this.m_butt_min_fore_color,255));
//--- Otherwise, the panel is expanded. Draw a line segment
   else
      this.m_canvas.LineThick(x1+shift,y2-shift,x2-shift,y2-shift,::ColorToARGB(this.m_butt_min_fore_color,255),3,STYLE_SOLID,LINE_END_ROUND);
//--- Remember the current background color and button design
   this.m_butt_min_back_color_c=this.m_butt_min_back_color;
   this.m_butt_min_fore_color_c=this.m_butt_min_fore_color;
//--- update the canvas without redrawing the screen
   this.m_canvas.Update(false);
  }
//+------------------------------------------------------------------+
//| Redraw the panel collapse/expand button                          |
//+------------------------------------------------------------------+
void CDashboard::RedrawButtonMinimize(const color new_back_color=clrNONE,const color new_fore_color=clrNONE,const ushort new_alpha=USHORT_MAX)
  {
//--- Exit if the button is not used or all passed parameters have default values
   if(!this.m_butt_minimize || (new_back_color==clrNONE && new_fore_color==clrNONE && new_alpha==USHORT_MAX))
      return;
//--- The button width is equal to the height of the header area
   int w=this.m_header_h;
//--- The width of the close button is zero if the button is not used
   int wc=(this.m_butt_close ? w : 0);
//--- Button coordinates and size
   int x1=this.m_w-wc-w;
   int x2=this.m_w-wc-1;
   int y1=0;
   int y2=w-1;
//--- Shift of the upper left corner of the rectangular area of the image from the upper left corner of the button
   int shift=4;
//--- Define new background and text colors, and transparency
   color back_color=(new_back_color!=clrNONE ? new_back_color : this.m_butt_min_back_color);
   color fore_color=(new_fore_color!=clrNONE ? new_fore_color : this.m_butt_min_fore_color);
   uchar alpha=uchar(new_alpha==USHORT_MAX ? this.m_header_alpha : new_alpha>255 ? 255 : new_alpha);
//--- Draw the button background
   this.m_canvas.FillRectangle(x1,y1,x2,y2,::ColorToARGB(back_color,alpha));
//--- If the panel is collapsed, draw a rectangle
   if(this.m_minimized)
      this.m_canvas.Rectangle(x1+shift,y1+shift,x2-shift,y2-shift,::ColorToARGB(fore_color,255));
//--- Otherwise, the panel is expanded. Draw a line segment
   else
      this.m_canvas.LineThick(x1+shift,y2-shift,x2-shift,y2-shift,::ColorToARGB(fore_color,255),3,STYLE_SOLID,LINE_END_ROUND);
//--- Remember the current background color and button design
   this.m_butt_min_back_color_c=back_color;
   this.m_butt_min_fore_color_c=fore_color;
//--- update the canvas without redrawing the screen
   this.m_canvas.Update(false);
  }
//+------------------------------------------------------------------+
//| Draw the panel pin button                                        |
//+------------------------------------------------------------------+
void CDashboard::DrawButtonPin(void)
  {
//--- Exit if the button is not used
   if(!this.m_butt_pin)
      return;
//--- The button width is equal to the height of the header area
   int w=this.m_header_h;
//--- The width of the close and collapse buttons is zero if the button is not used
   int wc=(this.m_butt_close ? w : 0);
   int wm=(this.m_butt_minimize ? w : 0);
//--- Button coordinates and size
   int x1=this.m_w-wc-wm-w;
   int x2=this.m_w-wc-wm-1;
   int y1=0;
   int y2=w-1;
//--- Draw the button background
   this.m_canvas.FillRectangle(x1,y1,x2,y2,::ColorToARGB(this.m_butt_pin_back_color,this.m_header_alpha));
//--- Coordinates of the broken line points
   int x[]={x1+3, x1+6, x1+3,x1+4,x1+6,x1+9,x1+9,x1+10,x1+15,x1+14,x1+13,x1+10,x1+10,x1+9,x1+6};
   int y[]={y1+14,y1+11,y1+8,y1+7,y1+7,y1+4,y1+3,y1+2, y1+7, y1+8, y1+8, y1+11,y1+13,y1+14,y1+11};
//--- Draw the "button" shape
   this.m_canvas.Polygon(x,y,::ColorToARGB(this.m_butt_pin_fore_color,255));
//--- If the movability flag is reset (pinned) - cross out the drawn button
   if(!this.m_movable)
      this.m_canvas.Line(x1+3,y1+2,x1+15,y1+14,::ColorToARGB(this.m_butt_pin_fore_color,255));
//--- Remember the current background color and button design
   this.m_butt_pin_back_color_c=this.m_butt_pin_back_color;
   this.m_butt_pin_fore_color_c=this.m_butt_pin_fore_color;
//--- update the canvas without redrawing the screen
   this.m_canvas.Update(false);
  }
//+------------------------------------------------------------------+
//| Redraw the panel pin button                                      |
//+------------------------------------------------------------------+
void CDashboard::RedrawButtonPin(const color new_back_color=clrNONE,const color new_fore_color=clrNONE,const ushort new_alpha=USHORT_MAX)
  {
//--- Exit if the button is not used or all passed parameters have default values
   if(!this.m_butt_pin || (new_back_color==clrNONE && new_fore_color==clrNONE && new_alpha==USHORT_MAX))
      return;
//--- The button width is equal to the height of the header area
   int w=this.m_header_h;
//--- The width of the close and collapse buttons is zero if the button is not used
   int wc=(this.m_butt_close ? w : 0);
   int wm=(this.m_butt_minimize ? w : 0);
//--- Button coordinates and size
   int x1=this.m_w-wc-wm-w;
   int x2=this.m_w-wc-wm-1;
   int y1=0;
   int y2=w-1;
//--- Define new background and text colors, and transparency
   color back_color=(new_back_color!=clrNONE ? new_back_color : this.m_butt_pin_back_color);
   color fore_color=(new_fore_color!=clrNONE ? new_fore_color : this.m_butt_pin_fore_color);
   uchar alpha=uchar(new_alpha==USHORT_MAX ? this.m_header_alpha : new_alpha>255 ? 255 : new_alpha);
//--- Draw the button background
   this.m_canvas.FillRectangle(x1,y1,x2,y2,::ColorToARGB(back_color,alpha));
//--- Coordinates of the broken line points
   int x[]={x1+3, x1+6, x1+3,x1+4,x1+6,x1+9,x1+9,x1+10,x1+15,x1+14,x1+13,x1+10,x1+10,x1+9,x1+6};
   int y[]={y1+14,y1+11,y1+8,y1+7,y1+7,y1+4,y1+3,y1+2, y1+7, y1+8, y1+8, y1+11,y1+13,y1+14,y1+11};
//--- Draw the "button" shape
   this.m_canvas.Polygon(x,y,::ColorToARGB(this.m_butt_pin_fore_color,255));
//--- If the movability flag is reset (pinned) - cross out the drawn button
   if(!this.m_movable)
      this.m_canvas.Line(x1+3,y1+2,x1+15,y1+14,::ColorToARGB(this.m_butt_pin_fore_color,255));
//--- Remember the current background color and button design
   this.m_butt_pin_back_color_c=back_color;
   this.m_butt_pin_fore_color_c=fore_color;
//--- update the canvas without redrawing the screen
   this.m_canvas.Update(false);
  }
这些方法与绘制和重新绘制关闭按钮的方法相同。逻辑完全相同,并且写在代码的注释中。
绘制面板的方法:
//+------------------------------------------------------------------+
//| Draw the panel                                                   |
//+------------------------------------------------------------------+
void CDashboard::Draw(const string title)
  {
//--- Set the title text
   this.m_title=title;
//--- If the collapse flag is not set, expand the panel
   if(!this.m_minimized)
      this.Expand();
//--- Otherwise, collapse the panel
   else
      this.Collapse();
//--- Update the canvas without redrawing the chart
   this.m_canvas.Update(false);
//--- Update the working space and redraw the chart
   this.m_workspace.Update();
  }
如果未设置折叠标志,就展开面板(以展开形式绘制)。如果设置了折叠标志,则折叠面板:以折叠的形式绘制面板,只留下标题。
折叠面板的方法:
//+------------------------------------------------------------------+
//| Collapse the panel                                               |
//+------------------------------------------------------------------+
void CDashboard::Collapse(void)
  {
//--- Save the pixels of the working space and the panel background into arrays
   this.SaveWorkspace();
   this.SaveBackground();
//--- Remember the current height of the panel
   int h=this.m_h;
//--- Change the dimensions (height) of the canvas and working space
   if(!this.SetSizes(this.m_canvas.Width(),this.m_header_h))
      return;
//--- Draw the header area
   this.DrawHeaderArea(this.m_title);
//--- Return the saved panel height to the variable
   this.m_h=h;
  }
在折叠面板之前,我们需要将背景和工作空间的所有像素保存到阵列中。这对于通过简单地从像素阵列恢复面板图像和工作空间而不是重新绘制面板来快速扩展面板是必要的。此外,我们可以在面板的背景上绘制一些额外的装饰(例如,铭牌)。它们也将与背景一起保存,然后恢复。
展开面板的方法:
//+------------------------------------------------------------------+
//| Expand the panel                                                 |
//+------------------------------------------------------------------+
void CDashboard::Expand(void)
  {
//--- Resize the panel
   if(!this.SetSizes(this.m_canvas.Width(),this.m_h))
      return;
//--- If the panel background pixels have never been saved into an array
   if(this.m_array_ppx.Size()==0)
     {
      //--- Draw the panel and
      this.m_canvas.Erase(::ColorToARGB(this.m_back_color,this.m_alpha));
      this.DrawFrame();
      this.DrawHeaderArea(this.m_title);
      //--- save the background pixels of the panel and working space into arrays
      this.SaveWorkspace();
      this.SaveBackground();
     }
//--- If the background pixels of the panel and working space were previously saved,
   else
     {
      //--- restore the background pixels of the panel and working space from arrays
      this.RestoreBackground();
      if(this.m_array_wpx.Size()>0)
         this.RestoreWorkspace();
     }
//--- If, after expanding, the panel goes beyond the chart window, adjust the panel location
   if(this.m_y+this.m_canvas.Height()>this.m_chart_h-1)
      this.Move(this.m_x,this.m_chart_h-1-this.m_canvas.Height());
  }
如果保存背景和工作区像素的数组为空,则我们使用绘图方法绘制整个面板。如果数组已经填充,那么只需从数组中恢复面板的背景及其工作空间。
使用颜色的辅助方法:
//+------------------------------------------------------------------+
//| Returns color with a new color component                         |
//+------------------------------------------------------------------+
color CDashboard::NewColor(color base_color, int shift_red, int shift_green, int shift_blue)
  {
   double clR=0, clG=0, clB=0;
   this.ColorToRGB(base_color,clR,clG,clB);
   double clRn=(clR+shift_red  < 0 ? 0 : clR+shift_red  > 255 ? 255 : clR+shift_red);
   double clGn=(clG+shift_green< 0 ? 0 : clG+shift_green> 255 ? 255 : clG+shift_green);
   double clBn=(clB+shift_blue < 0 ? 0 : clB+shift_blue > 255 ? 255 : clB+shift_blue);
   return this.RGBToColor(clRn,clGn,clBn);
  }
//+------------------------------------------------------------------+
//| Convert RGB to color                                             |
//+------------------------------------------------------------------+
color CDashboard::RGBToColor(const double r,const double g,const double b) const
  {
   int int_r=(int)::round(r);
   int int_g=(int)::round(g);
   int int_b=(int)::round(b);
   int clr=0;
   clr=int_b;
   clr<<=8;
   clr|=int_g;
   clr<<=8;
   clr|=int_r;
//---
   return (color)clr;
  }
//+------------------------------------------------------------------+
//| Getting values of the RGB components                             |
//+------------------------------------------------------------------+
void CDashboard::ColorToRGB(const color clr,double &r,double &g,double &b)
  {
   r=GetR(clr);
   g=GetG(clr);
   b=GetB(clr);
  }
当光标与面板控件交互时,需要这些方法来更改颜色。
设置标题透明度的方法:
//+------------------------------------------------------------------+
//| Set the header transparency                                      |
//+------------------------------------------------------------------+
void CDashboard::SetHeaderTransparency(const uchar value)
  {
   this.m_header_alpha=value;
   if(this.m_header_alpha_c!=this.m_header_alpha)
      this.RedrawHeaderArea(clrNONE,NULL,clrNONE,value);
   this.m_header_alpha_c=value;
  }
首先,将传递给方法的透明度值写入存储默认透明度的变量,然后将新值与当前值进行比较。如果值不相等,则会完全重新绘制标题区域。最后,将设置的透明度写入当前透明度。
设置面板透明度的方法:
//+------------------------------------------------------------------+
//| Set the panel transparency                                       |
//+------------------------------------------------------------------+
void CDashboard::SetTransparency(const uchar value)
  {
   this.m_alpha=value;
   if(this.m_alpha_c!=this.m_alpha)
     {
      this.m_canvas.Erase(::ColorToARGB(this.m_back_color,value));
      this.DrawFrame();
      this.RedrawHeaderArea(clrNONE,NULL,clrNONE,value);
      this.m_canvas.Update(false);
     }
   this.m_alpha_c=value;
  }
其逻辑与上述方法类似。如果传递给该方法的透明度不等于当前透明度,则会使用新的透明度完全重新绘制面板。
设置工作空间默认字体参数的方法:
//+------------------------------------------------------------------+
//| Set the default font parameters of the working space             |
//+------------------------------------------------------------------+
void CDashboard::SetFontParams(const string name,const int size,const uint flags=0,const uint angle=0)
  {
   if(!this.m_workspace.FontSet(name,size*-10,flags,angle))
     {
      ::PrintFormat("%s: Failed to set font options. Error %lu",(string)__FUNCTION__,::GetLastError());
      return;
     }
   this.m_font=name;
   this.m_font_size=size*-10;
  }
传递给方法的字体参数(字体名称、大小、标志和角度)设置为工作空间的CCanvas对象,并存储在变量中。
传递给该方法的字体大小乘以-10,原因如TextSetFont函数注释所述:
字体大小是使用正值或负值设置的。该符号定义文本大小是否取决于操作系统设置(字体比例)。
启用/禁用图表工作模式的方法:
//+------------------------------------------------------------------+
//| Enable/disable modes of working with the chart                   |
//+------------------------------------------------------------------+
void CDashboard::SetChartsTool(const bool flag)
  {
//--- If the 'true' flag is passed and if chart scrolling is disabled
   if(flag && !::ChartGetInteger(this.m_chart_id,CHART_MOUSE_SCROLL))
     {
      //--- enable chart scrolling, right-click menu and crosshair
      ::ChartSetInteger(0,CHART_MOUSE_SCROLL,true);
      ::ChartSetInteger(0,CHART_CONTEXT_MENU,true);
      ::ChartSetInteger(0,CHART_CROSSHAIR_TOOL,true);
     }
//--- otherwise, if the 'false' flag is passed and if chart scrolling is enabled
   else if(!flag && ::ChartGetInteger(this.m_chart_id,CHART_MOUSE_SCROLL))
     {
      //--- disable chart scrolling, right-click menu and crosshair
      ::ChartSetInteger(0,CHART_MOUSE_SCROLL,false);
      ::ChartSetInteger(0,CHART_CONTEXT_MENU,false);
      ::ChartSetInteger(0,CHART_CROSSHAIR_TOOL,false);
     }
  }
根据传递的标志,该方法检查用鼠标滚动图表的状态,并启用或禁用所有使用图表的模式。当光标在面板窗口内或外时,为了不不断发送设置模式的命令,有必要检查滚动模式。切换模式仅在光标进入面板或光标离开其限制时发生。
将文本消息输出到指定坐标的方法:
//+------------------------------------------------------------------+
//| Display a text message at the specified coordinates              |
//+------------------------------------------------------------------+
void CDashboard::DrawText(const string text,const int x,const int y,const int width=WRONG_VALUE,const int height=WRONG_VALUE)
  {
//--- Declare variables to record the text width and height in them
   int w=width;
   int h=height;
//--- If the width and height of the text passed to the method have zero values,
//--- then the entire working space is completely cleared using the transparent color
   if(width==0 && height==0)
      this.m_workspace.Erase(0x00FFFFFF);
//--- Otherwise
   else
     {
      //--- If the passed width and height have default values (-1), we get its width and height from the text
      if(width==WRONG_VALUE && height==WRONG_VALUE)
         this.m_workspace.TextSize(text,w,h);
      //--- otherwise,
      else
        {
         //--- if the width passed to the method has the default value (-1) - get the width from the text, or
         //--- if the width passed to the method has a value greater than zero, use the width passed to the method, or
         //--- if the width passed to the method has a zero value, use the value 1 for the width
         w=(width ==WRONG_VALUE ? this.m_workspace.TextWidth(text)  : width>0  ? width  : 1);
         //--- if the height passed to the method has a default value (-1), get the height from the text, or
         //--- if the height passed to the method has a value greater than zero, use the height passed to the method, or
         //--- if the height passed to the method has a zero value, use value 1 for the height
         h=(height==WRONG_VALUE ? this.m_workspace.TextHeight(text) : height>0 ? height : 1);
        }
      //--- Fill the space according to the specified coordinates and the resulting width and height with a transparent color (erase the previous entry)
      this.m_workspace.FillRectangle(x,y,x+w,y+h,0x00FFFFFF);
     }
//--- Display the text to the space cleared of previous text and update the working space without redrawing the screen
   this.m_workspace.TextOut(x,y,text,::ColorToARGB(this.m_fore_color));
   this.m_workspace.Update(false);
  }
在画布上显示图形的情况下,使用画布需要像在画布上使用画笔一样在画布上绘制这些图形。画布上绘制的一个图像被放置在首先绘制的另一个图像的顶部。要替换图像,您应该完全重新绘制整个画布,或者计算上一个图像的尺寸,擦除此区域,然后在擦除的区域上绘制下一个图像。
对于文本,我们可以获得画布上已经绘制的文本的尺寸,以便在绘制下一个文本之前擦除该区域。将所有先前绘制的文本和形状存储在对象的某个位置绝非最佳解决方案。因此,在精确性和简单性与最优性之间进行选择。在这里,我们将获得当前文本的尺寸(可能与之前在此位置绘制的文本的宽度不匹配),并在显示下一个文本之前使用这些尺寸擦除之前绘制的文本。
如果前一个文本的宽度与当前文本的宽度不相同,或者更大,则不会全部擦除。对于这种情况,该方法提供用于传递指示擦除区域在高度和宽度上的所需尺寸的参数:
- 如果传递给该方法的宽度和高度值等于-1(默认情况下),则等于当前文本宽度和高度的区域将被擦除,
- 如果传递零则整个工作空间被完全擦除,
- 如果传递的宽度或高度值大于零,则这些值将分别用于宽度和高度。
面板类设计用于以表格格式显示数据。为了方便计算面板上显示的数据的坐标和面板的视觉设计,提供了两种方法,即计算表格单元格的坐标和在面板背景上绘制铭牌(如有必要)。
- 第一种方法根据传递给它的数据计算表格单元格的坐标:面板中表格的初始X和Y坐标、行数、列数、行高和列宽。我们还可以为表格网格线和“交替”行的属性指定自定义的颜色。
- 第二种方法根据行和列的数量和从面板边缘开始的表格缩进宽度自动计算行和列大小。在第二种方法中,我们还可以为表格网格线和“交替”行的属性指定自己的颜色。
根据给定参数绘制背景网格的方法:
//+------------------------------------------------------------------+
//| Draw the background grid                                         |
//+------------------------------------------------------------------+
void CDashboard::DrawGrid(const uint x,const uint y,const uint rows,const uint columns,const uint row_size,const uint col_size,
                          const color line_color=clrNONE,bool alternating_color=true)
  {
//--- If the panel is collapsed, leave
   if(this.m_minimized)
      return;
//--- Clear all lists of the tabular data object (remove cells from rows and all rows)
   this.m_table_data.Clear();
//--- Line height cannot be less than 2
   int row_h=int(row_size<2 ? 2 : row_size);
//--- Column width cannot be less than 2
   int col_w=int(col_size<2 ? 2 : col_size);

//--- The X1 (left) coordinate of the table cannot be less than 1 (to leave one pixel around the perimeter of the panel for the frame)
   int x1=int(x<1 ? 1 : x);
//--- Calculate the X2 coordinate (right) depending on the number of columns and their width
   int x2=x1+col_w*int(columns>0 ? columns : 1);
//--- The Y1 coordinate is located under the panel title area
   int y1=this.m_header_h+(int)y;
//--- Calculate the Y2 coordinate (bottom) depending on the number of lines and their height
   int y2=y1+row_h*int(rows>0 ? rows : 1);

//--- Get the color of the table grid lines, either by default or passed to the method
   color clr=(line_color==clrNONE ? C'200,200,200' : line_color);
//--- If the initial X coordinate is greater than 1, draw a table frame
//--- (in case of the coordinate 1, the table frame is the panel frame)
   if(x1>1)
      this.m_canvas.Rectangle(x1,y1,x2,y2,::ColorToARGB(clr,this.m_alpha));
//--- In the loop by table rows,
   for(int i=0;i<(int)rows;i++)
     {
      //--- calculate the Y coordinate of the next horizontal grid line (Y coordinate of the next table row)
      int row_y=y1+row_h*i;
      //--- if the flag of "alternating" line colors is passed and the line is even
      if(alternating_color && i%2==0)
        {
         //--- lighten the table background color and draw a background rectangle
         color new_color=this.NewColor(clr,45,45,45);
         this.m_canvas.FillRectangle(x1+1,row_y+1,x2-1,row_y+row_h-1,::ColorToARGB(new_color,this.m_alpha));
        }
      //--- Draw a table grid horizontal line
      this.m_canvas.Line(x1,row_y,x2,row_y,::ColorToARGB(clr,this.m_alpha));

      //--- Create a new table row object
      CTableRow *row_obj=new CTableRow(i);
      if(row_obj==NULL)
        {
         ::PrintFormat("%s: Failed to create table row object at index %lu",(string)__FUNCTION__,i);
         continue;
        }
      //--- Add it to the list of rows of the tabular data object
      //--- (if adding an object failed, delete the created object)
      if(!this.m_table_data.AddRow(row_obj))
         delete row_obj;
      //--- Set its Y coordinate in the created row object taking into account the offset from the panel title
      row_obj.SetY(row_y-this.m_header_h);
     }
//--- In the loop by table columns,
   for(int i=0;i<(int)columns;i++)
     {
      //--- calculate the X coordinate of the next vertical grid line (X coordinate of the next table row)
      int col_x=x1+col_w*i;
      //--- If the grid line goes beyond the panel, interrupt the loop
      if(x1==1 && col_x>=x1+m_canvas.Width()-2)
         break;
      //--- Draw a vertical line of the table grid
      this.m_canvas.Line(col_x,y1,col_x,y2,::ColorToARGB(clr,this.m_alpha));

      //--- Get the number of created rows from the table data object
      int total=this.m_table_data.RowsTotal();
      //--- In the loop by table rows
      for(int j=0;j<total;j++)
        {
         //--- get the next row
         CTableRow *row=m_table_data.GetRow(j);
         if(row==NULL)
            continue;
         //--- Create a new table cell
         CTableCell *cell=new CTableCell(row.Row(),i);
         if(cell==NULL)
           {
            ::PrintFormat("%s: Failed to create table cell object at index %lu",(string)__FUNCTION__,i);
            continue;
           }
         //--- Add the created cell to the row
         //--- (if adding an object failed, delete the created object)
         if(!row.AddCell(cell))
           {
            delete cell;
            continue;
           }
         //--- In the created cell object, set its X coordinate and the Y coordinate from the row object
         cell.SetXY(col_x,row.Y());
        }
     }
//--- Update the canvas without redrawing the chart
   this.m_canvas.Update(false);
  }
该方法的逻辑以及绘制表格和在表格数据对象中创建其实例的顺序在几乎每一行的代码中都有详细描述。将需要写入表格数据对象中绘制表格实例的数据来获得每个单元格的坐标,以便在面板上显示数据时方便地指示所需的坐标。我们只需要根据单元格在表中的位置(行和列)指定单元格编号,并在面板上获取该单元格左上角的坐标。
绘制具有自动单元格大小的背景网格的方法:
//+------------------------------------------------------------------+
//| Draws the background grid with automatic cell sizing             |
//+------------------------------------------------------------------+
void CDashboard::DrawGridAutoFill(const uint border,const uint rows,const uint columns,const color line_color=clrNONE,bool alternating_color=true)
  {
//--- If the panel is collapsed, leave
   if(this.m_minimized)
      return;
//--- X1 (left) table coordinate
   int x1=(int)border;
//--- X2 (right) table coordinate
   int x2=this.m_canvas.Width()-(int)border-1;
//--- Y1 (upper) table coordinate
   int y1=this.m_header_h+(int)border;
//--- Y2 (lower) table coordinate
   int y2=this.m_canvas.Height()-(int)border-1;

//--- Get the color of the table grid lines, either by default or passed to the method
   color clr=(line_color==clrNONE ? C'200,200,200' : line_color);
//--- If the offset from the edge of the panel is greater than zero, draw a table border,
//--- otherwise, the panel border is used as the table border
   if(border>0)
      this.m_canvas.Rectangle(x1,y1,x2,y2,::ColorToARGB(clr,this.m_alpha));

//--- Height of the entire table grid
   int greed_h=y2-y1;
//--- Calculate the row height depending on the table height and the number of rows
   int row_h=(int)::round((double)greed_h/(double)rows);
//--- In the loop based on the number of rows
   for(int i=0;i<(int)rows;i++)
     {
      //--- calculate the Y coordinate of the next horizontal grid line (Y coordinate of the next table row)
      int row_y=y1+row_h*i;
      //--- if the flag of "alternating" line colors is passed and the line is even
      if(alternating_color && i%2==0)
        {
         //--- lighten the table background color and draw a background rectangle
         color new_color=this.NewColor(clr,45,45,45);
         this.m_canvas.FillRectangle(x1+1,row_y+1,x2-1,row_y+row_h-1,::ColorToARGB(new_color,this.m_alpha));
        }
      //--- Draw a table grid horizontal line
      this.m_canvas.Line(x1,row_y,x2,row_y,::ColorToARGB(clr,this.m_alpha));

      //--- Create a new table row object
      CTableRow *row_obj=new CTableRow(i);
      if(row_obj==NULL)
        {
         ::PrintFormat("%s: Failed to create table row object at index %lu",(string)__FUNCTION__,i);
         continue;
        }
      //--- Add it to the list of rows of the tabular data object
      //--- (if adding an object failed, delete the created object)
      if(!this.m_table_data.AddRow(row_obj))
         delete row_obj;
      //--- Set its Y coordinate in the created row object taking into account the offset from the panel title
      row_obj.SetY(row_y-this.m_header_h);
     }

//--- Table grid width
   int greed_w=x2-x1;
//--- Calculate the column width depending on the table width and the number of columns
   int col_w=(int)::round((double)greed_w/(double)columns);
//--- In the loop by table columns,
   for(int i=0;i<(int)columns;i++)
     {
      //--- calculate the X coordinate of the next vertical grid line (X coordinate of the next table row)
      int col_x=x1+col_w*i;
      //--- If this is not the very first vertical line, draw it
      //--- (the first vertical line is either the table frame or the panel frame)
      if(i>0)
         this.m_canvas.Line(col_x,y1,col_x,y2,::ColorToARGB(clr,this.m_alpha));

      //--- Get the number of created rows from the table data object
      int total=this.m_table_data.RowsTotal();
      //--- In the loop by table rows
      for(int j=0;j<total;j++)
        {
         //--- get the next row
         CTableRow *row=this.m_table_data.GetRow(j);
         if(row==NULL)
            continue;
         //--- Create a new table cell
         CTableCell *cell=new CTableCell(row.Row(),i);
         if(cell==NULL)
           {
            ::PrintFormat("%s: Failed to create table cell object at index %lu",(string)__FUNCTION__,i);
            continue;
           }
         //--- Add the created cell to the row
         //--- (if adding an object failed, delete the created object)
         if(!row.AddCell(cell))
           {
            delete cell;
            continue;
           }
         //--- In the created cell object, set its X coordinate and the Y coordinate from the row object
         cell.SetXY(col_x,row.Y());
        }
     }
//--- Update the canvas without redrawing the chart
   this.m_canvas.Update(false);
  }
该方法与上述方法的不同之处仅在于根据面板边缘的表格缩进、行高(表格高度/行数)和列宽(表格宽度/列数)自动计算表格宽度和高度。它也直接在代码中进行了完整的注释。
创建面板并在图表上绘制后,您需要创建(在面板上绘制)这些铭牌。否则,将不会绘制铭牌,但表格数据将全部计算出来并可以使用。换言之,只有在面板上绘制表格的情况下,才需要在图表上显示面板后绘制表格。
为了快速恢复面板和工作空间的背景,我们使用数组在面板折叠之前从工作空间和面板的图像中接收像素。展开面板时,面板的背景和工作空间只是从像素数组中恢复,而不是重新绘制之前在面板上绘制的所有内容。这比保存画布上绘制的所有内容以便以后重新绘制要实用得多。
面板和工作空间有两种方法——将图像保存到像素数组和从像素数组恢复图像。
将工作空间保存到像素数组的方法:
//+------------------------------------------------------------------+
//| Save the working space to the array of pixels                    |
//+------------------------------------------------------------------+
void CDashboard::SaveWorkspace(void)
  {
//--- Calculate the required size of the array (width * height of the working space)
   uint size=this.m_workspace.Width()*this.m_workspace.Height();
//--- If the size of the array is not equal to the calculated one, change it
   if(this.m_array_wpx.Size()!=size)
     {
      ::ResetLastError();
      if(::ArrayResize(this.m_array_wpx,size)!=size)
        {
         ::PrintFormat("%s: ArrayResize failed. Error %lu",(string)__FUNCTION__,::GetLastError());
         return;
        }
     }
   uint n=0;
//--- In the loop along the height of the working space (pixel Y coordinate)
   for(int y=0;y<this.m_workspace.Height();y++)
      //--- in the loop by the working space width (pixel X coordinate)
      for(int x=0;x<this.m_workspace.Width();x++)
        {
         //--- calculate the pixel index in the receiving array
         n=this.m_workspace.Width()*y+x;
         if(n>this.m_array_wpx.Size()-1)
            break;
         //--- copy pixel to the receiving array from the working space X and Y
         this.m_array_wpx[n]=this.m_workspace.PixelGet(x,y);
        }
  }
在两个嵌套循环中遍历每个图像行的每个像素,并将它们复制到接收数组中。
从像素数组恢复工作空间的方法:
//+------------------------------------------------------------------+
//| Restore the working space from the array of pixels               |
//+------------------------------------------------------------------+
void CDashboard::RestoreWorkspace(void)
  {
//--- Exit if the array is empty
   if(this.m_array_wpx.Size()==0)
      return;
   uint n=0;
//--- In the loop along the height of the working space (pixel Y coordinate)
   for(int y=0;y<this.m_workspace.Height();y++)
      //--- in the loop by the working space width (pixel X coordinate)
      for(int x=0;x<this.m_workspace.Width();x++)
        {
         //--- calculate the pixel index in the array
         n=this.m_workspace.Width()*y+x;
         if(n>this.m_array_wpx.Size()-1)
            break;
         //--- copy the pixel from the array to the X and Y coordinates of the working space
         this.m_workspace.PixelSet(x,y,this.m_array_wpx[n]);
        }
  }
在两个嵌套循环中,我们计算数组中每个图像行的每个像素的索引,并将它们从数组复制到图像的X和Y坐标。
将面板背景保存到像素数组的方法:
//+------------------------------------------------------------------+
//| Save the panel background to the pixel array                     |
//+------------------------------------------------------------------+
void CDashboard::SaveBackground(void)
  {
//--- Calculate the required size of the array (panel width * height)
   uint size=this.m_canvas.Width()*this.m_canvas.Height();
//--- If the size of the array is not equal to the calculated one, change it
   if(this.m_array_ppx.Size()!=size)
     {
      ::ResetLastError();
      if(::ArrayResize(this.m_array_ppx,size)!=size)
        {
         ::PrintFormat("%s: ArrayResize failed. Error %lu",(string)__FUNCTION__,::GetLastError());
         return;
        }
     }
   uint n=0;
//--- In the loop by the panel height (pixel Y coordinate)
   for(int y=0;y<this.m_canvas.Height();y++)
      //--- in the loop by the panel width (pixel X coordinate)
      for(int x=0;x<this.m_canvas.Width();x++)
        {
         //--- calculate the pixel index in the receiving array
         n=this.m_canvas.Width()*y+x;
         if(n>this.m_array_ppx.Size()-1)
            break;
         //--- copy pixel to the receiving array from the panel X and Y
         this.m_array_ppx[n]=this.m_canvas.PixelGet(x,y);
        }
  }
从像素数组恢复面板背景的方法:
//+------------------------------------------------------------------+
//| Restore the panel background from the array of pixels            |
//+------------------------------------------------------------------+
void CDashboard::RestoreBackground(void)
  {
//--- Exit if the array is empty
   if(this.m_array_ppx.Size()==0)
      return;
   uint n=0;
//--- In the loop by the panel height (pixel Y coordinate)
   for(int y=0;y<this.m_canvas.Height();y++)
      //--- in the loop by the panel width (pixel X coordinate)
      for(int x=0;x<this.m_canvas.Width();x++)
        {
         //--- calculate the pixel index in the array
         n=this.m_canvas.Width()*y+x;
         if(n>this.m_array_ppx.Size()-1)
            break;
         //--- copy the pixel from the array to the X and Y coordinates of the panel
         this.m_canvas.PixelSet(x,y,this.m_array_ppx[n]);
        }
  }
要将对象带到前台,我们需要连续执行两个操作:隐藏对象并立即显示它。每个图形对象都有OBJPROP_TIMEFRAMES属性,负责其在每个时间框架上的可见性。要在所有时间框架上隐藏对象,我们需要将此属性设置为OBJ_NO_PERIODS。因此,为了显示对象,我们需要将OBJPROP_TIMEFRAMES属性设置为OBJ_ALL_PERIODS。
隐藏面板的方法:
//+------------------------------------------------------------------+
//| Hide the panel                                                   |
//+------------------------------------------------------------------+
void CDashboard::Hide(const bool redraw=false)
  {
   ::ObjectSetInteger(this.m_chart_id,this.m_workspace.ChartObjectName(),OBJPROP_TIMEFRAMES,OBJ_NO_PERIODS);
   ::ObjectSetInteger(this.m_chart_id,this.m_canvas.ChartObjectName(),OBJPROP_TIMEFRAMES,OBJ_NO_PERIODS);
   if(redraw)
      ::ChartRedraw(this.m_chart_id);
  }
对于面板和工作空间对象,OBJPROP_TIMEFRAMES属性设置为OBJ_NO_PERIODS,并重新绘制图表以立即反映更改(如果相应的标志设置为)。
显示面板的方法:
//+------------------------------------------------------------------+
//| Display the panel                                                |
//+------------------------------------------------------------------+
void CDashboard::Show(const bool redraw=false)
  {
   ::ObjectSetInteger(this.m_chart_id,this.m_canvas.ChartObjectName(),OBJPROP_TIMEFRAMES,OBJ_ALL_PERIODS);
   if(!this.m_minimized)
      ::ObjectSetInteger(this.m_chart_id,this.m_workspace.ChartObjectName(),OBJPROP_TIMEFRAMES,OBJ_ALL_PERIODS);
   if(redraw)
      ::ChartRedraw(this.m_chart_id);
  }
对于面板对象,OBJPROP_TIMEFRAMES属性立即设置为OBJ_ALL_PERIODS。对于工作空间对象,仅当面板处于展开状态时才设置该值。
选中重新绘制标志后,将重新绘制图表以立即显示更改。
将面板带到前台的方法:
//+------------------------------------------------------------------+
//| Bring the panel to the foreground                                |
//+------------------------------------------------------------------+
void CDashboard::BringToTop(void)
  {
   this.Hide(false);
   this.Show(true);
  }
首先,面板和工作空间被隐藏,而无需重新绘制图表,然后它们会立即显示并重新绘制图表。
在某些情况下,当像素数组无法存储在内存中时,需要将其保存到文件中,然后从文件中加载。该类包含用于将像素数组保存到文件并从文件加载它们的方法:
//+------------------------------------------------------------------+
//| Save the pixel array of the working space to a file              |
//+------------------------------------------------------------------+
bool CDashboard::FileSaveWorkspace(void)
  {
//--- Define the folder and file name
   string filename=this.m_program_name+"\\Dashboard"+(string)this.m_id+"\\workspace.bin";
//--- If the saved array is empty, inform of that and return 'false'
   if(this.m_array_wpx.Size()==0)
     {
      ::PrintFormat("%s: Error. The workspace pixel array is empty.",__FUNCTION__);
      return false;
     }
//--- If the array could not be saved to a file, report this and return 'false'
   if(!::FileSave(filename,this.m_array_wpx))
     {
      ::PrintFormat("%s: FileSave '%s' failed. Error %lu",__FUNCTION__,filename,::GetLastError());
      return false;
     }
//--- Successful, return 'true'
   return true;
  }
//+------------------------------------------------------------------+
//| Save the pixel array of the panel background to a file           |
//+------------------------------------------------------------------+
bool CDashboard::FileSaveBackground(void)
  {
//--- Define the folder and file name
   string filename=this.m_program_name+"\\Dashboard"+(string)this.m_id+"\\background.bin";
//--- If the saved array is empty, inform of that and return 'false'
   if(this.m_array_ppx.Size()==0)
     {
      ::PrintFormat("%s: Error. The background pixel array is empty.",__FUNCTION__);
      return false;
     }
//--- If the array could not be saved to a file, report this and return 'false'
   if(!::FileSave(filename,this.m_array_ppx))
     {
      ::PrintFormat("%s: FileSave '%s' failed. Error %lu",__FUNCTION__,filename,::GetLastError());
      return false;
     }
//--- Successful, return 'true'
   return true;
  }
//+------------------------------------------------------------------+
//| Upload the array of working space pixels from a file             |
//+------------------------------------------------------------------+
bool CDashboard::FileLoadWorkspace(void)
  {
//--- Define the folder and file name
   string filename=this.m_program_name+"\\Dashboard"+(string)this.m_id+"\\workspace.bin";
//--- If failed to upload data from the file into the array, report this and return 'false'
   if(::FileLoad(filename,this.m_array_wpx)==WRONG_VALUE)
     {
      ::PrintFormat("%s: FileLoad '%s' failed. Error %lu",__FUNCTION__,filename,::GetLastError());
      return false;
     }
//--- Successful, return 'true'
   return true;
  }
//+------------------------------------------------------------------+
//| Upload the array of panel background pixels from a file          |
//+------------------------------------------------------------------+
bool CDashboard::FileLoadBackground(void)
  {
//--- Define the folder and file name
   string filename=this.m_program_name+"\\Dashboard"+(string)this.m_id+"\\background.bin";
//--- If failed to upload data from the file into the array, report this and return 'false'
   if(::FileLoad(filename,this.m_array_ppx)==WRONG_VALUE)
     {
      ::PrintFormat("%s: FileLoad '%s' failed. Error %lu",__FUNCTION__,filename,::GetLastError());
      return false;
     }
//--- Successful, return 'true'
   return true;
  }
目前,处理这些方法还没有实现,因为在撰写本文时发现了对它们的需求。未来关于仪表板类的文章可能会使用这些方法。
带仪表板的指标
为了测试仪表板,让我们创建一个简单的指标,绘制一个通常的移动平均值。我们将显示当前的出价和询价,以及鼠标光标当前悬停的烛形数据。
在Indicators文件夹中,使用新的自定义指标创建一个新的TestDashboard文件夹:
接下来,设置参数:
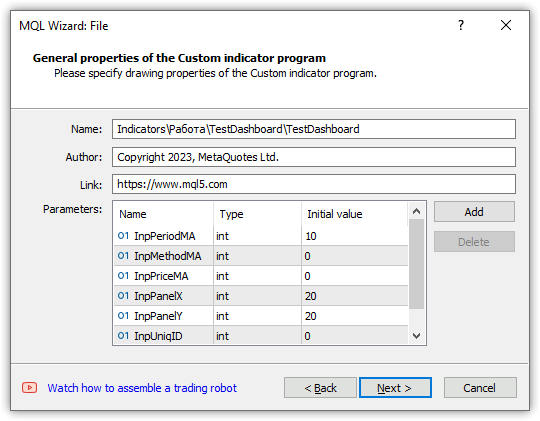
如果需要进一步改进,请选择第一个OnCalculate、OnChartEvent和OnTimer类型:
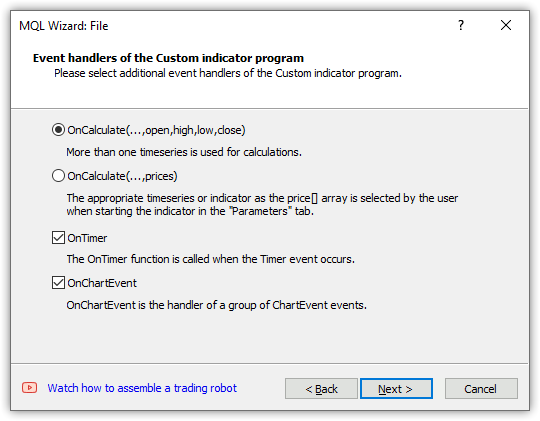
选择一个要绘制的缓冲区,然后单击“完成”:
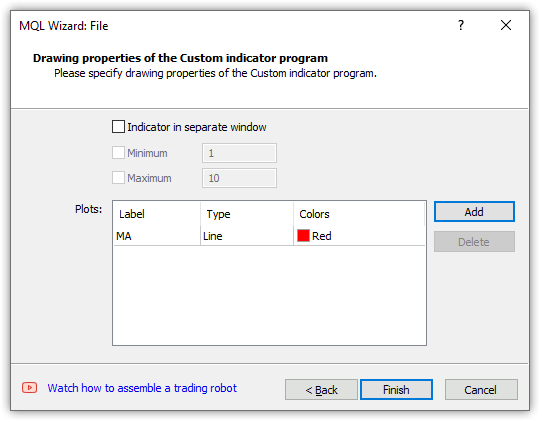
我们得到以下模板:
//+------------------------------------------------------------------+
//|                                                TestDashboard.mq5 |
//|                                  Copyright 2023, MetaQuotes Ltd. |
//|                                             https://www.mql5.com |
//+------------------------------------------------------------------+
#property copyright "Copyright 2023, MetaQuotes Ltd."
#property link      "https://www.mql5.com"
#property version   "1.00"
#property indicator_chart_window
#property indicator_buffers 1
#property indicator_plots   1
//--- plot MA
#property indicator_label1  "MA"
#property indicator_type1   DRAW_LINE
#property indicator_color1  clrRed
#property indicator_style1  STYLE_SOLID
#property indicator_width1  1
//--- input parameters
input int      InpPeriodMA=10;
input int      InpMethodMA=0;
input int      InpPriceMA=0;
input int      InpPanelX=20;
input int      InpPanelY=20;
input int      InpUniqID=0;
//--- indicator buffers
double         MABuffer[];
//+------------------------------------------------------------------+
//| Custom indicator initialization function                         |
//+------------------------------------------------------------------+
int OnInit()
  {
//--- indicator buffers mapping
   SetIndexBuffer(0,MABuffer,INDICATOR_DATA);

//---
   return(INIT_SUCCEEDED);
  }
//+------------------------------------------------------------------+
//| Custom indicator iteration function                              |
//+------------------------------------------------------------------+
int OnCalculate(const int rates_total,
                const int prev_calculated,
                const datetime &time[],
                const double &open[],
                const double &high[],
                const double &low[],
                const double &close[],
                const long &tick_volume[],
                const long &volume[],
                const int &spread[])
  {
//---

//--- return value of prev_calculated for the next call
   return(rates_total);
  }
//+------------------------------------------------------------------+
//| Timer function                                                   |
//+------------------------------------------------------------------+
void OnTimer()
  {
//---

  }
//+------------------------------------------------------------------+
//| ChartEvent function                                              |
//+------------------------------------------------------------------+
void OnChartEvent(const int id,
                  const long &lparam,
                  const double &dparam,
                  const string &sparam)
  {
//---

  }
//+------------------------------------------------------------------+
让我们将面板对象类文件保存到创建的指标文件夹中,以便包含的面板类文件与指标位于同一文件夹中。在完成面板类后,其最终版本可以放置在交易终端的文件沙盒的Include文件夹中,用于自定义程序。
让我们调整创建的指标模板。包括面板对象类,用更容易理解的初始值初始化输入参数,固定正在绘制的缓冲区的名称和声明全局变量:
//+------------------------------------------------------------------+
//|                                                TestDashboard.mq5 |
//|                                  Copyright 2023, MetaQuotes Ltd. |
//|                                             https://www.mql5.com |
//+------------------------------------------------------------------+
#property copyright "Copyright 2023, MetaQuotes Ltd."
#property link      "https://www.mql5.com"
#property version   "1.00"
#property indicator_chart_window
#property indicator_buffers 1
#property indicator_plots   1
//--- plot MA
#property indicator_label1  "MA"
#property indicator_type1   DRAW_LINE
#property indicator_color1  clrRed
#property indicator_style1  STYLE_SOLID
#property indicator_width1  1
//--- includes
#include "Dashboard.mqh"
//--- input variables
input int                  InpPeriodMA =  10;            /* MA Period   */ // Moving average calculation period
input ENUM_MA_METHOD       InpMethodMA =  MODE_SMA;      /* MA Method   */ // Moving average calculation method
input ENUM_APPLIED_PRICE   InpPriceMA  =  PRICE_CLOSE;   /* MA Price    */ // Moving average calculation price
input int                  InpPanelX   =  20;            /* Dashboard X */ // Panel X coordinate
input int                  InpPanelY   =  20;            /* Dashboard Y */ // Panel Y coordinate
input int                  InpUniqID   =  0;             /* Unique ID   */ // Unique ID for the panel object
//--- indicator buffers
double         BufferMA[];
//--- global variables
CDashboard    *dashboard=NULL;
int            handle_ma;        // Moving Average indicator handle
int            period_ma;        // Moving Average calculation period
int            mouse_bar_index;  // Index of the bar the data is taken from
string         plot_label;       // Name of the graphical indicator series displayed in DataWindow
//+------------------------------------------------------------------+
//| Custom indicator initialization function                         |
//+------------------------------------------------------------------+
int OnInit()
  {
在OnInit()处理函数中,创建移动平均标准指标的句柄,设置指标的参数和要绘制的缓冲区。由于指标是从历史开始到当前数据计算的,我们将按照时间序列设置指标缓冲区的索引。在同一处理函数中创建仪表板对象。创建对象后,立即显示该对象并绘制表格网格。接下来,将表格数据发送到日志中:
//+------------------------------------------------------------------+
//| Custom indicator initialization function                         |
//+------------------------------------------------------------------+
int OnInit()
  {
//--- indicator buffers mapping
   SetIndexBuffer(0,BufferMA,INDICATOR_DATA);

//--- Create indicator handle
   period_ma=(InpPeriodMA<1 ? 1 : InpPeriodMA);
   ResetLastError();
   handle_ma=iMA(Symbol(),PERIOD_CURRENT,period_ma,0,InpMethodMA,InpPriceMA);
   if(handle_ma==INVALID_HANDLE)
     {
      PrintFormat("%s Failed to create MA indicator handle. Error %lu",__FUNCTION__,GetLastError());
      return INIT_FAILED;
     }
//--- Set the indicator parameters
   IndicatorSetInteger(INDICATOR_DIGITS,Digits());
   IndicatorSetString(INDICATOR_SHORTNAME,"Test Dashboard");
//--- Set the parameters of the buffer being drawn
   plot_label="MA("+(string)period_ma+","+StringSubstr(EnumToString(Period()),7)+")";
   PlotIndexSetString(0,PLOT_LABEL,plot_label);
   ArraySetAsSeries(BufferMA,true);

//--- Create the panel object
   dashboard=new CDashboard(InpUniqID,InpPanelX,InpPanelY,200,250);
   if(dashboard==NULL)
     {
      Print("Error. Failed to create dashboard object");
      return INIT_FAILED;
     }
//--- Display the panel with the "Symbol, Timeframe description" header text
   dashboard.View(Symbol()+", "+StringSubstr(EnumToString(Period()),7));
//--- Draw the name plate on the panel background
   dashboard.DrawGridAutoFill(2,12,2);
   //dashboard.DrawGrid(2,1,12,2,19,97);
//--- Display tabular data in the journal
   dashboard.GridPrint(2);
//--- Initialize the variable with the index of the mouse cursor bar
   mouse_bar_index=0;
//--- Successful initialization
   return(INIT_SUCCEEDED);
  }
这里的所有逻辑都在代码中注释。该表是通过自动计算行和列的大小来创建的。一个简单表的创建在代码中被注释掉了。您可以注释掉自动大小表格,取消注释简单的一个并重新编译指示器。考虑到当前表格参数,差异将是微不足道的。
在OnDeinit()处理程序中,移除面板,释放指标句柄并删除图表注释:
//+------------------------------------------------------------------+
//| Custom indicator deinitialization function                       |
//+------------------------------------------------------------------+
void OnDeinit(const int reason)
  {
//--- If the panel object exists, delete it
   if(dashboard!=NULL)
      delete dashboard;
//--- Release the handle of the MA indicator
   ResetLastError();
   if(!IndicatorRelease(handle_ma))
      PrintFormat("%s: IndicatorRelease failed. Error %ld",__FUNCTION__,GetLastError());
//--- Delete all comments
   Comment("");
  }
在OnCalculate()处理函数中,所有预定义的时间序列数组都将具有与时间序列类似的索引,以便它们与绘图缓冲区的索引匹配。处理函数代码注释中描述了其他所有内容:
//+------------------------------------------------------------------+
//| Custom indicator iteration function                              |
//+------------------------------------------------------------------+
int OnCalculate(const int rates_total,
                const int prev_calculated,
                const datetime &time[],
                const double &open[],
                const double &high[],
                const double &low[],
                const double &close[],
                const long &tick_volume[],
                const long &volume[],
                const int &spread[])
  {
//--- Set indexing for the arrays as in a timeseries
   ArraySetAsSeries(time,true);
   ArraySetAsSeries(open,true);
   ArraySetAsSeries(high,true);
   ArraySetAsSeries(low,true);
   ArraySetAsSeries(close,true);
   ArraySetAsSeries(tick_volume,true);
   ArraySetAsSeries(volume,true);
   ArraySetAsSeries(spread,true);

//--- Check for the minimum number of bars for calculation
   if(rates_total<period_ma) return 0;

//--- Check and calculate the number of calculated bars
   int limit=rates_total-prev_calculated;
//--- If 'limit' is 0, then only the current bar is calculated
//--- If 'limit' is 1 (opening a new bar), then two bars are calculated - the current newly opened one and the previous one
//--- If 'limit' is more than 1, then this is either the first launch of the indicator, or some changes in history - the indicator is completely recalculated
   if(limit>1)
     {
      limit=rates_total-period_ma-1;
      ArrayInitialize(BufferMA,EMPTY_VALUE);
     }

//--- Calculate the amount of data copied from the indicator handle to the drawing buffer
   int count=(limit>1 ? rates_total : 1),copied=0;
//--- Prepare data (receive data to the moving average buffer by handle)
   copied=CopyBuffer(handle_ma,0,0,count,BufferMA);
   if(copied!=count) return 0;

//--- Loop of indicator calculation based on the moving average data
   for(int i=limit; i>=0 && !IsStopped(); i--)
     {
      // Here we calculate a certain indicator based on the standard Moving Average data
     }

//--- Receive price and timeseries data and display it on the panel
//--- At the first launch, we display the data of the current bar on the panel
   static bool first=true;
   if(first)
     {
      DrawData(0,TimeCurrent());
      first=false;
     }

//--- Declare the price structure and get the current prices
   MqlTick  tick={0};
   if(!SymbolInfoTick(Symbol(),tick))
      return 0;

//--- If the cursor is on the current bar, display the data of the current bar on the panel
   if(mouse_bar_index==0)
      DrawData(0,time[0]);
//--- Otherwise, display only the Bid and Ask prices on the panel (we update the prices on the panel at each tick)
   else
     {
      dashboard.DrawText("Bid",dashboard.CellX(0,0)+2,dashboard.CellY(0,0)+2); dashboard.DrawText(DoubleToString(tick.bid,Digits()),dashboard.CellX(0,1)+2,dashboard.CellY(0,1)+2,90);
      dashboard.DrawText("Ask",dashboard.CellX(1,0)+2,dashboard.CellY(1,0)+2); dashboard.DrawText(DoubleToString(tick.ask,Digits()),dashboard.CellX(1,1)+2,dashboard.CellY(1,1)+2,90);
     }

//--- return value of prev_calculated for the next call
   return(rates_total);
  }
在OnChartEvent()处理程序中,指标首先调用OnChartEvent面板处理程序,然后处理必要的事件:
//+------------------------------------------------------------------+
//| ChartEvent function                                              |
//+------------------------------------------------------------------+
void OnChartEvent(const int id,
                  const long &lparam,
                  const double &dparam,
                  const string &sparam)
  {
//--- Call the panel event handler
   dashboard.OnChartEvent(id,lparam,dparam,sparam);

//--- If the cursor moves or a click is made on the chart
   if(id==CHARTEVENT_MOUSE_MOVE || id==CHARTEVENT_CLICK)
     {
      //--- Declare the variables to record time and price coordinates in them
      datetime time=0;
      double price=0;
      int wnd=0;
      //--- If the cursor coordinates are converted to date and time
      if(ChartXYToTimePrice(ChartID(),(int)lparam,(int)dparam,wnd,time,price))
        {
         //--- write the bar index where the cursor is located to a global variable
         mouse_bar_index=iBarShift(Symbol(),PERIOD_CURRENT,time);
         //--- Display the bar data under the cursor on the panel
         DrawData(mouse_bar_index,time);
        }
     }

//--- If we received a custom event, display the appropriate message in the journal
   if(id>CHARTEVENT_CUSTOM)
     {
      //--- Here we can implement handling a click on the close button on the panel
      PrintFormat("%s: Event id=%ld, object id (lparam): %lu, event message (sparam): %s",__FUNCTION__,id,lparam,sparam);
     }
  }
在这里,当点击关闭按钮时从面板接收到事件时,如果有必要对此类事件做出反应,我们需要注册其处理过程。有关此事件中程序行为的决定权在于程序开发人员。
按索引显示当前价格和柱形数据的函数:
//+------------------------------------------------------------------+
//| Display data from the specified timeseries index to the panel    |
//+------------------------------------------------------------------+
void DrawData(const int index,const datetime time)
  {
//--- Declare the variables to receive data in them
   MqlTick  tick={0};
   MqlRates rates[1];
//--- Exit if unable to get the current prices
   if(!SymbolInfoTick(Symbol(),tick))
      return;
//--- Exit if unable to get the bar data by the specified index
   if(CopyRates(Symbol(),PERIOD_CURRENT,index,1,rates)!=1)
      return;
//--- Display the current prices and data of the specified bar on the panel
   dashboard.DrawText("Bid",        dashboard.CellX(0,0)+2,   dashboard.CellY(0,0)+2);  dashboard.DrawText(DoubleToString(tick.bid,Digits()),       dashboard.CellX(0,1)+2,   dashboard.CellY(0,1)+2,90);
   dashboard.DrawText("Ask",        dashboard.CellX(1,0)+2,   dashboard.CellY(1,0)+2);  dashboard.DrawText(DoubleToString(tick.ask,Digits()),       dashboard.CellX(1,1)+2,   dashboard.CellY(1,1)+2,90);
   dashboard.DrawText("Date",       dashboard.CellX(2,0)+2,   dashboard.CellY(2,0)+2);  dashboard.DrawText(TimeToString(rates[0].time,TIME_DATE),   dashboard.CellX(2,1)+2,   dashboard.CellY(2,1)+2,90);
   dashboard.DrawText("Time",       dashboard.CellX(3,0)+2,   dashboard.CellY(3,0)+2);  dashboard.DrawText(TimeToString(rates[0].time,TIME_MINUTES),dashboard.CellX(3,1)+2,   dashboard.CellY(3,1)+2,90);

   dashboard.DrawText("Open",       dashboard.CellX(4,0)+2,   dashboard.CellY(4,0)+2);  dashboard.DrawText(DoubleToString(rates[0].open,Digits()),  dashboard.CellX(4,1)+2,   dashboard.CellY(4,1)+2,90);
   dashboard.DrawText("High",       dashboard.CellX(5,0)+2,   dashboard.CellY(5,0)+2);  dashboard.DrawText(DoubleToString(rates[0].high,Digits()),  dashboard.CellX(5,1)+2,   dashboard.CellY(5,1)+2,90);
   dashboard.DrawText("Low",        dashboard.CellX(6,0)+2,   dashboard.CellY(6,0)+2);  dashboard.DrawText(DoubleToString(rates[0].low,Digits()),   dashboard.CellX(6,1)+2,   dashboard.CellY(6,1)+2,90);
   dashboard.DrawText("Close",      dashboard.CellX(7,0)+2,   dashboard.CellY(7,0)+2);  dashboard.DrawText(DoubleToString(rates[0].close,Digits()), dashboard.CellX(7,1)+2,   dashboard.CellY(7,1)+2,90);

   dashboard.DrawText("Volume",     dashboard.CellX(8,0)+2,   dashboard.CellY(8,0)+2);  dashboard.DrawText((string)rates[0].real_volume,            dashboard.CellX(8,1)+2,   dashboard.CellY(8,1)+2,90);
   dashboard.DrawText("Tick Volume",dashboard.CellX(9,0)+2,   dashboard.CellY(9,0)+2);  dashboard.DrawText((string)rates[0].tick_volume,            dashboard.CellX(9,1)+2,   dashboard.CellY(9,1)+2,90);
   dashboard.DrawText("Spread",     dashboard.CellX(10,0)+2,  dashboard.CellY(10,0)+2); dashboard.DrawText((string)rates[0].spread,                 dashboard.CellX(10,1)+2,  dashboard.CellY(10,1)+2,90);
   dashboard.DrawText(plot_label,   dashboard.CellX(11,0)+2,  dashboard.CellY(11,0)+2); dashboard.DrawText(DoubleToString(BufferMA[index],Digits()),dashboard.CellX(11,1)+2,  dashboard.CellY(11,1)+2,90);
//--- Redraw the chart to immediately display all changes on the panel
   ChartRedraw(ChartID());
  }
如果我们注意面板类的DrawText方法,
void CDashboard::DrawText(const string text,const int x,const int y,const int width=WRONG_VALUE,const int height=WRONG_VALUE)
我们可以看到,X和Y坐标在文本之后被传递给方法。这是我们从表格数据中得到的,通过表格单元格的行号和列号来指示其位置。
例如,“出价”和“要价”显示在面板上“出价”0.0(“出价”文本)和0.1(出价)的表格单元格的“地址”处:
dashboard.DrawText("Bid", dashboard.CellX(0,0)+2, dashboard.CellY(0,0)+2); dashboard.DrawText(DoubleToString(tick.bid,Digits()), dashboard.CellX(0,1)+2, dashboard.CellY(0,1)+2,90);
此处取单元格值
对于“询价”文本:
- CellX(0,0)--零行零列中的单元格--X坐标值,
- CellY(0,0)--零行零列中的单元格--Y坐标值。
对于询价价格:
- CellX(0,1)-零行第一列中的单元格-X坐标值,
- CellY(0,1)--零行第一列中的单元格--Y坐标值。
第二个单元格中显示的文本宽度的值为90表示当前文本的宽度可能小于前一个文本的宽度。因此,之前的文本不会被完全擦除,并且这两个文本将相互重叠。因此,我们在这里明确指出显示文本的宽度,这保证会擦除之前绘制的文本,但不会擦除相邻的数据,因为写入文本的表字段比90像素宽。
因此,对于每个表格单元格,我们可以在面板中获取其坐标,并在其中显示文本。由于坐标是为表格网格线的交点指示的,因此在X和Y方向的坐标上添加两个像素,以对齐表格单元格内的文本。
编译指标并在图表上启动后,面板上创建和绘制的表中的数据将显示在日志中:
Table: Rows: 12, Columns: 2
  Row   0    Column   0      Cell X:  2      Cell Y:  2
  Row   0    Column   1      Cell X:  100    Cell Y:  2
  Row   1    Column   0      Cell X:  2      Cell Y:  21
  Row   1    Column   1      Cell X:  100    Cell Y:  21
  Row   2    Column   0      Cell X:  2      Cell Y:  40
  Row   2    Column   1      Cell X:  100    Cell Y:  40
  Row   3    Column   0      Cell X:  2      Cell Y:  59
  Row   3    Column   1      Cell X:  100    Cell Y:  59
  Row   4    Column   0      Cell X:  2      Cell Y:  78
  Row   4    Column   1      Cell X:  100    Cell Y:  78
  Row   5    Column   0      Cell X:  2      Cell Y:  97
  Row   5    Column   1      Cell X:  100    Cell Y:  97
  Row   6    Column   0      Cell X:  2      Cell Y:  116
  Row   6    Column   1      Cell X:  100    Cell Y:  116
  Row   7    Column   0      Cell X:  2      Cell Y:  135
  Row   7    Column   1      Cell X:  100    Cell Y:  135
  Row   8    Column   0      Cell X:  2      Cell Y:  154
  Row   8    Column   1      Cell X:  100    Cell Y:  154
  Row   9    Column   0      Cell X:  2      Cell Y:  173
  Row   9    Column   1      Cell X:  100    Cell Y:  173
  Row   10   Column   0      Cell X:  2      Cell Y:  192
  Row   10   Column   1      Cell X:  100    Cell Y:  192
  Row   11   Column   0      Cell X:  2      Cell Y:  211
  Row   11   Column   1      Cell X:  100    Cell Y:  211
如果我们在同一图表上启动两个具有面板的指标,并为面板的唯一ID指定不同的值,则它们将独立工作:
在这里我们可以看到,尽管面板是单独工作的,但每个指示器都有自己的面板。然而,也有一个冲突:当面板移动时,图表也会尝试移动。之所以会发生这种情况,是因为我们移动的一个面板禁止移动图表,而第二个面板在看到光标在其外部时将其打开。
为了消除这种行为,我们可以做的最简单的事情是在全局终端变量中安排一个信号量,其中将写入活动面板的ID。其他元件在那里看到ID以外的东西时,不会干扰图表的管理。
如果我们在测试器可视化模式下运行指标并尝试移动面板,那么它将很难在屏幕上移动。同时,数据可以从测试图表的条形图中获得——当你点击柱形图时,它的数据就会显示在面板上。此外,鼠标右键(按住鼠标右键并沿图表移动光标)有助于指示光标当前所在的面板并显示数据,或者通过标题区域抓住面板并将其移动到所需位置。不幸的是,由于处理事件的实现不完整,我们不得不在测试器可视化模式中使用这些技巧。
结论
今天,我们创建了一个小型面板,可能有助于使用指标制定自定义策略。在接下来的文章中,我们将研究在所有标准指标的EA中包括指标及其数据的处理。
本文由MetaQuotes Ltd译自俄文
原文地址: https://www.mql5.com/ru/articles/13179
注意: MetaQuotes Ltd.将保留所有关于这些材料的权利。全部或部分复制或者转载这些材料将被禁止。
本文由网站的一位用户撰写,反映了他们的个人观点。MetaQuotes Ltd 不对所提供信息的准确性负责,也不对因使用所述解决方案、策略或建议而产生的任何后果负责。

Artem,我有一个问题。在 void CDashboard::Move(int x, int y) 方法中有这样一个东西:
我尤其对这个 模块感兴趣。也就是说,如果面板高度小于图表窗口高度,并且其 Y 点(左上角)低于窗口高度与面板高度之差(修正 2 个像素),那么面板的上端点将被赋予 该差值。为什么会这样,重点是什么?
简而言之,这是因为CDashboard::Move(int x, int y) 方法导致了粘连。当您尝试在更改图表尺寸后移动面板时,它会不断纠正坐标,不允许您自由移动面板窗口...
Move(int x, int y)
有一个错误。您需要打印(或在调试器中查看,但通常不起作用)坐标和大小值。
下面是注释中的逻辑:
当改变图表尺寸后尝试移动面板时,它会不断修正坐标,而不允许您自由移动面板窗口...
在 Move() 方法中,this.m_higher_wnd 变量的值很可能与此无关。这些值是在事件处理程序中设置的:
很有可能在图表窗口展开时,超大标记没有在此处正确设置。
如果将这几行
在 Move() 方法的开头强制设置每次鼠标移动时的正确值,那么错误是否会消失?如果是这样,那就说明问题出在这些变量的值上,您需要在事件处理程序中查找为什么它们在窗口展开时没有得到它们的值。如果一切正常,那么你就需要打印 Move() 方法来查找错误。
错误消失了。我对 CDashboard::OnChartEvent() 方法做了这些 更改:
为了避免不断加载CDashboard:: Move() 方法,我在直接更改图表窗口宽度和高度的块中添加了超大标志检查。
错误消失了。我对 CDashboard::OnChartEvent() 方法做了这些 更改:
为了避免不断加载CDashboard:: Move() 方法,我在直接更改图表窗口宽度和高度的块中添加了超大标志检查。