TheStrat Patterns
- Indikatoren
-
Robert Gerald Wood
 Professioneller Softwareentwickler mit über 25 Jahren Erfahrung, der jetzt Tools für mich selbst erstellt und sie der breiteren Community zur Verfügung stellt.
 - Version: 1.40
- Aktualisiert: 28 Juli 2021
- Aktivierungen: 10
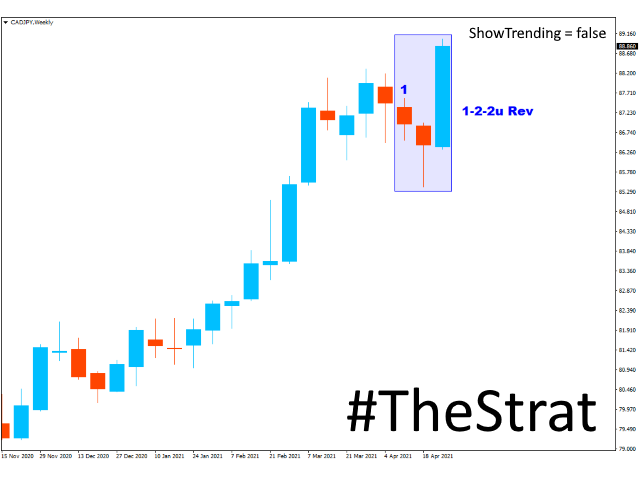
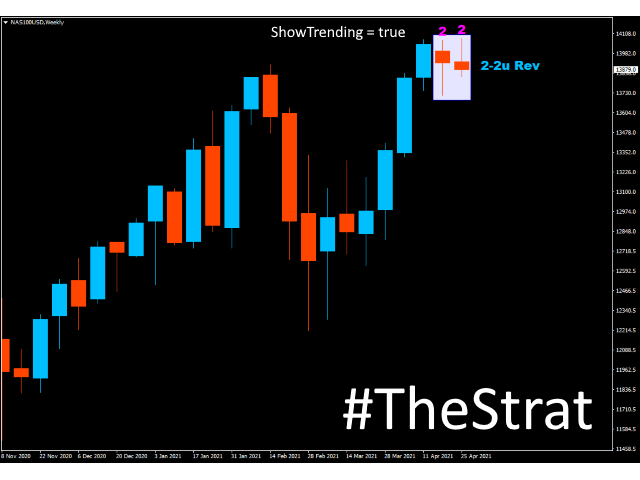
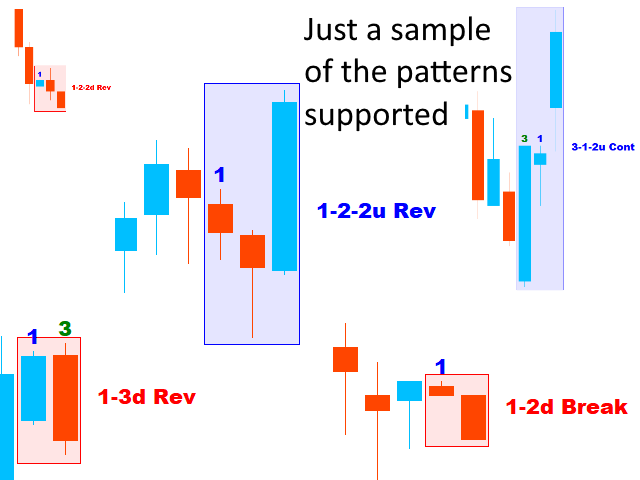
Während sich der Preis entwickelt, bietet TheStrat 18 verschiedene Preisaktionsmuster, die Ihnen helfen können, gute Einstiegsmöglichkeiten in den Markt zu finden. Jedes Muster besteht aus zwei oder drei Kerzen, und dieser Indikator zeichnet eine Bounding Box um die Kerzen und benennt das Muster.
Der Indikator zeigt auch an, wenn sich ein potenzielles Setup bildet, das von Strategen als Actionable Signal bezeichnet wird.
Kerzen
Muster
Dieser Indikator unterstützt und zeigt die folgenden Muster an. Eine visuelle Beschreibung finden Sie im Kommentarbereich:
AKTIVIERBAR
- 1-2-1 - Potenzielle Umkehrung in ein 1-2-2
- 2-1-1 - Potenzielle Umkehr oder Fortsetzung in ein 2-1-2
- 3-1-1 - Potenzielle Umkehrung in ein 3-1-2
- 3-2-1 - Potenzielle Umkehrung in ein 3-2-2
IN-FORCE
- 2-1-2u Fortsetzung
- 2-1-2d Fortsetzung
- 2-1-2u Umkehrung
- 2-1-2d Umkehrung
- 3-1-2u Umkehrung
- 3-1-2d Umkehrung
- 3-2-2u Umkehrung
- 3-2-2d Umkehrung
- 1-2-2d Umkehrung
- 1-2-2d Umkehrung
- 1-3u Umkehrung
- 1-3d Umkehrung
- 2-2u Umkehrung
- 2-2d Umkehrung
- 2-2u Fortsetzung
- 2-2d Fortsetzung
- 1-2u Ausbruch
- 1-2d Ausbruch
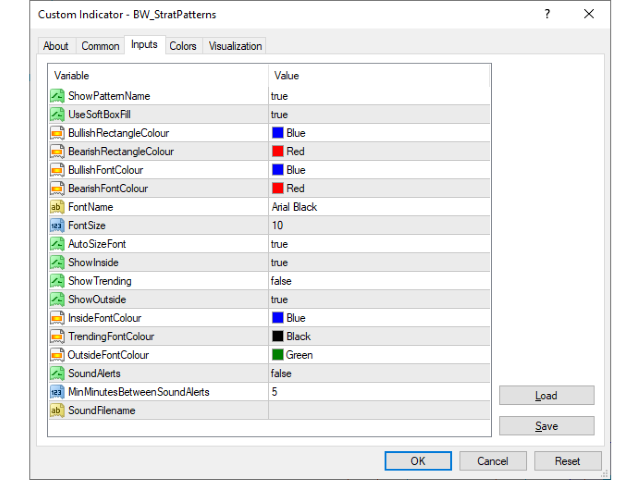
EINSTELLUNGEN
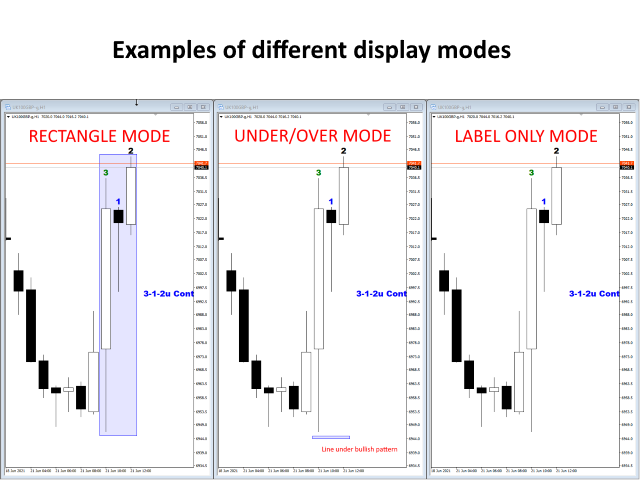
Es sind Einstellungen verfügbar, mit denen Sie die Anzeige an Ihre eigenen Vorlieben anpassen können.
Wir haben hier ein Dokument veröffentlicht, das die Konfigurationseinstellungen beschreibt: https: //www.mql5.com/en/blogs/post/746389
Bitte nehmen Sie sich die Zeit, die Demo herunterzuladen und sie auszuprobieren.