Clever TDI Pro MT5
- Indicators
-
Carlos Forero
 I am a professional developer and trader with over a decade of experience in capital markets and the creation of algorithmic portfolios. I specialize in advanced automated systems and technical analysis tools for MetaTrader.
⚙️ Development Philosophy - Version: 1.37
- Updated: 29 December 2023
- Activations: 5
Description:
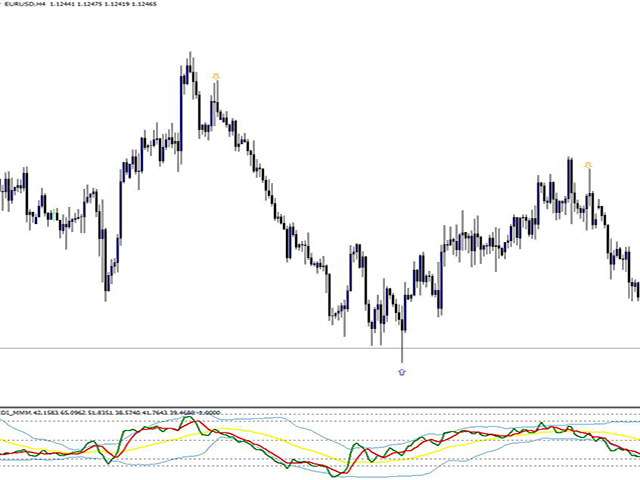
The indicator shows the TDI indicator in a separate window, and with the RSI component, the indicator finds possible divergences with M or W patterns.
KEY LINKS: How to Install – Frequent Questions - All Products
Functions:
- Finds Market Makers patterns.
- Finds extremes or exhaustion into the market.
- Looks for a trend continuation.
Content:
- TDI Indicator
- Divergence and M or W Signals
About Author:
Carlos Forero, Member of Clever Trading Club, private organization with the purpose of design clever solutions to generate constant profits with adapted risk.
User didn't leave any comment to the rating