CCI Alerts with Arrows

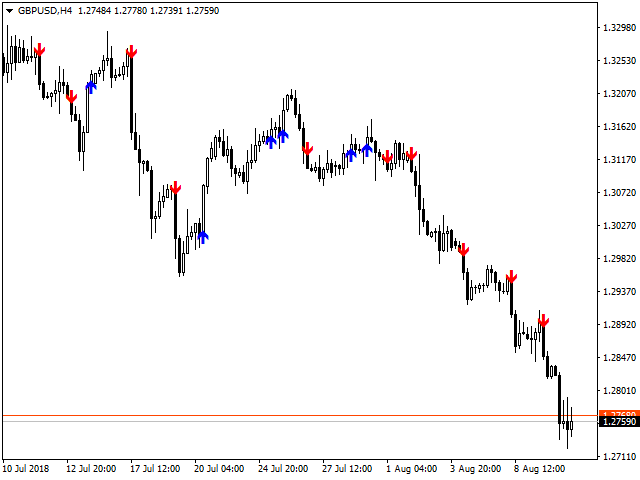
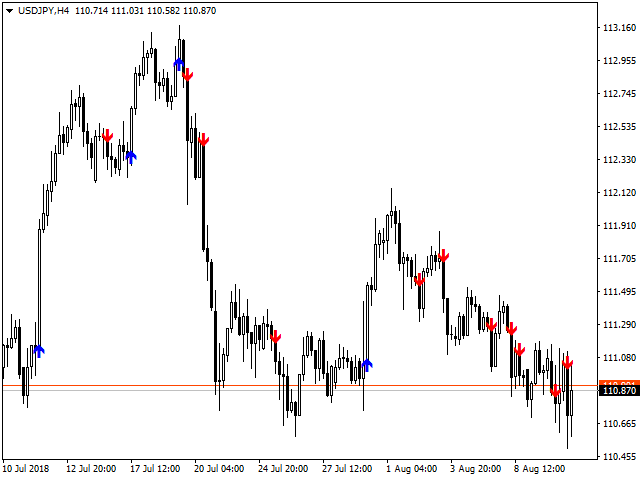
This is а modified oscillator CCI (Commodity Channel Index) with all sorts of signals, alerts and arrows. The indicator is designed so that any signal of crossing any specified level does not escape you. This is a supplemented version of the CCI Alerts Indicator, which does not draw the CCI indicator window, but only draws the result of its work as arrows on the symbol graph.

This version of CCI Alerts with Arrows is for MetaTrader 4. If you need signals from another popular RSI indicator, then RSI Alerts with Arrows may be useful.

Events that have been implemented to date

  • crossing top-down – over the upper signal level (default 100) – the sell signal
  • crossing bottom-up – over the upper signal level (default 100) – the buy signal
  • crossing top-down – over the lower signal level (default 100) – the sell signal
  • crossing bottom-up – over the lower signal level (default 100) – the buy signal
  • crossing top-down – over the zero signal level (0) – the sell signal
  • crossing bottom-up – over the zero signal level (0) – the buy signal

If there is a need to change the value of the signal levels, use the variables Max signal level  and Min signal level  in the settings.

What kinds of notifications are customizable

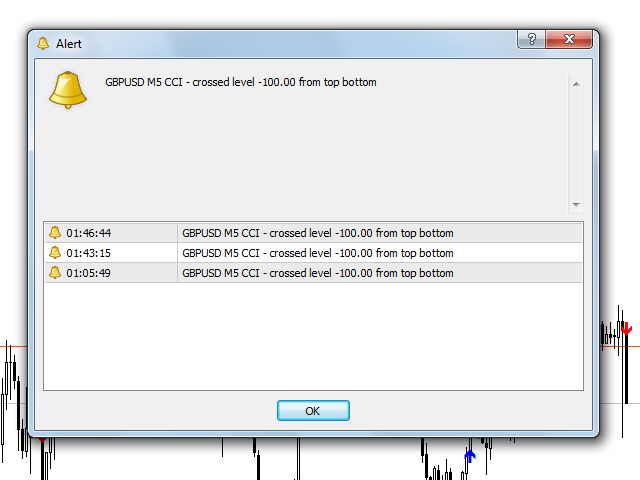
  • The  sound signal and the pop-up text message - Alert.
  • Sending notifications to the mobile terminal (for smartphones and tablets) - Push.
  • Sending a message to your email.
  • The sound signal without the pop-up text message, but with the ability to choose the alert sound file.
  • Displaying arrows.

Receiving messages on your mobile terminal is possible if you set up MetaQuotes ID in it.

Parameters

  • CCI Period – CCI indicator period 
  • Max level – upper signal level
  • Min level - lower signal level
  • AppliedPrice – the type of price at which the CCI indicator is built
  • Candle which look for the signal - the number of the candle from which the signal is taken (0 - current candle, 1 – previous candle).
  • Sound with text alerts – activating the sound alert and the pop-up text message
  • Send Notification - activating sending push-notifications to the mobile terminal
  • Send E-Mail - activating sending notifications to your email 
  • Sound alerts - sound alert
  • Sound file - sound alert file
  • Show arrows – displaying arrows
  • Hide the failed arrows on the next candle - hiding the false arrows at the next candle. It is working if Candle which look for the signal=0. If the latter = 1 then the arrows can never be false because the candle has already formed.
  • Crossed from the bottom up Max level (default 100) - activating the signal of crossing the line of Max signal level bottom-up
  • Crossed from top to bottom Max level (default 100) -  activating the signal of crossing the line of Max signal level top-down
  • Crossed from the bottom up Min level (default -100) - activating the signal of crossing the line of Min signal level bottom-up
  • Crossed from top to bottom Min level (default -100) - activating the signal of crossing the line of Min signal level top-down
  • Crossed from the bottom up level 0 - activating the signal of crossing the line of the zero level bottom-up
  • Crossed from top to bottom level 0 - activating the signal of crossing the line of the zero level top-down
  • Bottom-up message template – the message template for crossing upwards
  • Message template from top to bottom – the message template for crossing downwards
There is the ability to change the message text. Bottom-up message template and Message template from top to bottom variables use tags:
  • %level% - will be changed to the level that will be crossed by the indicator.
  • %tf% - will be changed to the name of the timeframe that will be the source of the signal.
  • %symbol% - will be changed to the name of the symbol that will be the source of the signal.
If you need any additional functions, have no hesitation in writing me.

Recommended products
Trend Oscillator - is an advanced custom  Crypto_Forex indicator, efficient trading tool! Advanced new calculation method is used - 20 options for parameter "Price for calculation". Smoothest oscillator ever developed. Green color for upward trends,  Red color for downward trends. Oversold values: below 5, O verbought values: over 95. There are plenty of opportunities to upgrade even standard strategies with this indicator. With PC and Mobile alerts. Click here to see high quality Trading Robot
Auto Fibo Pro m
DMITRII GRIDASOV
"Auto FIBO Pro"   Crypto_Forex  indicator  - is great auxiliary tool in trading! Indicator automatically calculate and place on chart Fibo levels and local trend lines (red color). Fibonacci levels indicate key areas where price can reverse. Most important levels are 23.6%, 38.2%, 50% and 61.8%. You can use it   for reversal scalping  or for zone grid trading. There are plenty of opportunities to  improve your current system using Auto FIBO Pro indicator as well. It has Info Spread Swap Displa
Alpha Trend sign has been a very popular trading tool in our company for a long time. It can verify our trading system and clearly indicate trading signals, and the signals will not drift. Main functions: Based on the market display of active areas, indicators can be used to intuitively determine whether the current market trend belongs to a trend market or a volatile market. And enter the market according to the indicator arrows, with green arrows indicating buy and red arrows indicating se
The indicator displays the data of the Stochastic oscillator from a higher timeframe on the chart. The main and signal lines are displayed in a separate window. The stepped response is not smoothed. The indicator is useful for practicing "manual" forex trading strategies, which use the data from several screens with different timeframes of a single symbol. The indicator uses the settings that are identical to the standard ones, and a drop-down list for selecting the timeframe. Indicator Paramet
VR Cub
Vladimir Pastushak
VR Cub is an indicator for getting high-quality entry points. The indicator was developed to facilitate mathematical calculations and simplify the search for entry points into a position. The trading strategy for which the indicator was written has been proving its effectiveness for many years. The simplicity of the trading strategy is its great advantage, which allows even novice traders to successfully trade with it. VR Cub calculates position opening points and Take Profit and Stop Loss targe
Crypto_Forex   Indicator HTF Ichimoku for MT4. Ichimoku indicator is   one of the most powerful trend indicators . H TF means -   H igher TimeFrame. This indicator is excellent for Trend Traders as well as combination with Price Action entries. HTF Ichimoku  Indicator allows you to attach Ichimoku from higher timeframe to your current chart. Up trend   - red line above blue one (and both lines are above cloud) /  Down trend   - red line below blue one  (and both lines are below cloud). Open BUY
Trend Monitor
Pavel Zamoshnikov
4 (4)
The indicator generates early signals basing on ADX reading data combined with elements of price patterns. Works on all symbols and timeframes. The indicator does not redraw its signals. You see the same things on history and in real time. For better visual perception signals are displayed as arrows (in order not to overload the chart). Features Easy to use. Filter configuration only requires selection of sensitivity in the " Sensitivity of the indicator " input. Signals can be filtered using
Rainbow Price Visualizer v1.21 See where the market really breathes. Turns your MT4 chart into an ultra-precise heatmap that highlights price zones favored by big players. Why it matters 300 price levels at 0.2‑pip resolution — microscopic detail. 8 visual themes (Rainbow, Fire, Ocean…) for instant readibility. Smart opacity: low noise fades, real zones pop. Lightweight rendering with automatic cleanup. Fully customizable: saturation, opacity, resolution, history depth. Bands project into the f
Colored trend indicator advanced is a trend indicator that is based on Fast Moving Average and Slow Moving Average and also uses RSI and Momentum to give a trend strength in percent. It is aimed to find more healthy trends with this indicator. This indicator can be used alone as a trend indicator. Colors (Default) Green = Uptrend (Default) Red = Downtrend No color = No trend, no good trend Indicator Parameters WarnPosTrendchange: Warns you when the trend may change. FullColor: See screenshot.
[ZhiBiCCI] indicators are suitable for all cycle use, and are also suitable for all market varieties. [ZhiBiCCI] Green solid line is a reversal of bullish divergence. The green dotted line is a classic bullish divergence. [ZhiBiCCI] The solid line to the red is a reverse bearish divergence. The red dotted line is a classical bearish divergence. [ZhiBiCCI] can be set in the parameters (Alert, Send mail, Send notification), set to (true) to send instant signals to the alarm window, email, insta
PABT Pattern Indicator - it's classical system one of the signal patterns. Indicator logic - the Hi & Lo of the bar is fully within the range of the preceding bar, look to trade them as pullback in trend. In the way if indicator found PABT pattern it's drawing two lines and arrow what showing trend way.  - First line - it's entry point and drawing at: 1. On the high of signal bar or on middle of the signal bar (depending from indicator mode) for buy; 2. On the low of signal bar or on middle of t
Infinity Trend Pro
Yaroslav Varankin
1 (1)
This is a trend indicator without redrawing Developed instead of the binary options strategy (by the color of the Martingale candlestick) Also works well in forex trading When to open trades (binary options) A signal will appear in the place with a candle signaling the current candle It is recommended to open a deal for one candle of the current timeframe M1 and M5 When a blue dot appears, open a deal up When a red dot appears, open a trade down. How to open trades on Forex. When a signal is rec
The Range Directional Force Indicator is designed to help traders analyze market trends, reversals, and directional strength. It focuses on price movements within defined ranges, identifying key moments when the market is gaining momentum or preparing for a shift. By dividing the chart into dynamic price ranges, the indicator detects critical support and resistance levels. It calculates the directional force of price movements, highlighting potential entry and exit points based on market sentim
The CCI Divergence is a reasonably useful indicator in itself, but it is even more effective when used with divergence pattern trading. The CCI Divergence indicator signal is one of the most potent signals among the indicators that exist in the market. Here is new version for Divergence Indicator using CCI method, with more improvements. Divergences indicate a potential investment point because the directional moment does not confirm the price. A bullish divergence occurs when the underlying va
"Dynamic Flow Oscillator" - is an advanced custom Crypto_Forex indicator - efficient Trading tool for MT4!  - New generation of Oscillators - see pictures to check how to use it. - Dynamic Flow Oscillator has adaptive Oversold/Overbought zones. - Indicator uses   price and volume data   for identifying oversold and overbought zones. - Oscillator is an auxiliary tool to find exact entry points from OverSold/OverBought areas. - Oversold values: below Green line, Overbought values: over Red line
Trade with Gann on your side!! MASTER CIRCLE 360 CIRCLE CHART, originally created by Gann admitted that this is “The Mother of all charts”. It is one of the last studies that this great trader left for us. The numeric tab le is apparently quite simple like all the tables and is based on square numbers, the SQUARE OF 12 and is by evolution, one of the most important square numbers. Here we can find CYCLE, PRICE AND TIME thanks to angles and grades, to show past and future support and resistance.
EZZ Zig Zag MT4
Paulo Rocha
5 (1)
EZZ Elite Zig Zag is an indicator for the MetaTrader 4 terminal. This indicator traces the peak of the trend based on the market reversal, thus showing various opportunities in the financial market. EZZ Elite Zig Zag is a visual tool, intuitive, and easy to understand and use.  Test it Yourself by Downloading it for Free. Author Paulo Rocha all rights reserved
Daily Candle Predictor is an indicator that predicts the closing price of a candle. The indicator is primarily intended for use on D1 charts. This indicator is suitable for both traditional forex trading and binary options trading. The indicator can be used as a standalone trading system, or it can act as an addition to your existing trading system. This indicator analyzes the current candle, calculating certain strength factors inside the body of the candle itself, as well as the parameters of
The Th3Eng PipFinite indicator is based on a very excellent analysis of the right trend direction with perfect custom algorithms. It show the true direction and the best point to start trading. With StopLoss point and Three Take Profit points. Also it show the right pivot of the price and small points to order to replace the dynamic support and resistance channel, Which surrounds the price. And Finally it draws a very helpful Box on the left side on the chart includes (take profits and Stop loss
The indicator detects and displays 3 Drives harmonic pattern (see the screenshot). The pattern is plotted by the extreme values of the ZigZag indicator (included in the resources, no need to install). After detecting the pattern, the indicator notifies of that by a pop-up window, a mobile notification and an email. The indicator highlights the process of the pattern formation and not just the complete pattern. In the former case, it is displayed in the contour triangles. After the pattern is com
Laser Trend
Nicolas Zouein
The trend is your friend! This is what this indicator is all about. Follow this famous saying and be safe. Characteristics: Buy/Sell signals fixed on the close of a bar. Works on all symbols and all timeframes. Clear visual market trend laser line, Buy/Sell signal arrows, market strength meter, TP1 & TP2 boxes. Visual signals when to enter, when to exit the market. No repainting. Compatible with Flexible EA for trading automation. (Ask for a free set file optimized to perform 2010-2018) Parame
RSI Speed mp
DMITRII GRIDASOV
Crypto_Forex   Indicator "RSI SPEED" for MT4 - great predictive tool , No Repaint. The calculation of this indicator is  based on equations from physics . RSI SPEED is the  1st derivative of RSI  itself. RSI SPEED is   good for scalping entries   into the direction of main trend. Use it   in combination   with suitable   trend indicator , for example HTF MA (as on pictures). RSI SPEED indicator shows how fast RSI itself changes its direction   - it is very sensitive . It is recommended to use RS
The   RSI Divergence + FVG Signal   indicator combines   Relative Strength Index (RSI) Divergence   with   Fair Value Gap (FVG)   detection to generate high-probability buy and sell signals based on both momentum shifts and institutional imbalance zones. Core Features: RSI Divergence Detection : Identifies both regular and hidden bullish/bearish divergences between price and RSI. Divergences indicate potential trend reversals or continuation. FVG Zone Recognition : Detects Fair Value Gaps (imbal
Trendiness Index
Libertas LLC
5 (3)
"The trend is your friend" is one of the best known sayings in investing, because capturing large trendy price movements can be extremely profitable. However, trading with the trend is often easier said than done, because many indicators are based on price reversals not trends. These aren't very effective at identifying trendy periods, or predicting whether trends will continue. We developed the Trendiness Index to help address this problem by indicating the strength and direction of price trend
Wave Wolf MT4
Andrei Salanevich
The Wave Wold MT4 Forex indicator is designed to search for Wolf waves and display them in the current window of the trading terminal. An excellent indicator for traders who use Wolf waves in trading. Its application in trading strategies will significantly increase their efficiency and profitability. INFORMATION ABOUT THE INDICATOR Unlike other Wolf wave indicators, the Wave Wold MT4 forex indicator has a number of features that significantly increase its effectiveness: The first is the Ope
Noize Absorption Index MT4
Ekaterina Saltykova
5 (1)
Noize Absorption Index - is the manual trading system that measures the difference of pressure between bears forces and bulls forces. Green line - is a noize free index that showing curent situation. Zero value of index shows totally choppy/flat market.Values above zero level shows how powerfull bullish wave is and values below zero measures bearish forces.Up arrow appears on bearish market when it's ready to reverse, dn arrow appears on weak bullish market, as a result of reverse expectation. S
"Impulses and Corrections 4" is created to help traders navigate the market situation. The indicator shows multi-time frame upward and downward "Impulses" of price movements. These impulses are the basis for determining the "Base" , which is composed of zones of corrections of price movements, as well as "Potential" zones for possible scenarios of price movement. Up and down impulses are determined based on a modified formula of Bill Williams' "Fractals" indicator. The last impulse is always "U
RenkoMaStoch
Sergey Deev
1 (1)
The indicator displays renko bars on a chart, uses them to plot the fast and slow moving average and Stochastic, as well as it provides buy/sell signals: a buy signal is generated when the fast moving is above the slow one, and the signal line of Stochastic crosses the lower level from bottom up; a sell signal is generated when the fast moving is below the slow one, and the signal line of Stochastic crosses the upper level from top to bottom; Renko is a non-trivial price display method. Instead
Line Magnit
Aleksey Trenin
The LineMagnit Indicator for MT4 is a highly precise tool that builds support and resistance levels which magnetically attract prices. This feature allows traders to easily determine the most probable entry and exit points in the market, as well as identify the market's directional forces, as levels are based on capital inflows into the instrument. Equipped with an intuitively understandable graphical interface, the LineMagnit Indicator enables users to quickly locate and analyze support and res
Crypto_Forex   Indicator   Accumulation Bar   Pattern for MT4. Indicator  " Accumulation Bar "  is very powerful   breakout-focused indicator   for Price Action trading. Indicator detects  price accumulation in narrow area   during 1 bar and shows: Breakout direction, Pending order and SL locations. Bullish  Accumulation Bar - Blue arrow signal on chart (see pictures). Bearish  Accumulation Bar - Red arrow signal on chart (see pictures). No repaint, No delay, High R/R ratio (reward/risk). I ndic
Buyers of this product also purchase
Gann Made Easy
Oleg Rodin
4.83 (156)
Gann Made Easy is a professional and easy to use Forex trading system which is based on the best principles of trading using the theory of W.D. Gann. The indicator provides accurate BUY and SELL signals including Stop Loss and Take Profit levels. You can trade even on the go using PUSH notifications. PLEASE CONTACT ME AFTER PURCHASE TO GET TRADING  INSTRUCTIONS AND GREAT EXTRA INDICATORS   FOR FREE! Probably you already heard about the Gann trading methods before. Usually the Gann theory is a ve
The " Dynamic Scalper System " indicator is designed for the scalping method of trading within trend waves. Tested on major currency pairs and gold, compatibility with other trading instruments is possible. Provides signals for short-term opening of positions along the trend with additional price movement support. The principle of the indicator. Large arrows determine the trend direction. An algorithm for generating signals for scalping in the form of small arrows operates within trend waves.
M1 Sniper
Oleg Rodin
5 (20)
M1 SNIPER is an easy to use trading indicator system. It is an arrow indicator which is designed for M1 time frame. The indicator can be used as a standalone system for scalping on M1 time frame and it can be used as a part of your existing trading system. Though this trading system was designed specifically for trading on M1, it still can be used with other time frames too. Originally I designed this method for trading XAUUSD and BTCUSD. But I find this method helpful in trading other markets a
Scalper Inside PRO
Alexey Minkov
4.74 (69)
An exclusive indicator that utilizes an innovative algorithm to swiftly and accurately determine the market trend. The indicator automatically calculates opening, closing, and profit levels, providing detailed trading statistics. With these features, you can choose the most appropriate trading instrument for the current market conditions. Additionally, you can easily integrate your own arrow indicators into Scalper Inside Pro to quickly evaluate their statistics and profitability. Scalper Inside
Atomic Analyst
Issam Kassas
5 (4)
First of all Its worth emphasizing here that this Trading Indicator is   Non-Repainting , Non Redrawing and Non Lagging Indicator   Indicator, Which makes it ideal from both manual and robot trading.  User manual: settings, inputs and strategy . The Atomic Analyst  is a PA Price Action Indicator that uses Strength and Momentum of the price to find a better edge in the market. Equipped with Advanced filters which help remove noises and false signals, and Increase Trading Potential. Using Multiple
Trend Lines PRO
Roman Podpora
5 (1)
TREND LINES PRO    helps understand where the market is truly changing direction. The indicator shows real trend reversals and points where major players re-enter. You see   BOS lines   Trend changes and key levels on higher timeframes — without complex settings or unnecessary noise. Signals don't repaint and remain on the chart after the bar closes. VERSION MT 5     -     Reveals its maximum potential when paired with the   RFI LEVELS PRO  indicator What the indicator shows: Real shifts   tren
Linear Trend Predictor - A trend indicator that combines entry points and direction support lines. It works on the principle of breaking through the High/Low price channel. The indicator algorithm filters market noise, takes into account volatility and market dynamics. Indicator capabilities Using smoothing methods, it shows the market trend and entry points for opening BUY or SELL orders. Suitable for determining short-term and long-term market movements by analyzing charts on any timeframes.
GOLD Impulse with Alert
Bernhard Schweigert
4.67 (12)
This indicator is a super combination of our 2 products  Advanced Currency IMPULSE with ALERT  and  Currency Strength Exotics . It works for all time frames and shows graphically impulse of strength or weakness for the 8 main currencies plus one Symbol! This Indicator is specialized to show currency strength acceleration for any symbols like Gold, Exotic Pairs, Commodities, Indexes or Futures. Is first of its kind, any symbol can be added to the 9th line to show  true currency strength accelerat
First of all Its worth emphasizing here that this Trading Tool is Non-Repainting Non-Redrawing and Non-Lagging Indicator Which makes it ideal for professional trading . [Online course] ,   and   [manual] The Smart Price Action Concepts Indicator is a very powerful tool for both new and experienced traders . It packs more than 20 useful indicators into one combining advanced trading ideas like Inner Circle Trader Analysis and Smart Money Concepts Trading Strategies . This indicator focuses on Sm
NAM Order Blocks
NAM TECH GROUP, CORP.
3.67 (3)
MT4 Multi-timeframe Order Blocks detection indicator. Features - Fully customizable on chart control panel, provides complete interaction. - Hide and show control panel wherever you want. - Detect OBs on multiple timeframes. - Select OBs quantity to display. - Different OBs user interface. - Different filters on OBs. - OB proximity alert. - ADR High and Low lines. - Notification service (Screen alerts | Push notifications). Summary Order block is a market behavior that indicates order collection
Auto Optimized Parabolic RSI: Advanced 3D Momentum Engine Most retail indicators fail because they rely on static inputs that break the moment market volatility shifts. Auto Optimized Parabolic RSI solves the problem of "indicator decay" by continuously recalculating its own mathematical edge, bringing institutional-grade quantitative adaptation directly to your MT5 terminal. The Core Advantage: Custom In-Memory 3D Optimization   Standard auto-optimizers often freeze the MT5 platform because the
New Update of Smart Trend Trading System MT5 For  2026 Market: If You Buy this Indicator you will Get my Professional   Trade Manager + EA  for   FREE . First of all Its worth emphasizing here that this Trading System is   Non-Repainting   , Non Redrawing and Non Lagging Indicator   Which makes it ideal from both manual and robot trading .  [Online course] ,   [manual]   and   [download presets] . The Smart Trend Trading System MT5 is a comprehensive trading solution tailored for   new   and   e
RFI levels PRO
Roman Podpora
5 (1)
The indicator accurately shows the reversal points and price return zones where the   Major players . You see where new trends are forming and make decisions with maximum precision, maintaining control over every trade. VERSION MT5     -     Reveals its maximum potential when combined with the   TREND LINES PRO   indicator What the indicator shows: Reversal structures and reversal levels with activation at the beginning of a new trend. Display of   TAKE PROFIT   and   STOP LOSS   levels with mi
MTF Supply Demand Zones
Georgios Kalomoiropoulos
4.82 (22)
Next Generation Of Automated Supply And Demand Zones. New and Innovative Algorithm that Works At Any Chart. All Zones Are Being Created Dynamically According To Price Action Of The Market. AMAZING OFFER --> Activations from 5 to 20 for "MTF Supply Demand Zones" and "Automated Trendlines" If you get the MTF Supply Demand Zones you can join the " Trade Like Me " Video Series. It contains 14 Live Sessions where  i am placing trades on Forex, Stocks, Indices and Metals. You will be able to see ho
Currency Strength Exotics
Bernhard Schweigert
4.88 (33)
CURRENTLY 20% OFF ! Best Solution for any Newbie or Expert Trader! This Indicator is specialized to show currency strength for any symbols like Exotic Pairs Commodities, Indexes or Futures. Is first of its kind, any symbol can be added to the 9th line to show true currency strength of Gold, Silver, Oil, DAX, US30, MXN, TRY, CNH etc. This is a unique, high quality and affordable trading tool because we have incorporated a number of proprietary features and a new formula. Imagine how your trading
MetaForecast M4
Vahidreza Heidar Gholami
5 (2)
MetaForecast predicts and visualizes the future of any market based on the harmonics in price data. While the market is not always predictable, if there is a pattern in the price, MetaForecast can predict the future as accurately as possible. Compared to other similar products, Metaforecast can generate more accurate results by analyzing market trends. Input Parameters Past size Specifies the number of bars that MetaForecast uses to create a model for generating future predictions. The model is
Introducing the Delta Volume Profile Indicator - Unleash the Power of Institutional Precision!  Technical Indicator: Are you ready to trade like the pros? The Delta Volume Profile Indicator is no ordinary tool. It’s a high-precision, cutting-edge indicator that puts the power of institutional-grade trading in your hands. This unique indicator analyses delta volume distribution in real-time, revealing the market's hidden buy/sell imbalances that the biggest financial institutions rely on to antic
The Super Arrow Indicator provides non-repainting buy and sell signals with exceptional accuracy. Key Features No repainting – confirmed signals remain fixed Clear visual arrows: green for buy, red for sell Real-time alerts via pop-up, sound, and optional email Clean chart view with no unnecessary clutter Works on all markets: Forex, gold, oil, indices, crypto Adjustable Parameters TimeFrame Default: "current time frame" Function: Sets the time frame for indicator calculation Options: Can be set
Order Block Hunter
Noha Mohamed Fathy Younes Badr
5 (10)
Order block hunter indicator is the best indicator for  hunt the order blocks that area where there has been a large concentration of limit orders waiting to be executed Order blocks are identified on a chart by observing previous price action and looking for areas where the price experienced significant movement or sudden changes in direction .This indicator does that for you by using very complicated codes and helps you to take the best areas To buy and sell because it make marks at the best a
Dynamic Forex28 Navigator
Bernhard Schweigert
4.43 (7)
Specials Discount now. The Next Generation Forex Trading Tool. Dynamic Forex28 Navigator is the evolution of our long-time, popular indicators, combining the power of three into one: Advanced Currency Strength28 Indicator (695 reviews) + Advanced Currency IMPULSE with ALERT (520 reviews) + CS28 Combo Signals (recent Bonus) Details about the indicator  https://www.mql5.com/en/blogs/post/758844 What Does The Next-Generation Strength Indicator Offer? Everything you loved about the originals, now
Advanced Supply Demand
Bernhard Schweigert
4.91 (299)
Trading Special – 40% OFF Best Solution for any Newbie or Expert Trader! This indicator is a unique, high quality and affordable trading tool because we have incorporated a number of proprietary features and a new formula. With this update, you will be able to show double timeframe zones. You will not only be able to show a higher TF but to show both, the chart TF, PLUS the higher TF: SHOWING NESTED ZONES. All Supply Demand traders will love it. :) Important Information Revealed Maximize the pot
Adaptive Volatility Range [AVR] is a powerful tool for identifying key trend reversal points. AVR accurately reflects the Average True Range (ATR) of volatility, taking into account the Volume-Weighted Average Price (VWAP). The indicator adapts to any market volatility by calculating the average volatility over a specific period, ensuring a stable rate of profitable trades. You receive not just an indicator but a professional automated trading system , AVR-EA . Advantages: Automated Trading Sys
TPSpro RFI Levels
Roman Podpora
4.86 (28)
INSTRUCTIONS RUS   /   INSTRUCTIONS   ENG   -   VERSION  MT5 Main functions: Displays active zones of sellers and buyers! The indicator displays all the correct first impulse levels/zones for purchases and sales. When these levels/zones are activated, where the search for entry points begins, the levels change color and are filled with certain colors. Arrows also appear for a more intuitive perception of the situation. LOGIC AI - Display of zones (circles) for searching entry points when activa
Currency Strength Wizard is a very powerful indicator that provides you with all-in-one solution for successful trading. The indicator calculates the power of this or that forex pair using the data of all currencies on multiple time frames. This data is represented in a form of easy to use currency index and currency power lines which you can use to see the power of this or that currency. All you need is attach the indicator to the chart you want to trade and the indicator will show you real str
BTMM State Engine Pro is a MetaTrader 4 indicator for traders who use the Beat The Market Maker approach: Asian session context, kill zone timing, level progression, peak formation detection, and a multi-pair scanner from a single chart. It combines cycle state logic with a built-in scanner dashboard so you do not need the same tool on many charts at once. What it does Draws the Asian session range; session times can follow broker server offset or be set in inputs. Tracks level progression (L
TrendLine PRO MT4
Evgenii Aksenov
4.83 (167)
The Trend Line PRO indicator is an independent trading strategy. It shows the trend change, the entry point to the transaction, as well as automatically calculates three levels of Take Profit and Stop Loss protection. Trend Line PRO is perfect for all Meta Trader symbols: currencies, metals, cryptocurrencies, stocks and indices. The indicator is used in trading on real accounts, which confirms the reliability of the strategy. Robots using   Trend Line PRO   and real Signals can be found here:   
Volatility Trend System - a trading system that gives signals for entries. The volatility system gives linear and point signals in the direction of the trend, as well as signals to exit it, without redrawing and delays. The trend indicator monitors the direction of the medium-term trend, shows the direction and its change. The signal indicator is based on changes in volatility and shows market entries. The indicator is equipped with several types of alerts. Can be applied to various trading ins
Looking for a powerful yet lightweight swing detector that accurately identifies market structure turning points? Want clear, reliable buy and sell signals that work across any timeframe and any instrument? Buy Sell Arrow MT Swing is built exactly for that — precision swing detection made simple and effective. This indicator identifies Higher Highs (HH) , Higher Lows (HL) , Lower Highs (LH) , and Lower Lows (LL) with remarkable clarity. It is designed to help traders easily visualize market stru
LIMITED TIME SALE - 30% OFF! WAS $50 - NOW JUST $35! Profit from market structure changes as price reverses and pulls back. The market structure reversal alert indicator identifies when a trend or price move is approaching exhaustion and ready to reverse. It alerts you to changes in market structure which typically occur when a reversal or major pullback are about to happen. The indicator identifies breakouts and price momentum initially, every time a new high or low is formed near a po
Trend indicator AI
Ramil Minniakhmetov
4.49 (84)
Trend Ai indicator is great tool that will enhance a trader’s market analysis by combining trend identification with actionable entry points and reversal alerts.  This indicator empowers users to navigate the complexities of the forex market with confidence and precision Beyond the primary signals, Trend Ai indicator identifies secondary entry points that arise during pullbacks or retracements, enabling traders to capitalize on price corrections within the established trend. Important Advantage
More from author
CCI Alerts
Yurij Izyumov
When using CCI (Commodity Channel Index) oscillator, the waiting time till the next signal can be long enough depending on a timeframe. CCI Alerts indicator prevents you from missing the indicator signals. It is a good alternative for the standard CCI indicator. Once there appears a CCI signal on the required level, the indicator will notify you with a sound or push, so you will never miss an entry. This is especially significant if you follow the indicator in different timeframes and currency p
The indicator is designed for building horizontal channels and signal zones, detecting breakouts of extremes, bounces and targets based on custom Fibonacci levels (with or without sound alerts). It automatically applies your chosen Fibonacci levels to those extremes. When price breaks the Fibonacci levels enabled in the settings, the indicator can play a sound, show a message, send a push notification to your mobile terminal or an email (if enabled). Features: automatic channel building by time
Extremum Reverse Bar
Yurij Izyumov
2.8 (5)
This indicator has been created for finding the probable reversal points of the symbol price. A small candlestick reversal pattern is used it its operation in conjunction with a filter of extremums. The indicator is not redrawn! If the extremum filter is disabled, the indicator shows all points that have a pattern. If the extremum filter is enabled, the condition works – if the history Previous bars 1 candles back contains higher candles and they are farther than the Previous bars 2 candle, such
FREE
First RSI level
Yurij Izyumov
4.5 (6)
First RSI level indicator analyzes and displays the level, at which the first crossing of the standard RSI maximum or minimum value took place for the subsequent definition of strong trends. The indicator allows you to track the beginning of a trend that does not follow the signals of the standard RSI trading strategy, for example, when the price rushes downwards after reaching an oversold level instead of reversing. In this case, we have to conclude that a strong trend is underway and the next
FREE
Time Levels for MT5
Yurij Izyumov
1 (1)
The indicator is designed for displaying the following price levels on the chart: Previous day's high and low. Previous week's high and low. Previous month's high and low. Each of the level types is customizable. In the indicator settings, you set line style, line color, enable or disable separate levels. Configurations ----Day------------------------------------------------- DayLevels   - enable/disable previous day's levels. WidthDayLines   - line width of daily levels. ColorDayLines   - line
FREE
Time Levels
Yurij Izyumov
4.38 (8)
The indicator is designed for displaying the following price levels on the chart: Previous day's high and low. Previous week's high and low. Previous month's high and low. Each of the level types is customizable. In the indicator settings, you set line style, line color, enable or disable separate levels. The version of the exact same indicator but only with sound alerts there - Time Levels with Alerts . Configurations ----Day------------------------------------------------- DayLevels - enable/
FREE
RSI vs Envelopes
Yurij Izyumov
2 (2)
This semaphore indicator is based in the standard RSI, which is applied over the Envelopes indicator that shows an envelope or envelope fluctuation borders. This is a version of RSI vs Envelopes Graph drawn in a separate window . A sell signal emerges when the upper envelope/border is broken by the RSI indicator from top to bottom. A buy signal emerges when the lower envelope/border is broken by the RSI indicator from bottom upwards. The indicator can draw arrows on the indicator, draw vertical
FREE
RSI 7TF
Yurij Izyumov
2.75 (4)
This is a multitimeframe RSI indicator defining trends, oversold/overbought zones, as well as all intersections of signal lines from different timeframes on a single chart using arrows and audio alerts. When working with standard RSI, we often need to examine data from all necessary timeframes simultaneously. RSI 7TF solves this issue. If you are only interested in audio signals when signal lines are crossed, then have a look at RSI Alerts . Attention! The indicator uses seven timeframes - M5, M
FREE
This semaphore indicator is based in the standard RSI, which is applied over the Envelopes indicator that shows an envelope or envelope fluctuation borders. This is a version of RSI vs Envelopes drawn in the symbol window . A sell signal emerges when the upper envelope/border is broken by the RSI indicator from top to bottom. A buy signal emerges when the lower envelope/border is broken by the RSI indicator from bottom upwards. The indicator can draw arrows on the indicator, draw vertical lines
FREE
Disconnect Alerts
Yurij Izyumov
5 (1)
If you execute or test an Expert Advisor on a laptop, personal computer or a VPS, you may face the situation when Internet connection is lost and the EA stops. Of course, this utility ( Disconnect Alerts ) will not help you restore the Internet connection, but it will gather the information and will send an alert to you about when and how long your terminal was without access to the Internet and did not actually work. After receiving such a notification, you can check your trades or think about
FREE
Stable Trend MA
Yurij Izyumov
4.5 (2)
The indicator is based on a single Moving Average of a user-defined period. By analyzing the price movement of the price relative to this MA, and also by tracking all updates of the price Highs and Lows over the same period as the MA period, the indicator draws its own picture of the trend, avoiding the ever-breaking MA lines. Therefore, if the trend goes up, the line will also point upwards and will not change its direction even on small retracements, allowing to capture almost the entire trend
FREE
This indicator MA Alerts with Arrows gives you the opportunity to receive signals about the intersection of two moving averages (Moving Average), as well as signals about the price rollback to MA - to enter the transaction. Alert options: Sound and text alerts (alert). Push notification to the mobile terminal. Email notification (message to your e-mail).  Visual alert (arrows on the chart). The indicator has the following features: To display or hide the moving averages and arrows themselves.  T
As the proper trading using CCI indicators requires the trader to monitor multiple timeframes and CCI indicators with different periods. For example - monitor the trend using CCI with the period of 100 or 200 ( slow CCI period ) on the H4 timeframe, and make entries based on the CCI with the period of 13 ( fast CCI period ) on the H1 timeframe. To facilitate this task, the Delta CCi MTF7 indicator was created, which implements monitoring the changes of the price movement trends as well as marks
RSI Alerts
Yurij Izyumov
5 (1)
RSI Alerts is a MetaTrader 4 indicator that adds convenient alerts to the classic Relative Strength Index (RSI). You still see the RSI line and levels 30, 50, 70, but when the selected levels are crossed the indicator can show popup alerts, send push notifications and emails - so you don't miss a potential reversal or breakout. What is it based on? The indicator is built on the standard RSI (Relative Strength Index) - the same oscillator used by millions of traders to assess overbought/oversold
MarketView
Yurij Izyumov
The MarketView utility is designed to display the market changes in percents as a table over the specified time interval. Every column element can be disabled. The color scheme can be easily and quickly customized for your needs. The number of symbols in columns can be adjusted ( PerColumn ). The MarketView also allows to open chart of any symbol by simply clicking its name. It can automatically apply any customized template to the newly opened chart. Attention! In order to remove any symbol fro
Extremum catcher
Yurij Izyumov
1 (1)
The Extremum catcher indicator analyzes the price action after breaking the local Highs and Lows, generates price reversal signals with the ability to plot the Price Channel. If you need the version for MetaTrader 5, see Extremum catcher MT5 . The indicator takes the High and Low of the price over the specified period - 24 bars by default (can be changed). Then, if on the previous candle the price broke the High or Low level and the new candle opened higher than the extremums, then a signal will
You can avoid constant monitoring of computer screen waiting for the DeMarker signal while receiving push notifications to a mobile terminal or a sound alert on the screen about all required events, by using this indicator - DeMarker Alerts. In fact, it is the replacement of the standard indicator with which you will never miss the oscillator signals. If you don't know the benefits of DeMarker or how to use it, please read here . If you need signals of a more popular RSI indicator, use RSI Alert
MFI Alerts
Yurij Izyumov
If you use the MFI (Money Flow Index) indicator, the waiting time till the next signal can be long enough. Now you can avoid sitting in front of the monitor by using MFI Alerts. This is an addition or a replacement to the standard MFI oscillator . Once there appears an MFI signal on the required level, the indicator will notify you with a sound or push, so you will never miss a signal. This is especially significant if you follow the indicator in different timeframes and currency pairs, which ca
The RSI Panel MTF indicator has been created in order to have the ability to monitor the values of the standard RSI indicator from a multitude of timeframes and symbols on a single chart, as well as to receive timely notifications about the trading opportunities using an audio signal or a notification. The indicator can output both the indicator values, and only the indicator signals (confirmed and expected). A user-friendly feature for selecting the required symbol has been implemented - simply
This is an expanded version of the Time Levels indicator provided with sound alerts notifying of level intersection. The indicator is designed for displaying the following price levels on the chart: Previous day's high and low. Previous week's high and low. Previous month's high and low. Each of the level types is customizable. In the indicator settings, you set line style, line color, enable or disable separate levels. This version is provided with an option for alerting using an audio signal a
The indicator is designed for building horizontal channels and signal zones, detecting breakouts of extremes, bounces and targets based on custom Fibonacci levels (with or without sound alerts). It automatically applies your chosen Fibonacci levels to those extremes. When price breaks the Fibonacci levels enabled in the settings, the indicator can play a sound, show a message, send a push notification to your mobile terminal or an email (if enabled). Features: automatic channel building by time
The indicator is a modification of RSI Alerts . However, it does not have a separate RSI indicator window. Instead, it uses signal arrows on the price chart. This saves space on the symbol chart, without affecting the quality of received signals and alerts. Similar to RSI Alerts, the indicator can generate sound alert, send push notifications and email messages, as well as draw signal arrows. The display of arrow can be disabled. If the arrows are enabled, they only display the signals chosen in
RSI Alerts is a MetaTrader 5 indicator that adds convenient alerts to the classic Relative Strength Index (RSI). You still see the RSI line and levels 30, 50, 70, but when the selected levels are crossed the indicator can show popup alerts, send push notifications and emails - so you don't miss a potential reversal or breakout. What is it based on? The indicator is built on the standard RSI (Relative Strength Index) - the same oscillator used by millions of traders to assess overbought/oversol
When using CCI (Commodity Channel Index) oscillator, the waiting time till the next signal can be long enough depending on a timeframe. CCI Alerts indicator prevents you from missing the indicator signals. It is a good alternative for the standard CCI indicator. Once there appears a CCI signal on the required level, the indicator will notify you with a sound or push, so you will never miss an entry. This is especially significant if you follow the indicator in different timeframes and currency p
The Extremum catcher MT5 indicator analyzes the price action after breaking the local Highs and Lows and generates price reversal signals with the ability to plot the Price Channel. If you need the version for MetaTrader 4, see Extremum catcher . The indicator takes the High and Low of the price over the specified period - 24 bars by default (can be changed). Then, if on the previous candle, the price broke the High or Low level and the new candle opened higher than the extremums, then a signal
You can avoid constant monitoring of computer screen waiting for the DeMarker signal while receiving push notifications to a mobile terminal or a sound alert on the screen about all required events, by using this indicator - DeMarker Alerts. In fact, it is the replacement of the standard indicator with which you will never miss the oscillator signals. If you don't know the benefits of DeMarker or how to use it, please read here . If you need signals of a more popular RSI indicator, use RSI Alert
MFI Alerts MT5
Yurij Izyumov
5 (1)
If you use the MFI (Money Flow Index) indicator, the waiting time till the next signal can be long enough. Now you can avoid sitting in front of the monitor by using MFI Alerts. This is an addition or a replacement to the standard MFI oscillator . Once there appears an MFI signal on the required level, the indicator will notify you with a sound or push, so you will never miss a signal. This is especially significant if you follow the indicator in different timeframes and currency pairs, which ca
This indicator is a modification of the RSI Alerts indicator, but without a separate RSI indicator window and with signal arrows directly on the symbol's chart. This saves space on the symbol's chart without losing the quality of the received signals and notifications. Just like RSI Alerts, the indicator can provide sound alerts, push notifications, the ability to send messages to email has been added, as well as drawing arrows at the location where the signal appears. Arrow display can be turne
Filter:
No reviews
Reply to review