Pivot Point MT4 Indicator by PipTick
- Indicadores
-
Michal Jurnik
 "Talent is cheaper than table salt. What separates the talented individual from the successful one is a lot of hard work." - Stephen King. Those few words reflect myself very well. I am probably not the most talented developer in the world but I truly believe in hard work, professional attitude and
 - Versión: 1.1
- Actualizado: 1 diciembre 2021
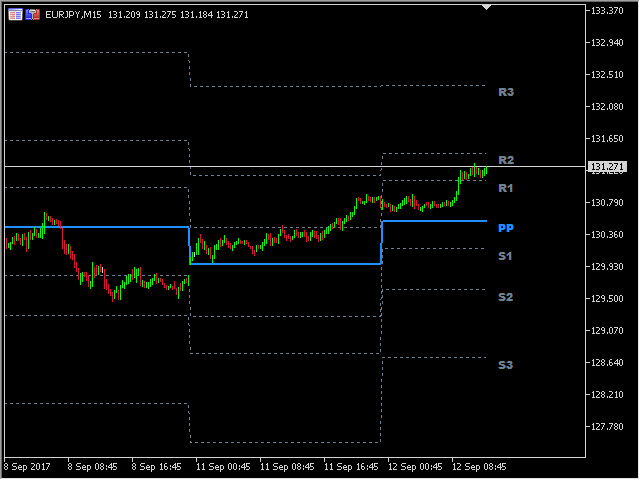
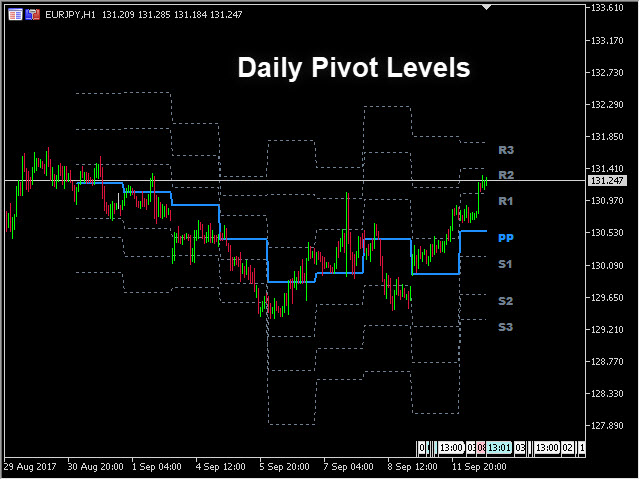
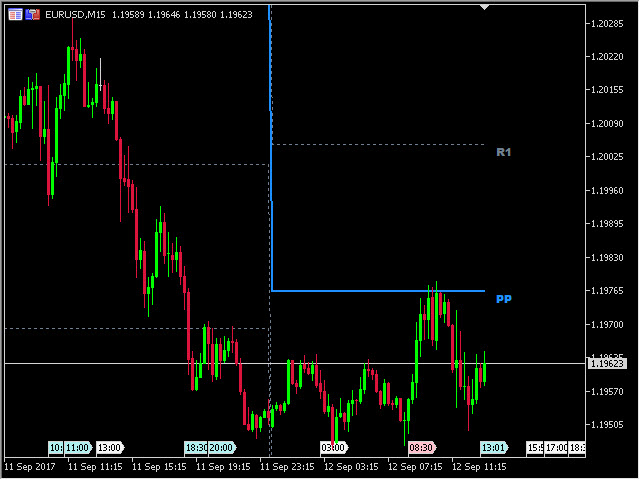
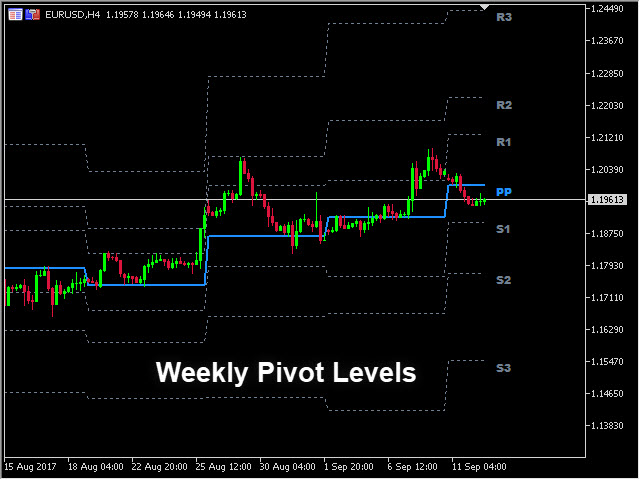
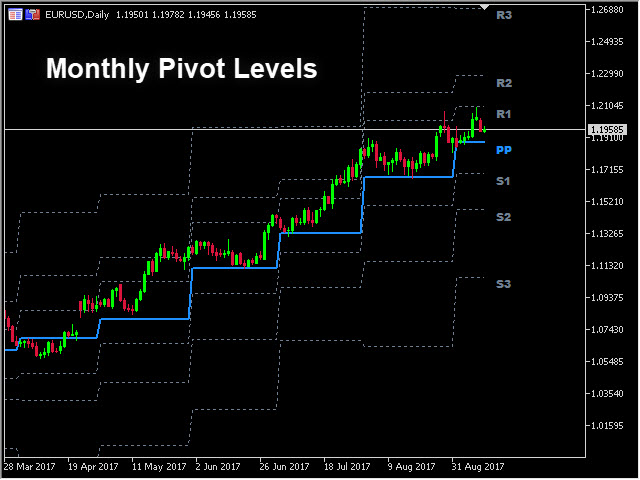
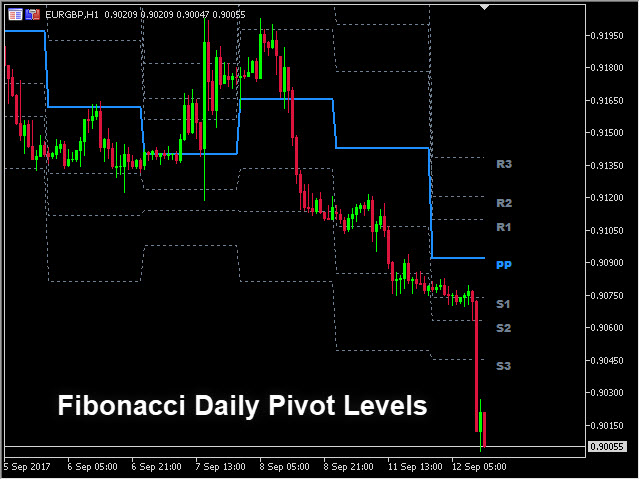
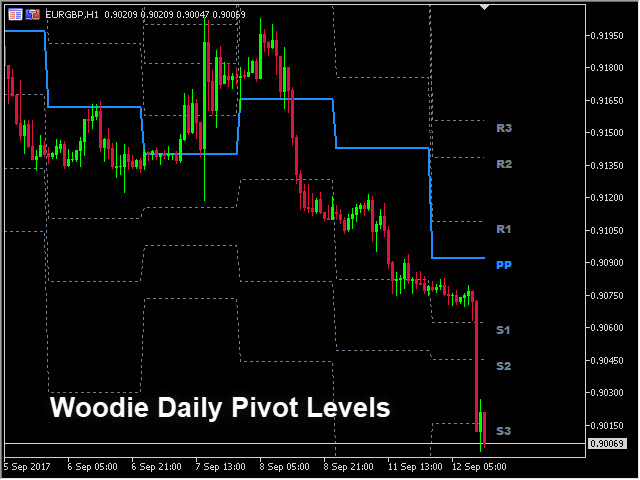
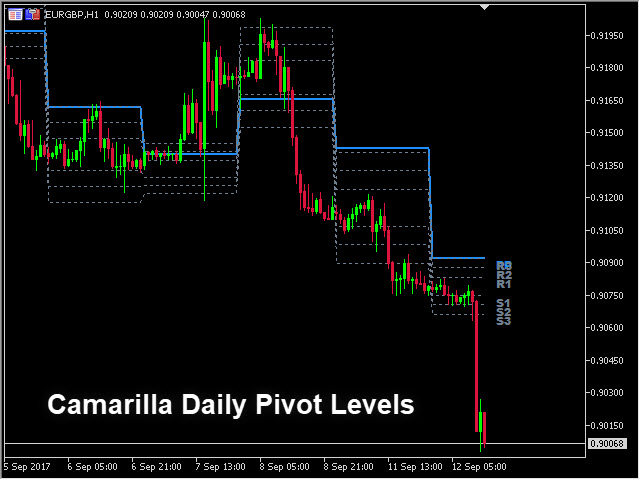
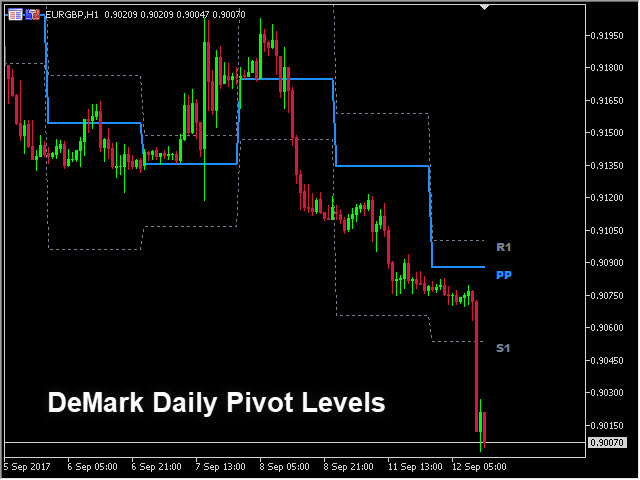
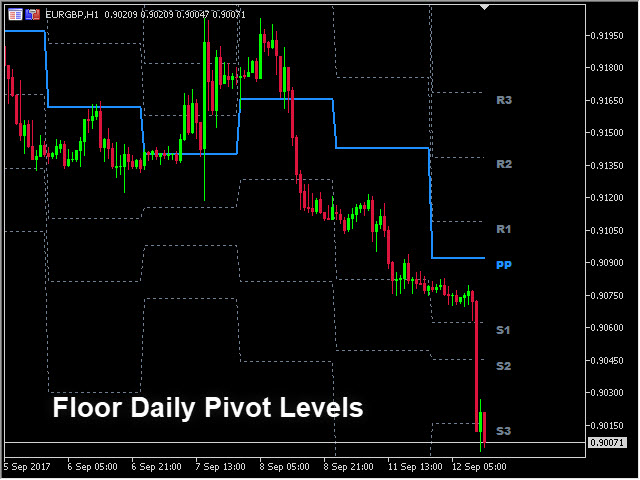
Elindicador Punto Pivote calcula y muestra automáticamente la línea del punto pivote y los niveles de soporte y resistencia. El pivote puede calcularse según la fórmula Clásica, Suelo, Fibonacci, Woodie, Camarilla o DeMark. También es posible seleccionar el periodo de cálculo del indicador. El operador puede elegir entre periodos diarios, semanales, mensuales o definidos por el usuario.
Tipos de pivotes
- Clásico
- Suelo
- Fibonacci
- Woodie
- Camarilla
- DeMark
Características principales
- El indicador muestra el nivel actual e histórico del punto pivote
- Niveles de soporte y resistencia del pivote
- Notificaciones de alerta para las líneas del indicador
- Tiempo de sesión personalizado
- Funciona en todos los marcos temporales (M1, M5, M15, M30, H1, H4, D1, W1, MN)
- El indicador no repinta
- Listo para backtesting
- Parámetros personalizables (colores, grosor de línea, visibilidad...)
- Cálculo de alta velocidad
- Disponible para MT4 y MT5


HI simple and accurate, easy to use it. WELL DONE. Thank you