Pivot Point MT4 Indicator by PipTick
- Indikatoren
-
Michal Jurnik
 "Talent is cheaper than table salt. What separates the talented individual from the successful one is a lot of hard work." - Stephen King. Those few words reflect myself very well. I am probably not the most talented developer in the world but I truly believe in hard work, professional attitude and
 - Version: 1.1
- Aktualisiert: 1 Dezember 2021
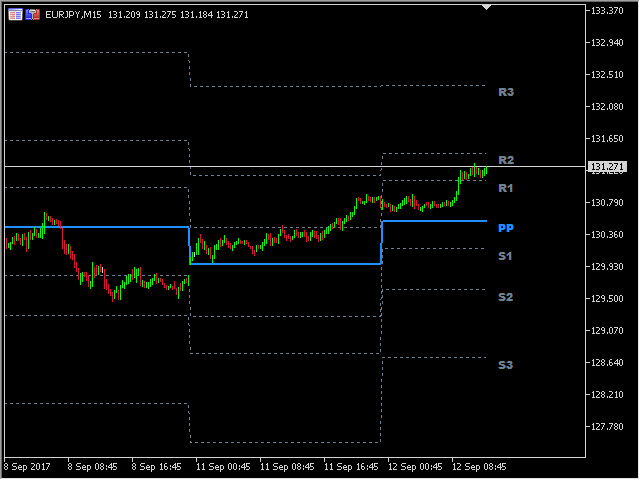
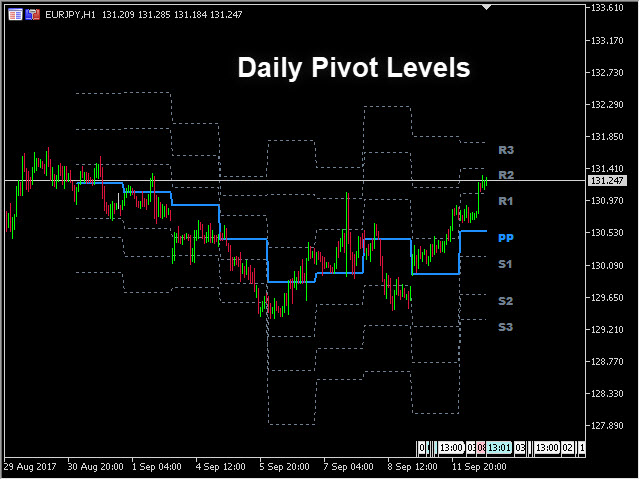
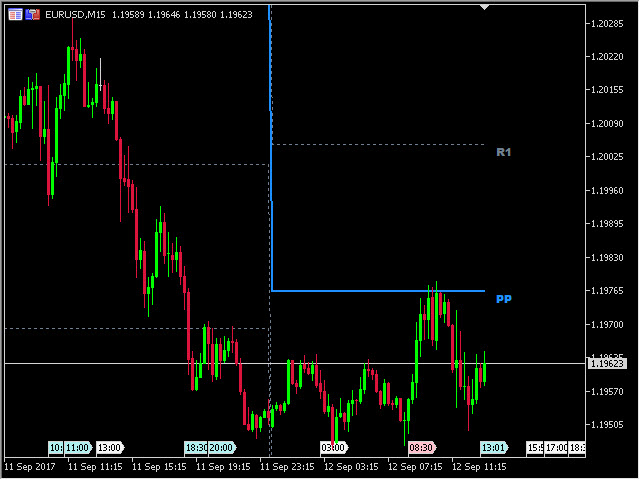
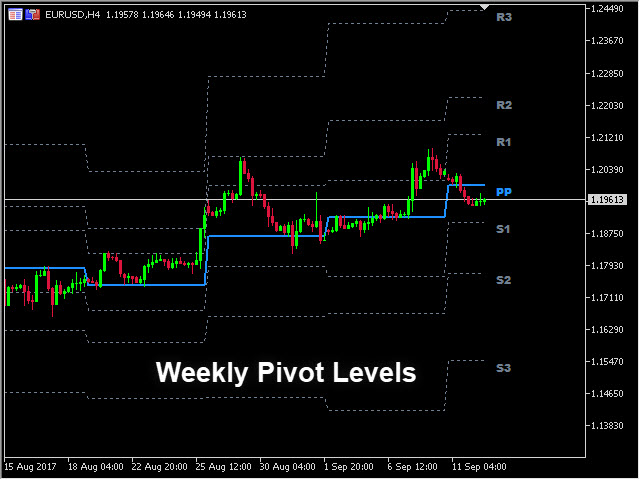
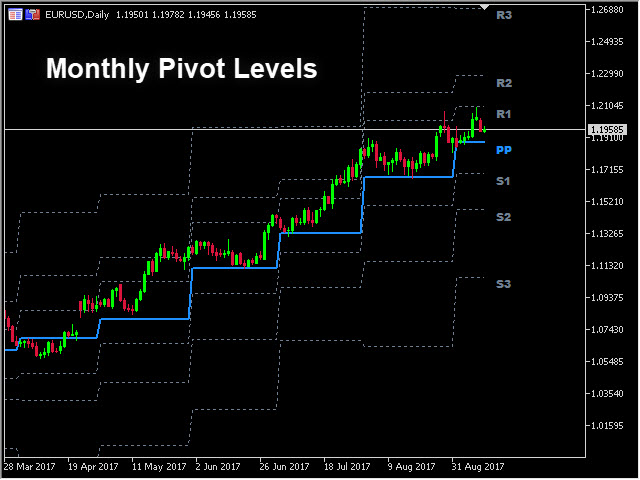
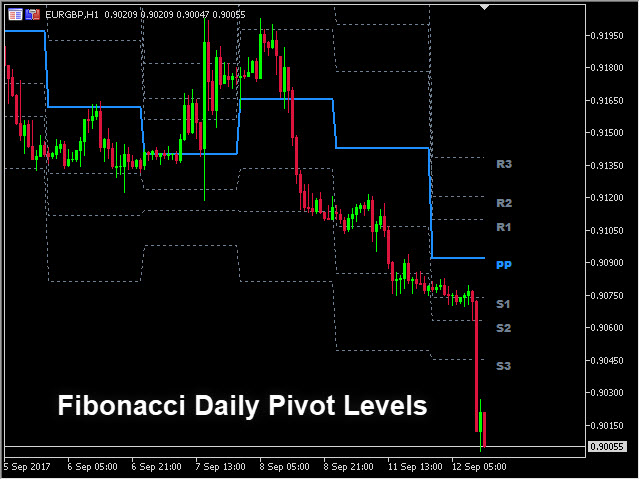
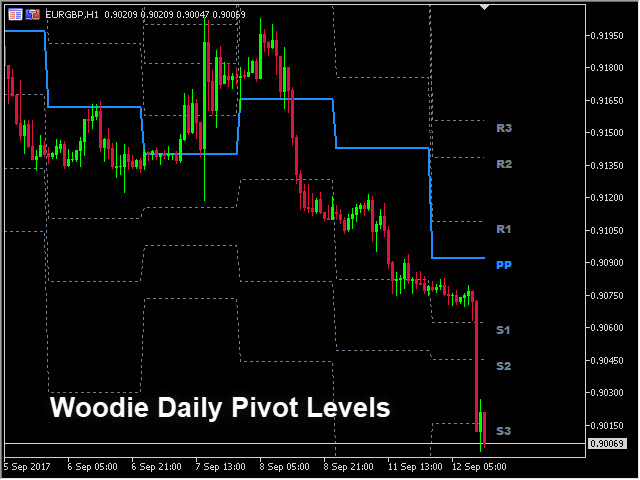
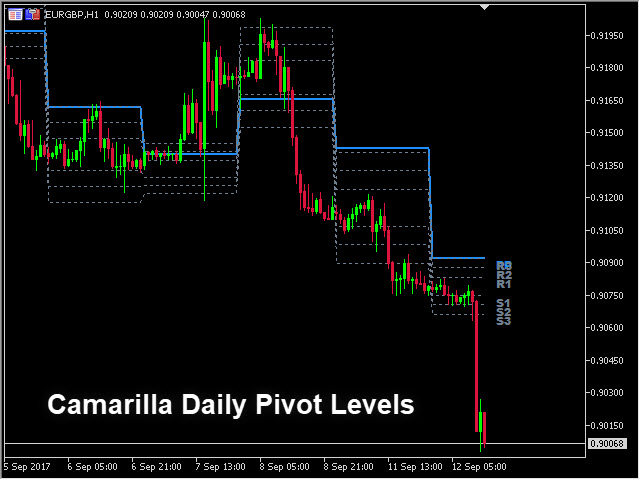
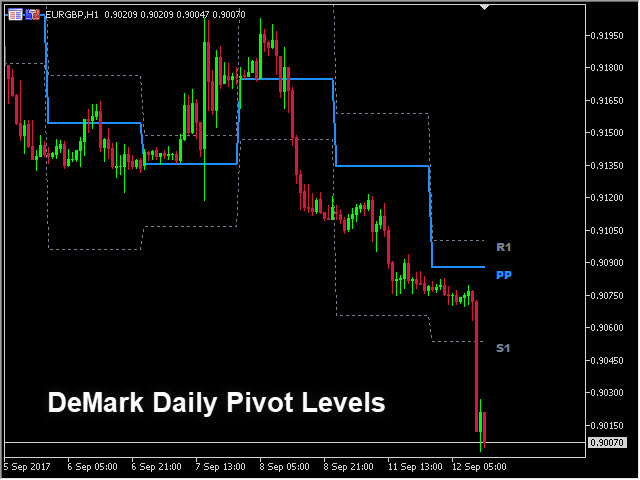
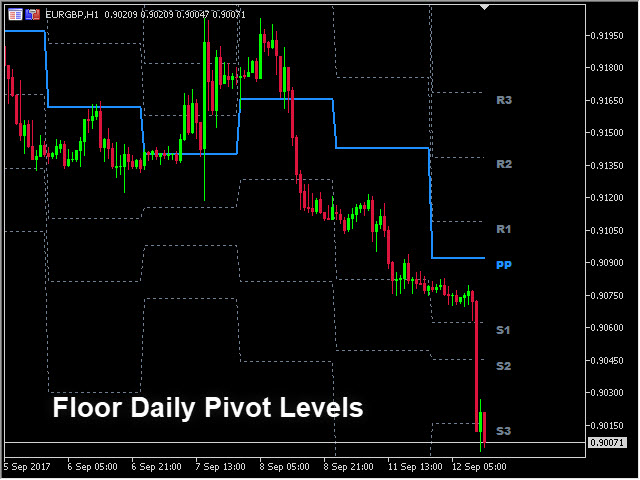
DerPivot-Point-Indikator berechnet automatisch die Pivot-Point-Linie sowie die Unterstützungs- und Widerstandsniveaus und zeigt diese an. Der Pivotpunkt kann nach der Classic-, Floor-, Fibonacci-, Woodie-, Camarilla- oder DeMark-Formel berechnet werden. Es ist auch möglich, den Zeitraum für die Berechnung des Indikators zu wählen. Der Händler kann zwischen täglichen, wöchentlichen, monatlichen oder benutzerdefinierten Zeiträumen wählen.
Arten von Pivots
- Klassisch
- Boden
- Fibonacci
- Woodie
- Camarilla
- DeMark
Wichtigste Merkmale
- Der Indikator zeigt das aktuelle und historische Pivot-Punkt-Niveau an
- Pivot-Unterstützungs- und Widerstandsniveaus
- Alarmbenachrichtigungen für Indikatorlinien
- Benutzerdefinierte Sitzungszeit
- Funktioniert auf jedem Zeitrahmen (M1, M5, M15, M30, H1, H4, D1, W1, MN)
- Der Indikator wird nicht neu gezeichnet
- Bereit für Backtesting
- Anpassbare Parameter (Farben, Liniendicke, Sichtbarkeit...)
- Hochgeschwindigkeits-Berechnung
- Verfügbar für MT4 und MT5


HI simple and accurate, easy to use it. WELL DONE. Thank you