Classic Keltner Channel
- Indicators
-
Muhammad Elbermawi
 Hi Forex trader,
.
I am Muhammad Al Bermaui, from Alexandria, Egypt. I trade since 1996 and I become a CMT holder in 2013 (the highest diploma in technical analysis).
. - Version: 2.2
- Updated: 8 March 2020
- Activations: 20
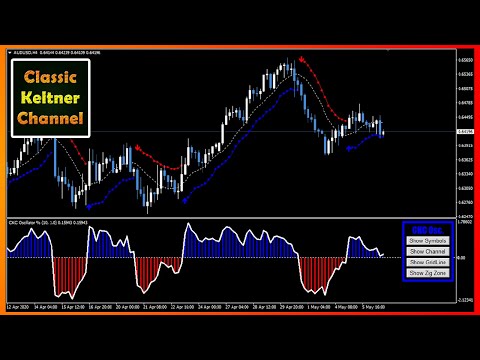
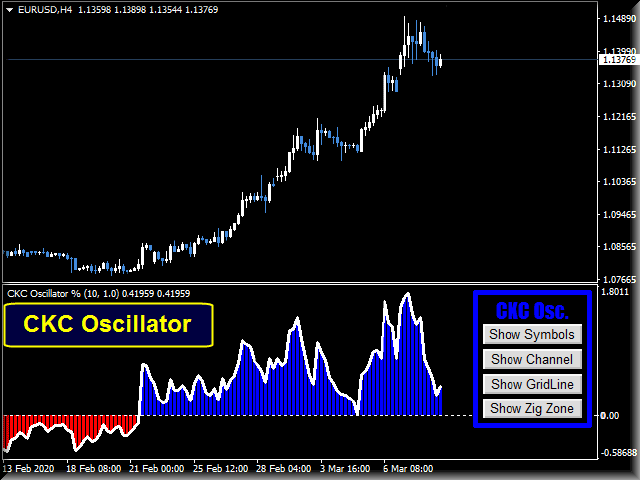
Or CKC.
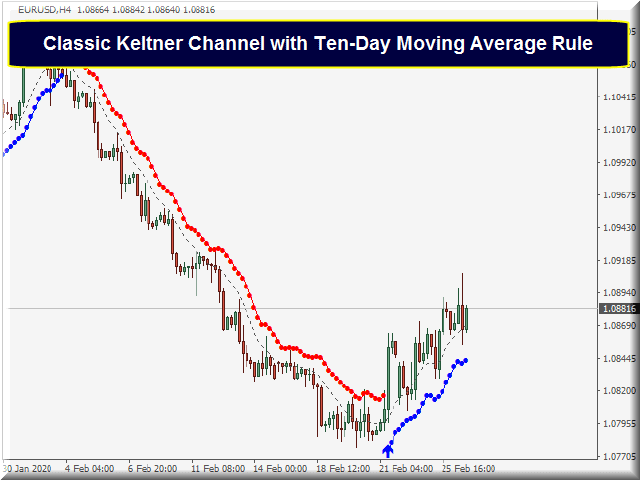
This indicator works depending on the classic ten-day moving average rule described by Chester W. Keltner (1909–1998). All parameters are set to the classic version of the Keltner system by default, while the user can change them if he wants.
Important Information
About Keltner Channel Formula
1. Calculate the Center Line as a simple moving average from the Typical Price (= (High + Low + Close) / 3).
2. Calculate The Average Daily Range (ADR) which is the average difference between high and low, with the same period and calculation method for the center-line.
3. Keltner Buy Line = Center Line + ADR.
4. Keltner Sell Line = Center Line – ADR.
Keltner 10 day moving average rule
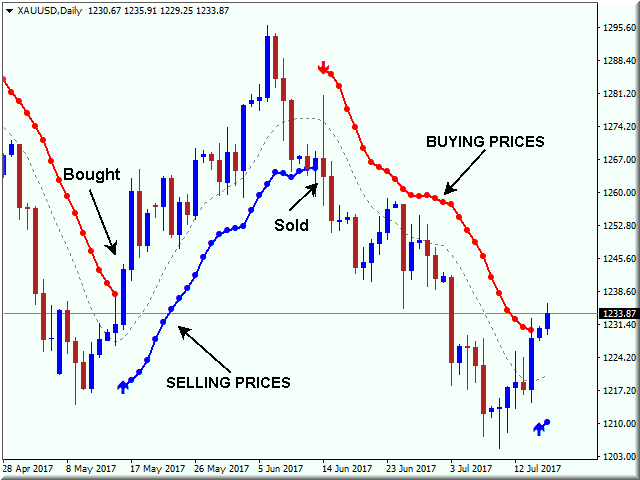
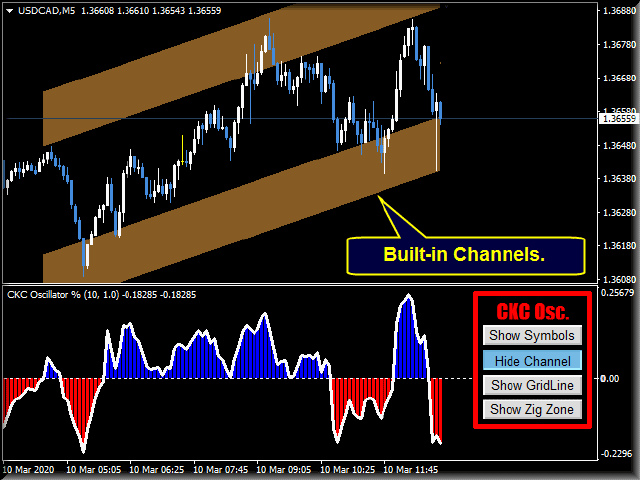
Keltner formula leads to create two basic lines on the chart.
2. Keltner Sell Line.This is the line where you cover your buy position and go to sell.
By using those two lines we got trading rules that depend on the "Start and Reverse" principle that is widely used in technical analysis.
1. When the price line closes above the Keltner Buy Line (the red line) then buy. Use Keltner Sell Line (the blue line) as a stop and reverse from buy to sell.
2. When the price line closes below the Keltner Sell Line (the blue line) then sell. Use Keltner Buy Line (the red line) as a stop and reverse from sell to buy.
CKC Features
CKC does not repaint or recalculate its results.
It works on cryptocurrencies, stock, index, oil, gold, and on all time frames.
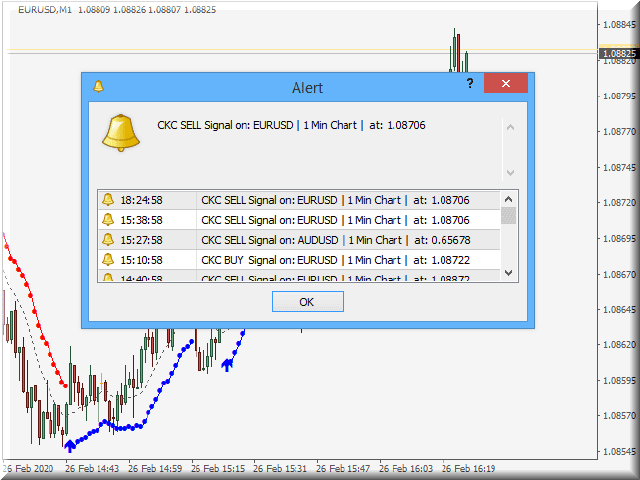
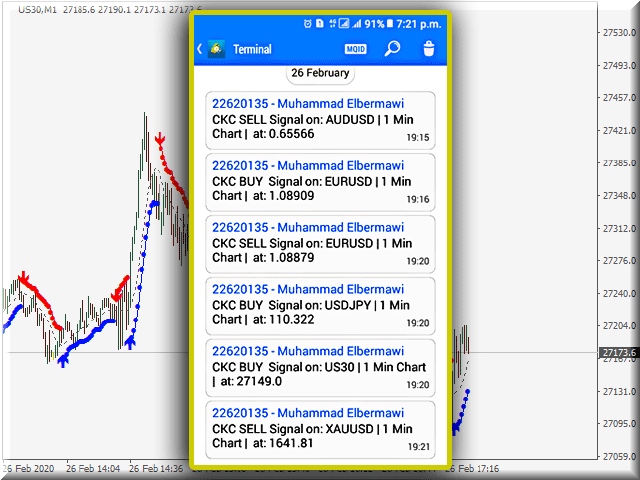
Sound, email alerts and Mobile Notification.
Buy, sell arrows to help to identifying trend signals.
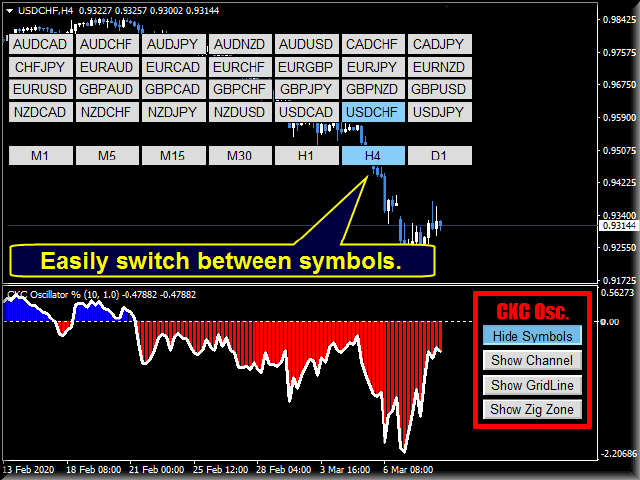
Well-designed parameters to help the user easily navigate between them.
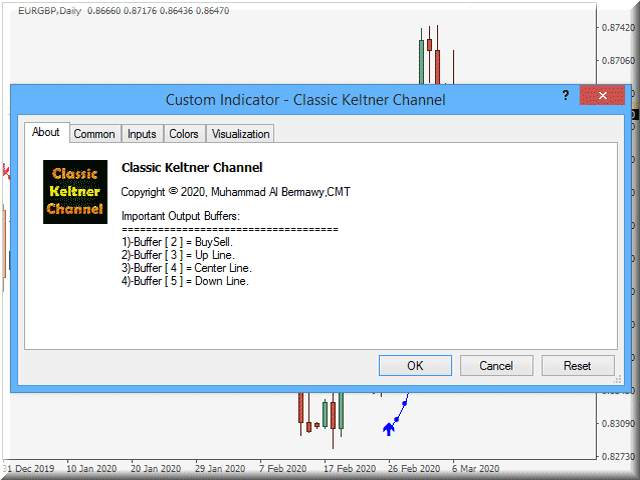
Buffer to build your own expert advisors.
Four different color lists to choose from.
CKC Parameters
(1) INDICATOR PARAMETERS
- CKC Candles.The number of candles used in bands calculations (default is 10 candles).
- CKC Range Multiplier.How much far will the Keltner Buy/Sell line separate from their Center Line (default is 1.0).
- CKC Moving Average Method.Moving Average type used in calculations (Simple Moving Average is the default).
- CKC Applied Price.Price used in Keltner Center Line Calculations (Typical Price is the default).
(2) ALERTS
- Sound Alert.Choose to use or stop alert sound and message (default is true).
- Send Email.Option to send an email to the user (default is false).
- Send Mobile Notification.Option to send a mobile notification to the user (default is false).
(3) INDICATOR STYLE
- Chart Colors List.You can choose between four different color lists (default is Do Nothing).
- CKC Upper Band Color.Default is Red.
- CKC Lower Band Color. Default is Blue.
- CKC Width.Default is one.
If you have any questions then please, contact me via a private message or, write them in the comment section.
Muhammad Al Bermaui, CMT


Indicator looks perfectly good and working fine, looking forward to learn it