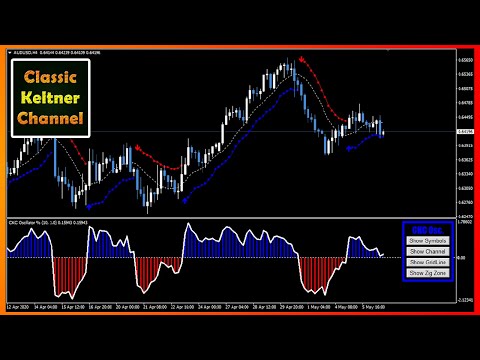
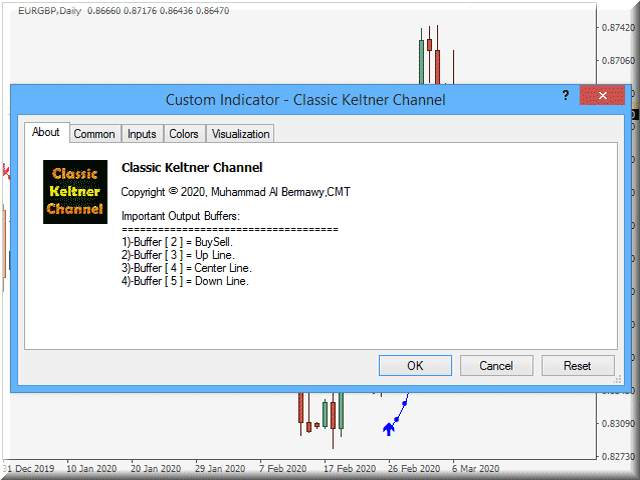
Classic Keltner Channel
- 지표
-
Muhammad Elbermawi
 Hi Forex trader,
.
I am Muhammad Al Bermaui, from Alexandria, Egypt. I trade since 1996 and I become a CMT holder in 2013 (the highest diploma in technical analysis).
. - 버전: 2.2
- 업데이트됨: 8 3월 2020
- 활성화: 20
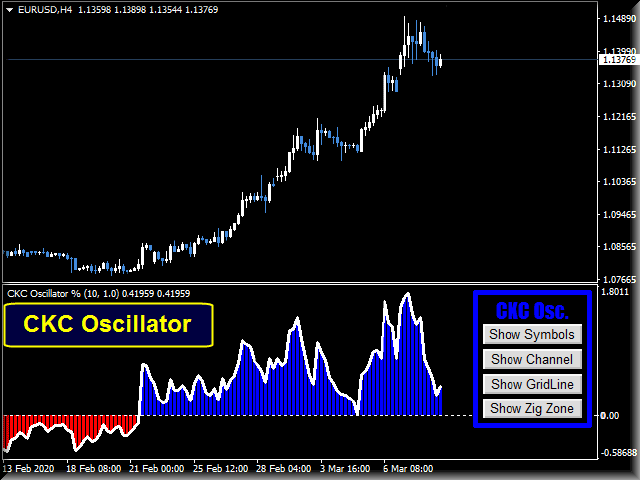
또는 CKC.
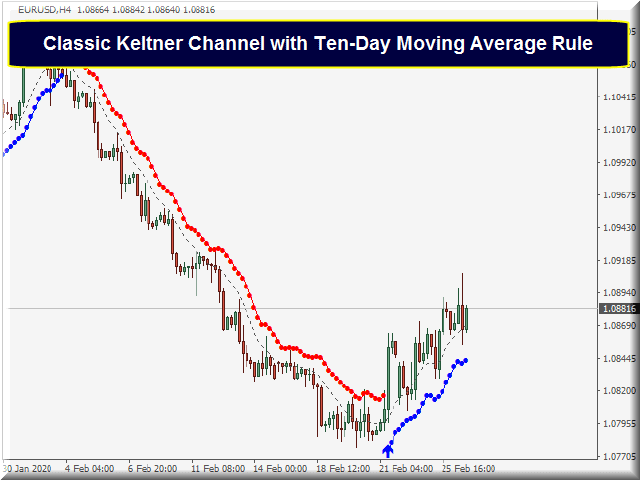
이 지표는 Chester W. Keltner(1909–1998)가 설명한 고전적인 10일 이동 평균 규칙에 따라 작동합니다. 모든 매개변수는 기본적으로 Keltner 시스템의 클래식 버전으로 설정되며 사용자가 원하는 경우 변경할 수 있습니다.
중요한 정보
Keltner 채널 공식 정보
1. 표준가(= (고가 + 저가 + 종가) / 3)에서 단순 이동 평균으로 중심선을 계산합니다.
2. 고가와 저가의 평균 차이인 ADR(Average Daily Range)을 중심선에 대해 동일한 기간 및 계산 방법으로 계산합니다.
3. Keltner 매수 라인 = 센터 라인 + ADR.
4. Keltner 판매 라인 = 센터 라인 – ADR.
Keltner 10일 이동 평균 규칙
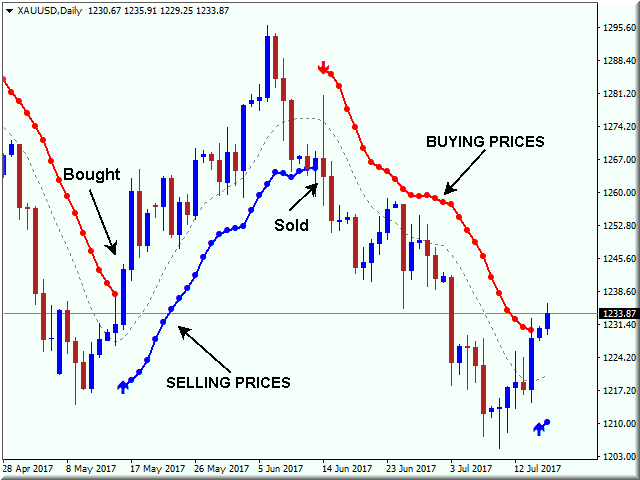
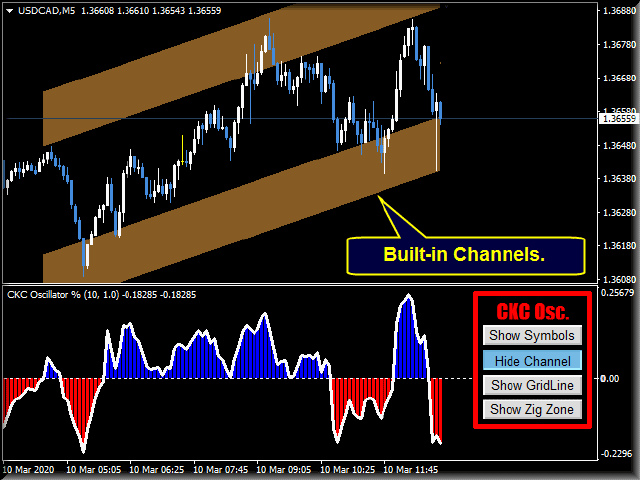
Keltner 공식은 차트에 두 개의 기본 선을 만듭니다.
2. Keltner 판매 라인.매수 포지션을 커버하고 매도하는 라인입니다.
이 두 줄을 사용하여 우리는 기술 분석에서 널리 사용되는 "시작 및 반전" 원칙에 따라 거래 규칙을 얻었습니다.
1. 가격 라인이 Keltner Buy Line(빨간색 라인) 위에서 닫히면 매수합니다. Keltner Sell Line(파란색 선)을 중지로 사용하고 매수에서 매도로 반전합니다.
2. 가격선이 Keltner 매도선(파란색 선) 아래로 닫히면 매도하십시오. Keltner 구매 라인(빨간색 라인)을 중지로 사용하고 매도에서 매수로 반전합니다.
CKC의 특징
CKC는 결과를 다시 그리거나 다시 계산하지 않습니다.
암호화폐, 주식, 지수, 석유, 금 및 모든 시간대에서 작동합니다.
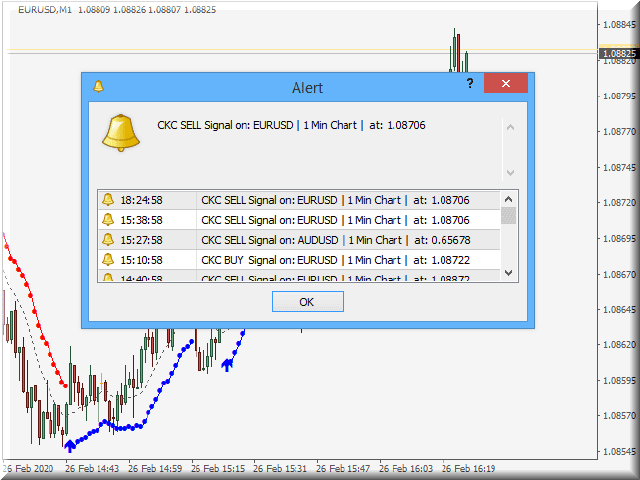
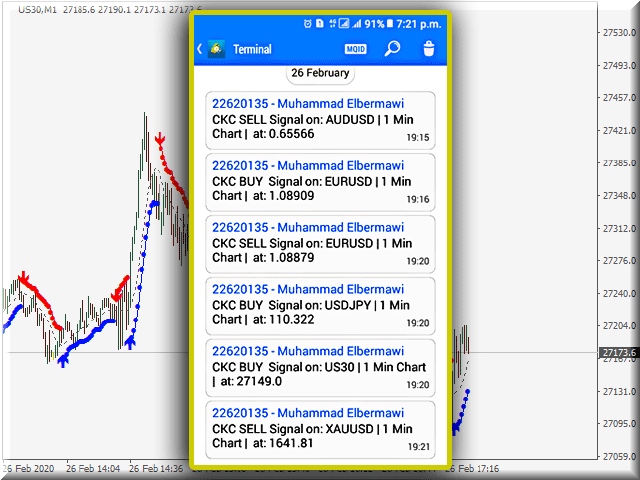
소리, 이메일 알림 및 모바일 알림.
추세 신호를 식별하는 데 도움이 되는 매수, 매도 화살표.
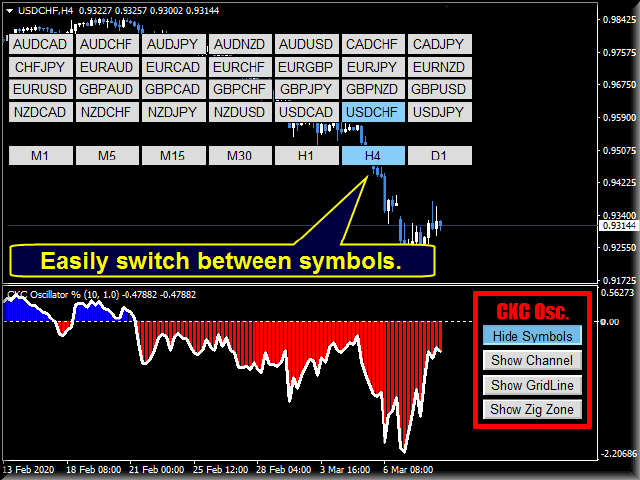
사용자가 매개변수를 쉽게 탐색할 수 있도록 잘 설계된 매개변수.
버퍼를 사용하여 자신의 전문 고문을 구축하십시오.
4가지 색상 목록 중에서 선택할 수 있습니다.
CKC 매개변수
(1) 표시 매개변수
- CKC 캔들.밴드 계산에 사용된 초의 수입니다(기본값은 10개의 초).
- CKC 범위 승수.Keltner 매수/매도 라인이 센터 라인에서 얼마나 멀리 떨어져 있습니까(기본값은 1.0).
- CKC 이동평균법.계산에 사용되는 이동 평균 유형(단순 이동 평균이 기본값임).
- CKC 적용 가격.Keltner 중앙선 계산에 사용된 가격(표준 가격이 기본값임).
(2) 경고
- 소리 경고.경고음 및 메시지를 사용하거나 중지하도록 선택합니다(기본값은 true).
- 이메일을 보내.사용자에게 이메일을 보내는 옵션(기본값은 false).
- 모바일 알림을 보냅니다.사용자에게 모바일 알림을 보내는 옵션(기본값은 false).
(3) 표시기 스타일
- 차트 색상 목록.네 가지 색상 목록 중에서 선택할 수 있습니다(기본값은 아무것도 하지 않음).
- CKC 어퍼 밴드 컬러.기본값은 빨간색입니다.
- CKC 하단 밴드 색상.기본값은 파란색입니다.
- CKC 너비.기본값은 하나입니다.
질문이 있으시면 비밀 메시지를 통해 저에게 연락하거나 의견 섹션에 작성하십시오.
무하마드 알 버마우이, CMT


Indicator looks perfectly good and working fine, looking forward to learn it