PythagoreanPoints MT5
- Indicators
- Version: 2.0
- Activations: 20

Pythagorean — Trend Direction Change Indicator
Overview
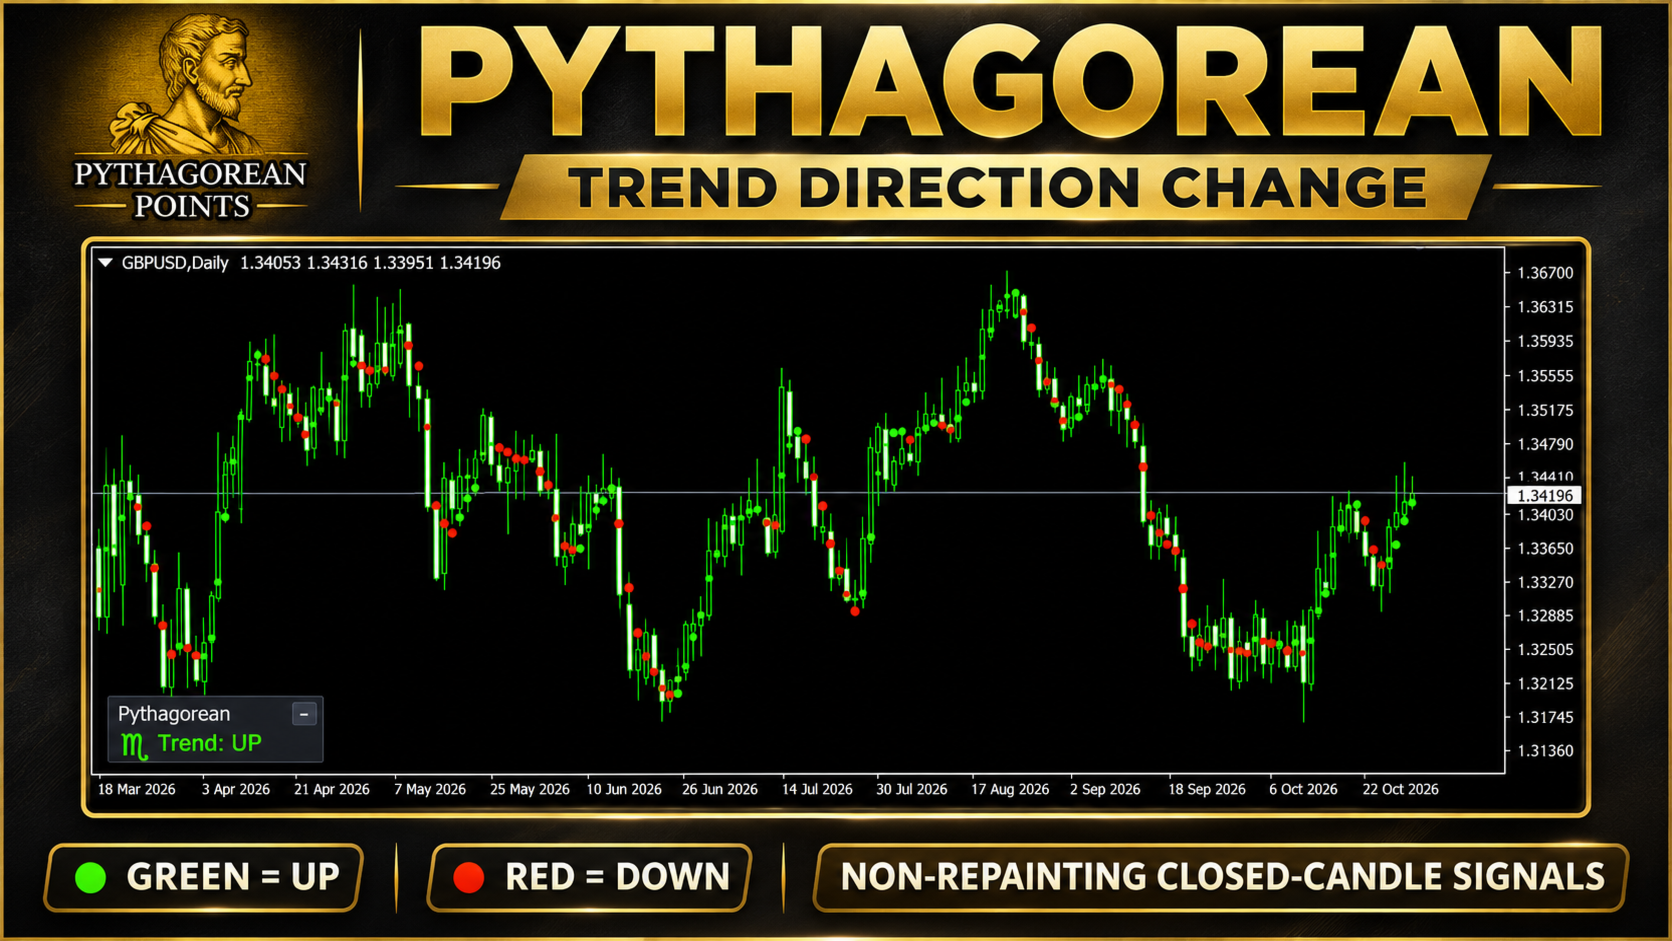
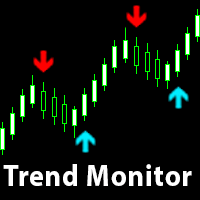
Pythagorean shows the current trend direction right on the price chart as a row of colored dots that follow price. Green dots mean upward movement, red dots mean downward movement. A change of dot color marks a change of trend direction. The indicator works on any symbol and any timeframe. Values on a closed candle are never redrawn.
MT4-version: https://www.mql5.com/en/market/product/80110
How to read it
- Green dots: the trend points up.
- Red dots: the trend points down.
- Color change from red to green: a possible start of an uptrend.
- Color change from green to red: a possible start of a downtrend.
How to use it
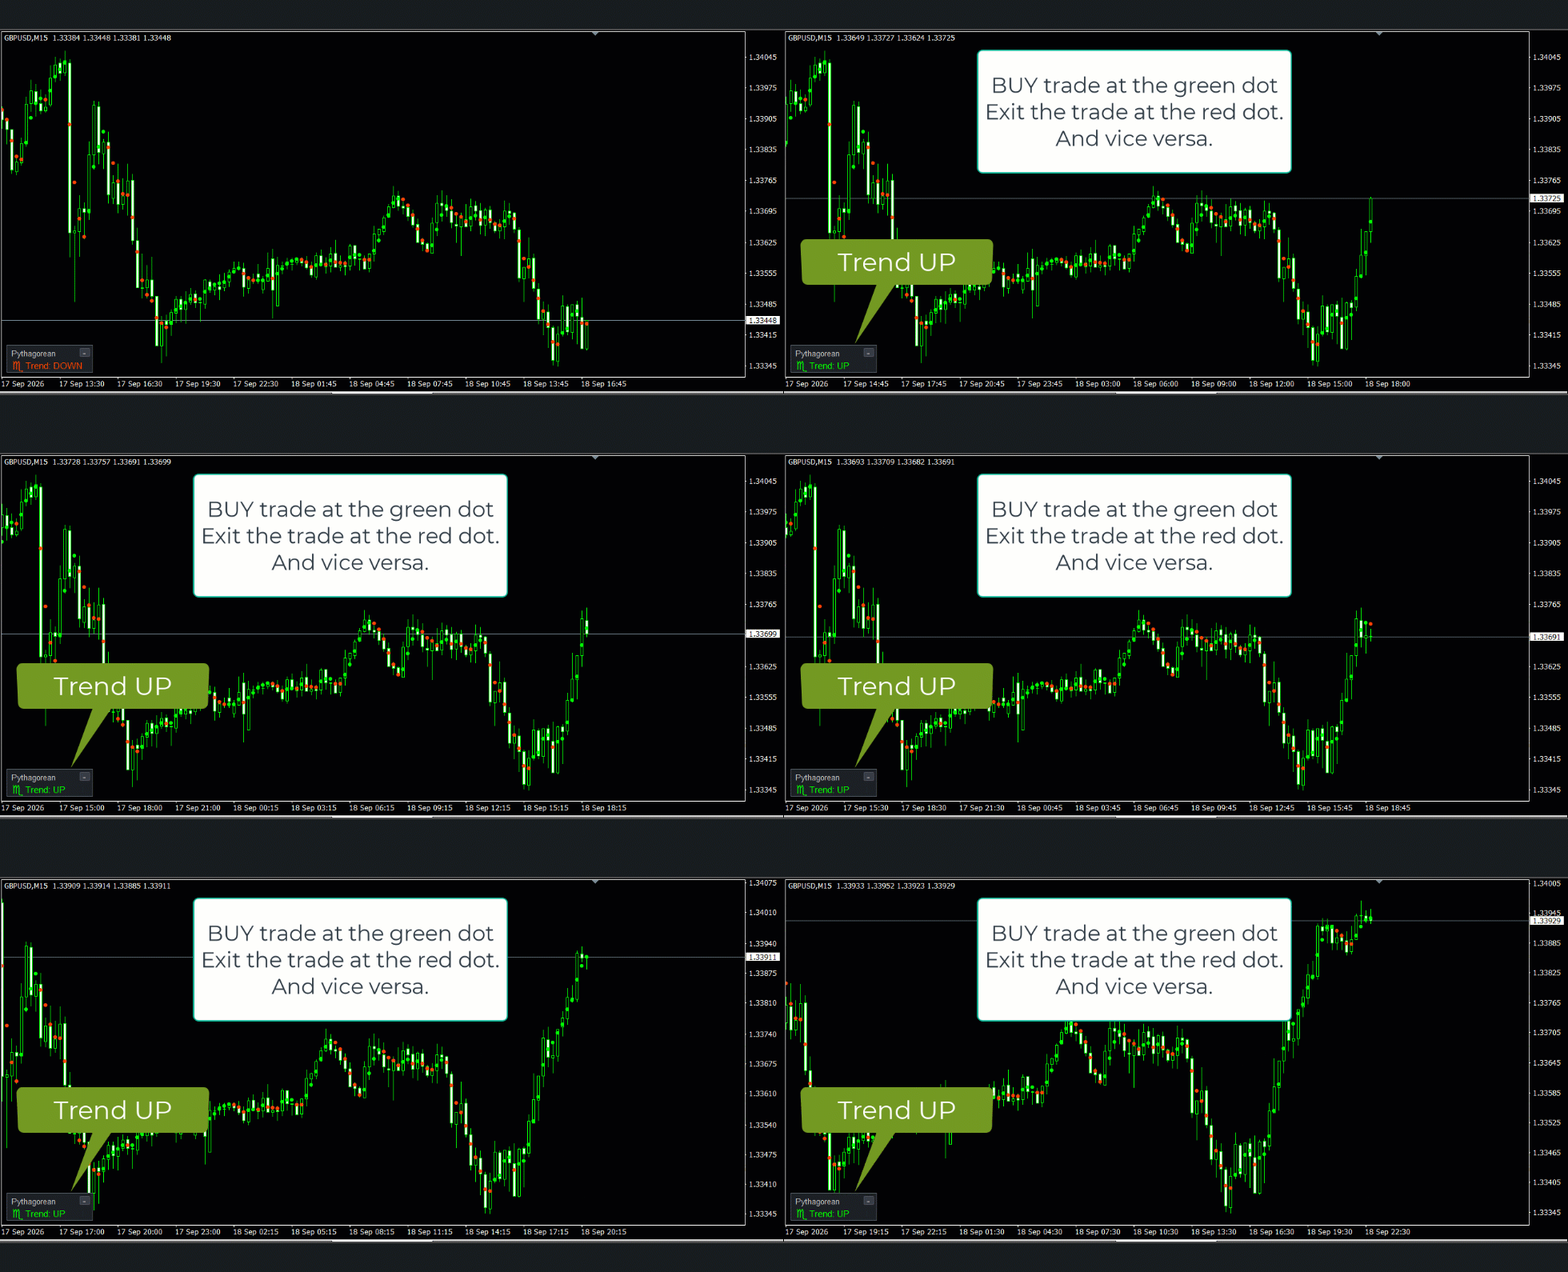
- Direction filter. Take only long trades while the dots are green and only short trades while they are red.
- Entry signal. Use a color change on a closed candle as a signal to enter in the new direction.
- Trade management and exit. A color change against an open position is a reason to close it or tighten protection.
- Multiple timeframes. The direction on a higher timeframe confirms or rejects a signal on a lower one.
- Choosing a timeframe. Higher timeframes give fewer but more significant color changes, lower timeframes give more frequent ones.
- The indicator combines well with support and resistance levels and other analysis tools.
Settings
- Applied_price — the price used by the indicator: Close (default), Open, High, Low, Median, Typical or Weighted. Close gives the most stable values on closed candles.
- Calculation of the global trend — the number of recent candles used to determine the overall (global) trend shown on the panel. A larger value reflects a longer picture, a smaller value reacts faster. Default: 200.
- Alert when the trend changes — turns the trend change alert on or off. The message contains the symbol and the new direction: UP Trend or DOWN Trend. The alert is sent once per new candle.
- Trend Change Candle — the candle on which a trend change is checked. Value 1 (default) is the last closed candle: the signal is reliable and does not change. Value 0 is the current forming candle: the signal comes earlier but may change before the candle closes.
- Show trend panel — shows or hides the information panel.
- Panel corner — the chart corner where the panel is placed. Default is lower left; upper left, upper right and lower right are also available.
Information panel
The panel is compact, scales with the chart window size and always stays in the selected corner.
- Title "Pythagorean" — the indicator name.
- Arrow and the "Trend" label — the overall (global) trend over the period set by "Calculation of the global trend". A green up arrow and UP mean the upward direction prevails. A red down arrow and DOWN mean the downward direction prevails. A gray right arrow and FLAT mean there is no clear advantage.
- "-" / "+" button — collapses the panel so that it does not get in the way. When collapsed, only the global trend arrow remains. The choice is remembered when the timeframe is changed.
The panel lets you see the overall picture at a glance and compare it with the current dot color: signals in the direction of the global trend are usually more reliable, while signals against it call for more caution.