RelicusRoad Scalping Pivots MT4

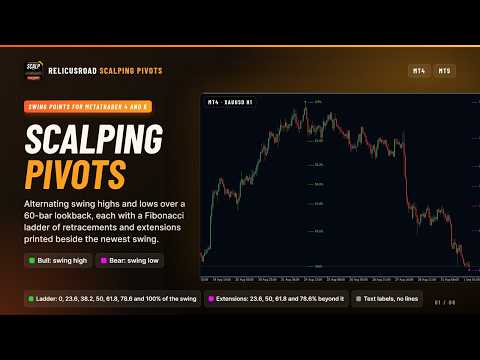
RelicusRoad Scalping Pivots is a swing point and Fibonacci level indicator for MetaTrader 4 and MetaTrader 5 that marks alternating swing highs and lows over a 60-bar lookback and labels Fibonacci retracements and extensions of the latest swing.

The pivots in the name are these swing points, not classic floor pivot points such as PP, R1 and S1. Next to the newest swing, the indicator prints a column of percentage labels so you can read retracement and extension levels without drawing a Fibonacci tool by hand.

How it works

A bar is marked as a swing high when its high is the highest high of the last Range bars, counting the bar itself. Swing lows are found the same way. The test only looks back, so a bar is marked as soon as it is the extreme so far. A second pass keeps only the most extreme high of each up-leg and the most extreme low of each down-leg, so the marks alternate. The two sides are named as follows:

  • Bull: a swing high that formed after the paired swing low, drawn as a lime green dot.
  • Bear: a swing low that formed after the paired swing high, drawn as a magenta dot.

Note the naming: in this indicator Bull marks swing highs and Bear marks swing lows, which is the opposite of how many traders use the words. A Bull ladder measures an up-leg from its low to its high, and a Bear ladder measures a down-leg from its high to its low.

What it draws

  • Bull dots: small lime green dots at the exact high of each swing high bar.
  • Bear dots: small magenta dots at the exact low of each swing low bar.
  • Bull ladder: 0.0% at the swing high, retracements of 23.6, 38.2, 50.0, 61.8 and 78.6% stepping down, and 100% at the swing low.
  • Bull extensions: 23.6, 50.0, 61.8 and 78.6% of the swing, placed above the high.
  • Bear ladder and extensions: the mirror layout, anchored at the swing low, with extensions below it.
  • Label style: each level is a short dash followed by its percentage, starting two bars to the right of the swing.

Reading the chart

The ladder is made of text labels only. There are no horizontal lines across the chart, so the levels stay compact next to the swing they belong to. Each label shows its percentage as a tooltip when you hover over it.

Only the latest Bull ladder and the latest Bear ladder are kept. Both can be on the chart at the same time, each moving to its newest swing rather than leaving copies behind. Because 23.6% and the other extension values also appear as retracements, read each label by whether it sits beyond the swing or inside it.

The dots and ladders are not fixed. A dot can be removed when price goes further in the same direction, and the ladder then moves to the new extreme.

Inputs

Swing detection:

  • Range: the lookback length for a swing, 60 bars by default.
  • History: how many recent bars are calculated, 500 by default.
  • Show Bull: the swing high dots and the Bull ladder.
  • Show Bear: the swing low dots and the Bear ladder.

Colors and labels:

  • Bull Color: lime green by default, used for the Bull dots and ladder.
  • Bear Color: magenta by default, used for the Bear dots and ladder.
  • Bull Size: font size of the Bull ladder labels, 8 by default.
  • Bear Size: font size of the Bear ladder labels, 8 by default.
  • Font Name: one shared font for both ladders, Arial Bold by default.

Recommended use

Built for forex, gold (XAUUSD) and indices, from M1 to M15 for scalping and up to W1 for slower swings. It does not draw on monthly charts. Keep Range well below History: when Range is larger than the bars available, the indicator shortens it in steps of 20 bars. The dot width is fixed, so the Size inputs change only the label text.

Common questions

Are these daily pivot points? No. They are swing highs and swing lows found over a rolling lookback, with Fibonacci labels measured from the latest swing.

Do the dots repaint? Yes. A dot appears as soon as a bar is the extreme of its lookback and is removed if a more extreme bar on the same side follows before the opposite swing forms. The last 65 bars are checked again on every new bar.

Why does Bull mark the highs? In this tool Bull names the up-leg, and an up-leg ends at its swing high, which is where the Bull ladder is anchored.

Does it work on the monthly chart? No. It stays empty on MN1.

The swing dots are placed without waiting for later bars and can be removed when price extends further, so the most recent dot and its ladder may still move.

About and support

Scalp pivot detection is the short-term swing and Fibonacci tool inside RelicusRoad Pro, released alone for traders who work one timeframe at a time. It runs standalone and needs no other RelicusRoad product.

Questions and support are handled in the product comments and through the mql5.com messaging system.
Recommended products
This is an arrow indicator without a future function,developed based on the most advanced profit trading algorithms.It has the most innovative and advanced dual trend analysis module, as well as the latest and highly effective market trend prediction algorithm.Trends are your friends, and following larger trends can earn the maximum profit in foreign exchange. This indicator helps traders identify current trends and track them. Someone once made a profit of 10 times in a week by relying on it.No
Gold Phoenix
Yaroslav Varankin
The perfect tool for Scalng in the Forex markets You can trade both from signal to signal and using take profit  The algorithm does not use Zigzag!  No redrawing!  This is a channel instrument that uses a moving average as a filter. Moving Average  There are 2 parameters for the settings Ma Period = 5 period Moving Average  Channel 1.0 distance of channel lines from the chart Price Signal Filter - calculation of signal opening and filter There is a complete set of Alert There is a multi-timefram
Happy Scalping Indicator
Leandro Bernardez Camero
This indicator was designed for aggressive scalping and quick entries in binary options , generating signals on every candle , so you can know exactly what is happening at all times. Join the Happy Scalping channel: MQL5 It does not repaint : the current candle's signal is generated in REAL TIME , which means it may change while the candle is still forming, depending on whether the price rises or falls compared to the previous candle's close. But once the candle closes , the signal color becom
Auto Fibo Pro m
DMITRII GRIDASOV
"Auto FIBO Pro"   Crypto_Forex  indicator  - is great auxiliary tool in trading! Indicator automatically calculate and place on chart Fibo levels and local trend lines (red color). Fibonacci levels indicate key areas where price can reverse. Most important levels are 23.6%, 38.2%, 50% and 61.8%. You can use it   for reversal scalping  or for zone grid trading. There are plenty of opportunities to  improve your current system using Auto FIBO Pro indicator as well. It has Info Spread Swap Displa
MasterDot
Andrey Kozak
Master Dot for MetaTrader 4 Detect Volatility Exhaustion Before the Market Returns to Balance Master Dot is a professional non-repainting indicator designed to detect moments when price moves beyond its statistically expected volatility range. These situations often occur during sharp market impulses, liquidity grabs or temporary emotional moves, when price departs from its normal trading conditions. Instead of following trends, Master Dot highlights volatility exhaustion — moments where the mar
Daily Candle Predictor is an indicator that predicts the closing price of a candle. The indicator is primarily intended for use on D1 charts. This indicator is suitable for both traditional forex trading and binary options trading. The indicator can be used as a standalone trading system, or it can act as an addition to your existing trading system. This indicator analyzes the current candle, calculating certain strength factors inside the body of the candle itself, as well as the parameters of

Automatically plots Fibo levels, based on the High & Low prices from the specified time frame Multiple bars may be united: e.g. you can get a Fibo based on the 10-days Highs and Lows My   #1 Utility : 65+ features, including this indicator  |   Contact me  for any questions  |  MT5 version Helps to see potential reversal levels; Patterns formed at the Fibo levels tend to be stronger; Significantly reduces the time spent on manual  plotting ; Settings: Timeframe to calculate the base High & Low p
RelicusRoad Daily Pivots is a daily pivot points indicator for MetaTrader 4 and MetaTrader 5 that divides the previous day's range into Fibonacci levels and extends them above and below it, from minus 100 to plus 200 percent. Instead of classic floor pivots, the previous completed range is treated as a scale where the low is 0% and the high is 100%. Nineteen levels are printed as compact colored markers at the right edge of the chart, so the size of today's move reads as a fraction or a multiple
Pro Magic Signal   indicator is designed for signal trading. This indicator generates trend signals.  It uses many algorithms and indicators to generate this signal. It tries to generate a signal from the points with the highest trend potential. This indicator is a complete trading product. This indicator does not need any additional indicators.  The indicator certainly does not repaint. The point at which the signal is given does not change.  Thanks to the alert features you can get the signals
Embark on the pinnacle of Binary Options evolution. Our indicator isn't just adaptive—it's relentless. Picture a ninja riding a serpent, shadowing its every move; that's how this tool trails the market trend, unwavering till the end. Built upon the foundational prowess of the Ichimoku indicator and honed with an array of fine-tuned oscillators, it epitomizes accuracy and precision. Dive deep without getting lost in the Ichimoku's intricacies—our indicator simplifies the process for you. Perhaps
Super Reversal Pattern
Parfait Mujinga Ndalika
Super Reversal Pattern Indicator Unlock the power of advanced pattern recognition with our Super Reversal Pattern Indicator. Designed for traders seeking precision and reliability, this indicator identifies one of the most effective reversal patterns in technical analysis, offering a significant edge in your trading strategy. Key Features: Non-Repainting Accuracy: Enjoy the confidence of non-repainting technology. Once a Super Reversal Pattern is detected, it remains static, providing consiste
PZ Harmonacci Patterns
PZ TRADING SLU
3.17 (6)
Trade smarter, not harder: Empower your trading with Harmonacci Patterns This is arguably the most complete harmonic price formation auto-recognition indicator you can find for the MetaTrader Platform. It detects 19 different patterns, takes fibonacci projections as seriously as you do, displays the Potential Reversal Zone (PRZ) and finds suitable stop-loss and take-profit levels. [ Installation Guide | Update Guide | Troubleshooting | FAQ | All Products  ] It detects 19 different harmonic pric
Price Magnet — Price Density and Attraction Levels Indicator Price Magnet is a professional analytical tool designed to identify key support and resistance levels based on statistical Price Density. The indicator analyzes a specified historical period and detects price levels where the market spent the most time. These zones act as “magnets,” attracting price action or forming a structural base for potential reversals. Unlike traditional Volume Profile tools, Price Magnet focuses on price-time d
Trend Bilio - an arrow indicator without redrawing shows potential market entry points in the form of arrows of the corresponding color: upward red arrows suggest opening a buy, green down arrows - selling. The entrance is supposed to be at the next bar after the pointer. The arrow indicator Trend Bilio visually "unloads" the price chart and saves time for analysis: no signal - no deal, if an opposite signal appears, then the current deal should be closed. It is Trend Bilio that is considered
Line Magnit
Aleksey Trenin
The LineMagnit Indicator for MT4 is a highly precise tool that builds support and resistance levels which magnetically attract prices. This feature allows traders to easily determine the most probable entry and exit points in the market, as well as identify the market's directional forces, as levels are based on capital inflows into the instrument. Equipped with an intuitively understandable graphical interface, the LineMagnit Indicator enables users to quickly locate and analyze support and res
Quantum Balance
Adolfina Denysenko
Quantum Balance is a modern arrow indicator that identifies key price reversal points in the market with high accuracy. It is based on a combination of WPR (Williams %R) and RSI (Relative Strength Index), which allows you to identify overbought/oversold moments and enter trades at points of maximum potential. The indicator analyzes price dynamics and market conditions, generating signals only when several confirming factors coincide. This reduces the number of false signals and increases tradin
The   True Magic Oscillator   indicator is designed for signal trading. This indicator generates trend signals. It uses many algorithms and indicators to generate this signal. It tries to generate signals from the points with the highest trend potential. This indicator is a complete trading product. This indicator does not need any additional indicators. The indicator is never repainted. The point at which the signal is given does not change.         Features and Recommendations Works wit
EARLY REMINDER: The Starting price is 65 price will rise soon up to 365$ and then 750$ after first 10 copies of sales. Grab this offer now! Introduction Hello, traders! Welcome to the demonstration of the Forex Beast Indicator , a comprehensive tool designed to assist aspiring traders in navigating the complexities of the forex market. This indicator incorporates seven essential components to provide a well-rounded trading experience: Moving Averages Colored Zones Support and Resistance Levels
This is a new strategy for SUPPLY DEMAND areas It is based on a calculation using the tick volume to detect the big price action in market for both bear /bull actions this smart volume action candles are used to determine the supply and demand areas prices in between main supply and demand lines indicate sideway market  up arrows will be shown when prices moves above the main supply and the secondary supply lines Down arrows will be shown when prices moves below the main demand and the secondary
The Th3Eng PipFinite indicator is based on a very excellent analysis of the right trend direction with perfect custom algorithms. It show the true direction and the best point to start trading. With StopLoss point and Three Take Profit points. Also it show the right pivot of the price and small points to order to replace the dynamic support and resistance channel, Which surrounds the price. And Finally it draws a very helpful Box on the left side on the chart includes (take profits and Stop loss
Ultimate Supply Demand
Ramon Sobrevals Arce
5 (3)
After working during many months, with the help of Neural Networks, we have perfected the ultimate tool you are going to need for identifying key price levels (Supports and Resistances) and Supply and Demand zones. Perfectly suitable to trigger your trades, set up your future actions, decide your Take Profit and Stop Loss levels, and confirm the market direction. Price will always move between those levels, bouncing or breaking; from one zone to another, all the remaining movements are just mark
Chart Patterns Detect 15 patterns (Ascending Triangle, Descending Triangle, Rising Wedge, Falling Wedge, Bullish Flag, Bearish Flag, Bullish Rectangle, Bearish Rectangle Symmetrical triangle, Head and Shoulders, Inverted Head and Shoulders, Triple top, Triple Bottom, Double Top, Double Bottom) Use historical data to calculate the probability of each pattern to succeed (possibility to filter notification according to the chance of success) gives graphic indication about the invalidation level and
Introduction One of the patterns in "RTM" is the "QM" pattern, also known as "Quasimodo". Its name is derived from the appearance of "Hunchback of Notre-Dame" from Victor Hugo's novel. It is a type of "Head and Shoulders" pattern.   Formation Method   Upward Trend In an upward trend, the left shoulder is formed, and the price creates a new peak higher than the left shoulder peak . After a decline, it manages to break the previous low and move upward again. We expect the price to
PZ Divergence Trading
PZ TRADING SLU
5 (2)
Unlock hidden profits: accurate divergence trading for all markets Tricky to find and scarce in frequency, divergences are one of the most reliable trading scenarios. This indicator finds and scans for regular and hidden divergences automatically using your favourite oscillator. [ Installation Guide | Update Guide | Troubleshooting | FAQ | All Products ] Easy to trade Finds regular and hidden divergences Supports many well known oscillators Implements trading signals based on breakouts Display
Binary Options Support Resistance Indicator This indicator is designed for binary options trading and effectively shows retracements from support and resistance levels. Signals appear on the current candle. A red arrow pointing downwards indicates a potential selling opportunity, while a blue arrow pointing upwards suggests buying opportunities. All that needs adjustment is the color of the signal arrows. It is recommended to use it on the M1-M5 timeframes as signals are frequent on these timef
"Impulses and Corrections 4" is created to help traders navigate the market situation. The indicator shows multi-time frame upward and downward "Impulses" of price movements. These impulses are the basis for determining the "Base" , which is composed of zones of corrections of price movements, as well as "Potential" zones for possible scenarios of price movement. Up and down impulses are determined based on a modified formula of Bill Williams' "Fractals" indicator. The last impulse is always "U
Fibonacci retracement and extension line drawing tool Fibonacci retracement and extended line drawing tool for MT4 platform is suitable for traders who use  golden section trading Advantages: There is no extra line, no too long line, and it is easy to observe and find trading opportunities Trial version: https://www.mql5.com/zh/market/product/35884 Main functions: 1. Multiple groups of Fibonacci turns can be drawn directly, and the relationship between important turning points can be seen
PZ ABCD Retracement
PZ TRADING SLU
4 (5)
Identify precise entry and exit points with AB=CD patterns This indicator finds AB=CD retracement patterns. The AB=CD Retracement pattern is a 4-point price structure where the initial price segment is partially retraced and followed by an equidistant move from the completion of the pullback, and is the basic foundation for all harmonic patterns. [ Installation Guide | Update Guide | Troubleshooting | FAQ | All Products   ] Customizable pattern sizes Customizable AC and BD ratios Customizable b
The indicator places Semaphore points on the maximum and minimum of a higher, medium and lower period. It includes A,B,C Triangles for easier spotting of reversal chart pattern which occurs very frequently and has a very high success ratio. Both Semaphore and A,B,C Triangles have Alerts and Push notifications to a mobile device when they occur on the chart. These indicators are very useful for breakout trading and spotting support/resistance levels which gives good opportunities for positions.
Night ghost
Dmitriy Kashevich
Night Ghost - Arrow indicator for binary options. This is a reliable assistant to you in the future! - No redrawing on the chart -Works great on EUR/USD currency pairs! -Indicator accuracy up to 90% (Especially at night) -No long setup required (Perfectly set up for Binary Options) - Not late signals - The appearance of a signal on the current candle -Perfect for M1 period (No More!) - Eye-friendly candle color (Red and Blue) -Installed Alert Working with it: - Blue arrow shows signa
Buyers of this product also purchase
SR Liquidity
Oleg Rodin
5 (2)
SR Liquidity is a trading indicator designed to reveal the hidden zones where market liquidity concentrates and price reacts most strongly. These special liquidity areas act as powerful support and resistance levels, giving you a clear map of where the market is most likely to reverse. Instead of drawing ordinary Support/Resistance lines, SR Liquidity analyzes real price behavior to detect the zones where buying and selling pressure accumulate. These are actually the pools of liquidity that driv
Trend SniperX MT4
Sarvarbek Abduvoxobov
5 (2)
Trend Sniper X is a multi-timeframe trend-following indicator for MetaTrader 5 that helps traders identify trend direction and potential reversal points with clarity and precision. For MT5: https://www.mql5.com/en/market/product/181101 Price Information: The current price is promotional and is subject to change as upcoming updates and new features are released. Code2Profit Channel Master the Market with Multi-Timeframe Analysis! How to Maximize Your Win Rate with Trend Sniper X: Key Rules & Sess
M1 Sniper
Oleg Rodin
4.97 (29)
M1 SNIPER  is an easy to use trading indicator system. It is an arrow indicator which is designed for M1 time frame. The indicator can be used as a standalone system for scalping on M1 time frame and it can be used as a part of your existing trading system. Though this trading system was designed specifically for trading on M1, it still can be used with other time frames too. Originally I designed this method for trading XAUUSD and BTCUSD. But I find this method helpful in trading other markets

Neuro Poseidon MT4
Daria Rezueva
4.74 (46)
Neuro Poseidon is a new indicator by Daria Rezueva. It combines precise trading signals with adaptive TP/SL levels - creating best possible trades as a result! Message me and get  Neuro Poseidon Assistant  as a gift to automize your trading process! What makes it stand out? 1. Proven profitability on all assets and timeframes 2. Only confirmed BUY and SELL signals present on the chart 3. Adaptive TP & SL levels generated by the software for each trade 4. Easy to understand - suitable for all
Trading Special – 30% OFF Best Solution for any Newbie or Expert Trader! This dashboard software is working on 28 currency pairs plus one. It is based on 2 of our main indicators (Advanced Currency Strength 28 and Advanced Currency Impulse). It gives a great overview of the entire Forex market plus Gold or 1 indices. It shows Advanced Currency Strength values, currency speed of movement and signals for 28 Forex pairs in all (9) timeframes. Imagine how your trading will improve when you can watch
DayTrader PRO MT4
Davit Beridze
4.5 (8)
DayTrader PRO (Buy DayTrader PRO and Get another Paid Self Optimizing indicator for Free as Bonus) MT5:  https://www.mql5.com/en/market/product/186222 DayTrader PRO   is an advanced trading indicator that combines John Ehlers' Laguerre Filter with a powerful Auto-Optimization Engine. Instead of using fixed parameters, the indicator automatically searches for the best settings based on recent market conditions, helping you adapt to changing volatility without constant manual adjustments. The in
Currency Strength Wizard is a very powerful indicator that provides you with all-in-one solution for successful trading. The indicator calculates the power of this or that forex pair using the data of all currencies on multiple time frames. This data is represented in a form of easy to use currency index and currency power lines which you can use to see the power of this or that currency. All you need is attach the indicator to the chart you want to trade and the indicator will show you real str
PZ Trend Trading
PZ TRADING SLU
4.8 (5)
Capture every opportunity: your go-to indicator for profitable trend trading Trend Trading is an indicator designed to profit as much as possible from trends taking place in the market, by timing pullbacks and breakouts. It finds trading opportunities by analyzing what the price is doing during established trends. [ Installation Guide | Update Guide | Troubleshooting | FAQ | All Products ] Trade financial markets with confidence and efficiency Profit from established trends without getting whips
This product was   updated   for the   2026 market   and   optimized   for the   latest MT5 builds . PRICE UPDATE NOTICE: Smart Trend Trading System   is currently available for $99. The price will   increase to $199   after the next   30 purchases. SPECIAL OFFER:  After purchasing Smart Trend Trading System, send me a private message to claim the Smart Universal EA for FREE and turn your Smart Trend signals into automated trades. Smart Trend Trading System is a complete non-repainting, non-re
Currency Strength Exotics
Bernhard Schweigert
4.88 (33)
CURRENTLY 20% OFF ! Best Solution for any Newbie or Expert Trader! This Indicator is specialized to show currency strength for any symbols like Exotic Pairs Commodities, Indexes or Futures. Is first of its kind, any symbol can be added to the 9th line to show true currency strength of Gold, Silver, Oil, DAX, US30, MXN, TRY, CNH etc. This is a unique, high quality and affordable trading tool because we have incorporated a number of proprietary features and a new formula. Imagine how your trading
All in One Trade
Alexey Minkov
4.52 (29)
All-in-One Trade Indicator (AOTI) automatically calculates daily target levels for 14 currency pairs and brings together technical analysis tools for any trading instrument in a single window: Double Channel for trend detection, Price Channel, MA Bands, Climax Bars detector, Fibonacci levels, support/resistance micro-levels, and arrow reversal signals. Works on the MetaTrader 4 platform. Daily levels are calculated for EURUSD, EURJPY, GBPUSD, USDCHF, EURGBP, EURCAD, EURAUD, AUDJPY, GBPAUD, GBPCA
Gann Made Easy
Oleg Rodin
4.84 (172)
Gann Made Easy is a professional and easy to use Forex trading system which is based on the best principles of trading using the theory of W.D. Gann. The indicator provides accurate BUY and SELL signals including Stop Loss and Take Profit levels. You can trade even on the go using PUSH notifications. PLEASE CONTACT ME AFTER PURCHASE TO GET TRADING  INSTRUCTIONS   AND GREAT EXTRA INDICATORS  FOR FREE! Probably you already heard about the Gann trading methods before. Usually the Gann theory is a
Neo Wave PRO
Nikolay Raykov
5 (1)
Price & Time Market Structure Indicator A professional market structure tool that analyzes waves through both price and time — not price alone. Main Description NeoWave PRO is a professional market structure indicator for MetaTrader 4 designed for traders who want to move beyond traditional one-dimensional wave tools such as ZigZag, swing indicators, and basic high/low systems. Most wave indicators analyze only one thing: Price. But a real market wave is not only a price movement. A true wave de
CRT Candle Range Theory HTF MT4.   Ultimate CRT Indicator: Advanced ICT Concepts and Malaysian SnR Trading System Master the Market Maker's Footprints with the Most Advanced Candle Range Theory Indicator Unlock the true power of  Smart Money Concepts (SMC)  and trade precisely like the institutions with the  Ultimate CRT Indicator . Built exclusively for serious traders, this indicator automates the highly effective  Candle Range Theory (CRT) , a core pillar of  ICT Concepts (Inner Circle Trader
PRO Renko System
Oleg Rodin
5 (31)
PRO Renko System is a highly accurate trading system specially designed for trading RENKO charts. The ARROWS and Trend Indicators DO NOT REPAINT! The system effectively neutralizes so called market noise giving you access to accurate reversal signals. The indicator is very easy to use and has only one parameter responsible for signal generation. You can easily adapt the tool to any trading instrument of your choice and the size of the renko bar. I am always ready to provide extra support to help
PZ Turning Points MT4
PZ TRADING SLU
1 (1)
Identify key turning points with reliable fractal analysis This indicator examines the price structure of fractals of different periods to determine possible reversal points in the market, providing timing to positional traders that already have a fundamental or technical valuation model. Unlike its younger brother, Reversal Fractals , this indicator won't miss reversals because of the period selected, and will find reversal fractals on a zig-zag fashion, ignoring those reversals which do not
Reversal Master
Alexey Minkov
4.81 (16)
Reversal Master helps you read the current direction of price movement and spot potential reversal points on the chart. It is built for traders who want a clearer view of the market situation before making a decision. You can use it as a standalone tool, as an add-on to a ready-made trading system, or as a building block for developing your own strategies. To locate reversal points, Reversal Master evaluates several market conditions at once, since combined analysis gives a more complete picture
RFI levels PRO
Roman Podpora
5 (1)
RFI LEVELS PRO identifies reversal structures and key price-return zones where major market participants may become active. The indicator helps you detect the formation of a new trend, identify potential entry points, and control risk and profit levels in advance. VERSION MT5   —   The indicator reaches its full potential when used together with TREND LINES PRO . What the indicator shows: Reversal structures and levels activated at the beginning of a new trend. Potential entry points in the dire
Oversold and Overbought Candles, Trendlines, and BUY-SELL arrows in the single Indicator. Built from 8 default MT4 Indicators. Stochastic,RSI,SAR,CCI,RVI,DeMarker,WPR and MA. It is " NON REPAINT " indicator. All buffers do not repaint.  Double Trendline buffers that can also be used to identify sideway market and support resistance area.  Any timeframes and any currency pairs. Parameters: Show Trend . TRUE/FALSE to show trendlines on the chart Follow Trend. If TRUE , Dapitrend will show only
Volume Break Oscillator is an indicator that matches price movement with volume trends in the form of an oscillator. I wanted to integrate volume analysis into my strategies but I have always been disappointed by most volume indicators, such as OBV, Money Flow Index, A/D but also as Volume Weighted Macd and many others. I therefore wrote this indicator for myself, I am satisfied with how useful it is, and therefore I decided to publish it on the market. Main features: It highlights the phase
Monitor every symbol and every timeframe with your favourite indicators from a single chart. The Ultimate Indicator Dashboard gives you a complete multi-symbol, multi-indicator, multi-timeframe view — all in one clean, draggable panel. Stop flipping between charts. See RSI, MACD, Bollinger Bands, Ichimoku, ATR, volume, and more across all your instruments at a glance. Colour-coded signals show you exactly where the opportunities are, and smart alerts tell you when conditions change — so you neve
Advanced Supply Demand
Bernhard Schweigert
4.91 (302)
Trading Special – 30% OFF Best Solution for any Newbie or Expert Trader! This indicator is a unique, high quality and affordable trading tool because we have incorporated a number of proprietary features and a new formula. With this update, you will be able to show double timeframe zones. You will not only be able to show a higher TF but to show both, the chart TF, PLUS the higher TF: SHOWING NESTED ZONES. All Supply Demand traders will love it. :) Important Information Revealed Maximize the pot
Official BlueDigitsFx Ecosystem Access Get infrastructure updates, workflow resources, product releases, and ecosystem access through the official BlueDigitsFx ecosystem. Telegram Ecosystem Website MT5 Version BlueDigitsFx Easy 123 System — Powerful Reversal and Breakout Detection for MT4 All-In-One Non-Repaint System for Spotting Market Reversals and Breakouts – Built for traders who value structure, clarity, and confirmation-based trading workflows. The BlueDigitsFx Easy 123 System is a vis
M1 Arrow Scalping - shows signals on the M1 period, does not redraw entry points and can work on all major currency pairs + metals (gold/silver). The indicator analyzes the market using algorithms for determining price patterns and shows the trader the price reversal points on the chart. The red dot shows that the price will turn down and the blue dot shows that the price will turn up. The indicator also sends signals to the phone in the form of PUSH notifications. Therefore, you do not need to
Storm Prices
Andriy Sydoruk
The Storm Prices indicator is trendy, arrow family. It is easy to work and understand when the first red arrow appears, you need to buy, when the first blue arrow appears, sell. The indicator is used for scalping and pipsing. The indicator makes calculations based on several technical indicators. Determines the direction of the trend and gives a fairly clear indication of the position. The indicator allows you to determine the opportunities for entering the market for a short time. There is a sw
TPSproTREND PrO
Roman Podpora
4.67 (27)
TPSproTrend PRO   - This is a trend indicator that automatically analyzes the market and provides information about the trend and its changes, as well as displays entry points for trades   without redrawing!     New version   Trend Lines PRO   — improved entry point detection algorithm, additional signal filtering and updated visualization. INSTRUCTIONS RUS      -    NSTRUCTIONS   ENG      -    MT5 VERSION Key Benefits Signals without redrawing.   All signals are fixed. If the arrow appears -  
KURAMA GOLD SIGNAL PRO (MT4) — 7-Layer Filter, Auto TP/SL, Quality Score & Signal History Save | Complete XAUUSD Trading System No repaint in real time. The moment a signal appears, the arrow, entry, TP and SL are locked on the spot and never move afterward. What you trade is this real-time signal. And in v7.20, every signal that is actually sent is auto-saved and restored exactly after restart. BUYER BONUS Buy the lifetime license and receive AI Zone Radar (
Prop Firm Sniper
Mohamed Hassan
4.33 (6)
Prop Firm Sniper MT4  is a professional market structure indicator that automatically identifies high-probability BUY and SELL opportunities using BOS and CHoCH analysis. Recommended Timeframes: For backtesting, use the indicator on   M5 or M15   for Gold (XAUUSD), and   M15 or H1   for more volatile Forex pairs such as   GBPUSD, USDJPY, EURGBP , and similar markets. CONTACT ME AFTER PURCHASE TO CLAIM YOUR FREE BONUSES! Prop Firm Sniper  is a professional market structure indicator designed t
Dynamic Forex28 Navigator
Bernhard Schweigert
4.43 (7)
Specials Discount now. The Next Generation Forex Trading Tool. Dynamic Forex28 Navigator is the evolution of our long-time, popular indicators, combining the power of three into one: Advanced Currency Strength28 Indicator (695 reviews) + Advanced Currency IMPULSE with ALERT (520 reviews) + CS28 Combo Signals (recent Bonus) Details about the indicator  https://www.mql5.com/en/blogs/post/758844 What Does The Next-Generation Strength Indicator Offer? Everything you loved about the originals, now
Legacy of Gann
Pavel Zamoshnikov
4.83 (12)
The indicator very accurately determines the levels of the possible end of the trend and profit fixing. The method of determining levels is based on the ideas of W.D.Gann, using an algorithm developed by his follower Kirill Borovsky. Extremely high reliability of reaching levels (according to K. Borovsky  - 80-90%) Indispensable for any trading strategy – every trader needs to determine the exit point from the market! Precisely determines targets on any timeframes and any instruments (forex, met
More from author
The Moving Average Convergence Divergence (MACD) trading strategy is a popular technical analysis tool that is used to identify changes in momentum and trend direction. The MACD is calculated by subtracting the 26-period exponential moving average (EMA) from the 12-period EMA. A 9-period EMA, called the "signal line," is then plotted on top of the MACD to act as a trigger for buy and sell signals. The MACD is considered to be in bullish territory when the MACD line is above the signal line and
FREE
RelicusRoad Pro MT5
Relicus LLC
4.96 (24)
RelicusRoad Pro: Quantitative Market Operating System 70% OFF LIFETIME ACCESS (LIMITED TIME) - JOIN 2,000+ TRADERS Why do most traders fail even with "perfect" indicators? Because they trade Single Concepts in a vacuum. A signal without context is a gamble. To win consistently, you need CONFLUENCE . RelicusRoad Pro is not a simple arrow indicator. It is a complete Quantitative Market Ecosystem . It maps the "Fair Value Road" price travels on, distinguishing between random noise and true structur
RelicusRoad Pro
Relicus LLC
4.65 (107)
RelicusRoad Pro: Quantitative Market Operating System 70% OFF LIFETIME ACCESS (LIMITED TIME) - JOIN 2,000+ TRADERS Why do most traders fail even with "perfect" indicators? Because they trade Single Concepts in a vacuum. A signal without context is a gamble. To win consistently, you need CONFLUENCE . RelicusRoad Pro is not a simple arrow indicator. It is a complete Quantitative Market Ecosystem . It maps the "Fair Value Road" price travels on, distinguishing between random noise and true structur
RelicusRoad MACD v2
Relicus LLC
4.6 (5)
The Moving Average Convergence Divergence (MACD) trading strategy is a popular technical analysis tool that is used to identify changes in momentum and trend direction. The MACD is calculated by subtracting the 26-period exponential moving average (EMA) from the 12-period EMA. A 9-period EMA, called the "signal line," is then plotted on top of the MACD to act as a trigger for buy and sell signals. The MACD is considered to be in bullish territory when the MACD line is above the signal line and
FREE
RelicusRoad CopyTrader is a free trade copier for MetaTrader 4 . It copies trades between MT4 terminals on the same computer, so you can trade one account and have the others follow it, each at its own size and risk. Full version, no limitations, no trial period. Trade one account. Let the rest follow. How it works One terminal runs as the Leader (master) and shares the orders it holds. Any number of terminals run as Followers (slaves) and mirror them. Terminals are paired by a Channel name, so

FREE
RelicusRoad Support Resistance is a support and resistance indicator for MetaTrader 4 and MetaTrader 5 that builds supply and demand zones from fractal swings and grades each one by its strength and recent tests. It keeps a short map of zones above and below price, each labeled with its grade, width and recent test count. How it works Swing highs and lows are collected into price zones rather than single lines. A swing is a bar whose high or low is not exceeded by the 7 bars on either side, and
RelicusRoad Signal Line is a trend filter indicator for MetaTrader 4 and MetaTrader 5 that draws two moving average lines and colors each bar of them green, salmon or gray from a strategy filter you choose. The line shows where the average is. The color shows what the chosen filter says about that bar. By default Line 1 is a fast KAMA 9 colored by momentum and Line 2 is a slow Hull moving average 200 colored by Ichimoku. How it works Each line is calculated from closing prices with the average t
RelicusRoad Action Levels is a support and resistance levels indicator for MetaTrader 4 and MetaTrader 5 that fits a grid of major and minor price levels to the symbol's own volatility and past reactions, and labels each level with its touch count. The grid is not a fixed pip spacing and not a plain round-number grid. Its spacing and offset are chosen from completed bars, each level is scored on how price behaved around it, and only the strongest levels near the current price are drawn. How it w
RelicusRoad Daily High Low is a previous day high and low indicator for MetaTrader 4 and MetaTrader 5 that marks yesterday's high and low and today's open on every bar of an intraday chart. The three levels are drawn as colored dot series that step to new values when a new period starts, with small High, Low and Open tags at the end of each period. On charts from H1 to H4 the same markers show last week's range and this week's open instead, and on D1 they show the monthly equivalents. How it wor
RelicusRoad Daily Pivots is a daily pivot points indicator for MetaTrader 4 and MetaTrader 5 that divides the previous day's range into Fibonacci levels and extends them above and below it, from minus 100 to plus 200 percent. Instead of classic floor pivots, the previous completed range is treated as a scale where the low is 0% and the high is 100%. Nineteen levels are printed as compact colored markers at the right edge of the chart, so the size of today's move reads as a fraction or a multiple
RelicusRoad Dynamic Circles is a swing high and swing low indicator for MetaTrader 4 and MetaTrader 5 that marks turning points with circles at three lookback lengths at once: 9, 60 and 156 bars. Small turns and large turns sit on the same chart but look different. A short range dot shows a minor swing, while the larger medium and long range rings only appear where price made the extreme of a much longer window. Each circle can carry a short text label such as HH(60) or LL(156). How it works For
RelicusRoad Fractals is a fractal indicator for MetaTrader 4 and MetaTrader 5 that marks swing highs and swing lows at two strengths, a Fast test of 7 bars on each side and a Slow test of 15 bars on each side. A 7-bar window on each side already filters out many small wiggles, and the Slow test asks for more than twice that, so its thicker arrows pick out the swings that held over a much wider stretch of the chart. Both strengths are shown together, so minor and larger swings can be told apart a
RelicusRoad Multi Timeframe Trendbar is a multi-timeframe trend indicator for MetaTrader 4 and MetaTrader 5 that shows an Uptrend, Neutral or Downtrend state for nine timeframes, M1 to MN1, as a row of colored dots in the chart corner. Each timeframe gets one dot with its name above it, in the lower-right corner of the chart. The color tells you the state, so you can see which timeframes agree without switching charts. How it works For each timeframe, the indicator compares two standard tools on
RelicusRoad SuperTrend is a SuperTrend indicator for MetaTrader 4 and MetaTrader 5 that plots an ATR-based trailing line below price in an uptrend and above price in a downtrend. It is the classic SuperTrend calculation with nothing layered on top: one line for the up side, one for the down side, and no arrows, labels or panels. How it works For every bar the indicator takes the median price, the midpoint of the bar's high and low, and sets a band a chosen number of Average True Range (ATR) unit
RelicusRoad Trading Sessions is a trading sessions indicator for MetaTrader 4 and MetaTrader 5 that marks the opening time of the Tokyo, London and New York sessions with dotted vertical lines on M1, M5 and M15 charts. Each session open is shown as a line, a small rotated name label and an event marker in the session's color, for the current day and the previous weekdays. Hovering over one shows the session name and its opening time. The indicator marks opens only: it does not shade session rang
RelicusRoad Trendlines is an automatic trendline indicator for MetaTrader 4 and MetaTrader 5 that fits trendline channels through confirmed swing pivots at three swing sizes and draws them as shaded zones. Short, medium and long swings each have their own color. The chart shows the two or three channels that score highest at the moment, plus a grey checkerboard box that maps a reference entry, stop and target for one selected rail. How it works A swing high or low is confirmed only when it is th
RelicusRoad Signal Cloud is a cloud indicator for MetaTrader 4 and MetaTrader 5 that projects a price band 21 bars ahead, sized by the gap between the 12 and 26 period EMAs. The band is centered on a 3-period EMA of close and smoothed so its edges move gradually. Because it is shifted forward, part of the cloud always sits to the right of the last bar, and price later arrives at the section that was drawn earlier. How it works For each bar the indicator measures the absolute gap between the 12 a
RelicusRoad Multi Timeframe Levels is a multi-timeframe support and resistance indicator for MetaTrader 4 and MetaTrader 5 that draws the latest swing high and swing low from H1, H4, D1, W1 and MN1 as horizontal lines on the chart you are trading. Each of those five timeframes contributes one resistance line and one support line, so an intraday chart carries up to ten lines. Every line is colored by the timeframe it came from, which keeps the higher-timeframe swings in view without switching cha
RelicusRoad Order Blocks is an order block indicator for MetaTrader 4 and MetaTrader 5 that finds displacement candles, marks the candle that started each move as a bullish or bearish order block, and tracks how far price has traded back into it. It is written for traders who work with smart money concepts (SMC). How it works A displacement candle is one whose body is at least 1.5 times the Average True Range (ATR) of the last 14 bars and at least 55 percent of its own high-to-low range. The ind
RelicusRoad Liquidity Levels is a liquidity level indicator for MetaTrader 4 and MetaTrader 5 that draws a weighted equilibrium line with volatility-based levels above and below it, seven lines in total for the Simple and Smooth channel types. Despite the name, the levels are volatility bands, not detected liquidity pools or stop clusters. The three levels above the center are called Sell levels and the three below are called Buy levels. On the chart they are labeled TP/SL-1 to TP/SL-3, with Saf
RelicusRoad Support Resistance is a support and resistance indicator for MetaTrader 4 and MetaTrader 5 that builds supply and demand zones from fractal swings and grades each one by its strength and recent tests. It keeps a short map of zones above and below price, each labeled with its grade, width and recent test count. How it works Swing highs and lows are collected into price zones rather than single lines. A swing is a bar whose high or low is not exceeded by the 7 bars on either side, and
RelicusRoad Signal Line is a trend filter indicator for MetaTrader 4 and MetaTrader 5 that draws two moving average lines and colors each bar of them green, salmon or gray from a strategy filter you choose. The line shows where the average is. The color shows what the chosen filter says about that bar. By default Line 1 is a fast KAMA 9 colored by momentum and Line 2 is a slow Hull moving average 200 colored by Ichimoku. How it works Each line is calculated from closing prices with the average t
RelicusRoad Action Levels is a support and resistance levels indicator for MetaTrader 4 and MetaTrader 5 that fits a grid of major and minor price levels to the symbol's own volatility and past reactions, and labels each level with its touch count. The grid is not a fixed pip spacing and not a plain round-number grid. Its spacing and offset are chosen from completed bars, each level is scored on how price behaved around it, and only the strongest levels near the current price are drawn. How it w
RelicusRoad Daily High Low is a previous day high and low indicator for MetaTrader 4 and MetaTrader 5 that marks yesterday's high and low and today's open on every bar of an intraday chart. The three levels are drawn as colored dot series that step to new values when a new period starts, with small High, Low and Open tags at the end of each period. On charts from H1 to H4 the same markers show last week's range and this week's open instead, and on D1 they show the monthly equivalents. How it wor
RelicusRoad Daily Pivots is a daily pivot points indicator for MetaTrader 4 and MetaTrader 5 that divides the previous day's range into Fibonacci levels and extends them above and below it, from minus 100 to plus 200 percent. Instead of classic floor pivots, the previous completed range is treated as a scale where the low is 0% and the high is 100%. Nineteen levels are printed as compact colored markers at the right edge of the chart, so the size of today's move reads as a fraction or a multiple
RelicusRoad Dynamic Circles is a swing high and swing low indicator for MetaTrader 4 and MetaTrader 5 that marks turning points with circles at three lookback lengths at once: 9, 60 and 156 bars. Small turns and large turns sit on the same chart but look different. A short range dot shows a minor swing, while the larger medium and long range rings only appear where price made the extreme of a much longer window. Each circle can carry a short text label such as HH(60) or LL(156). How it works For
RelicusRoad Fractals is a fractal indicator for MetaTrader 4 and MetaTrader 5 that marks swing highs and swing lows at two strengths, a Fast test of 7 bars on each side and a Slow test of 15 bars on each side. A 7-bar window on each side already filters out many small wiggles, and the Slow test asks for more than twice that, so its thicker arrows pick out the swings that held over a much wider stretch of the chart. Both strengths are shown together, so minor and larger swings can be told apart a
RelicusRoad Multi Timeframe Trendbar is a multi-timeframe trend indicator for MetaTrader 4 and MetaTrader 5 that shows an Uptrend, Neutral or Downtrend state for nine timeframes, M1 to MN1, as a row of colored dots in the chart corner. Each timeframe gets one dot with its name above it, in the lower-right corner of the chart. The color tells you the state, so you can see which timeframes agree without switching charts. How it works For each timeframe, the indicator compares two standard tools on
RelicusRoad Scalping Pivots is a swing point and Fibonacci level indicator for MetaTrader 4 and MetaTrader 5 that marks alternating swing highs and lows over a 60-bar lookback and labels Fibonacci retracements and extensions of the latest swing. The pivots in the name are these swing points, not classic floor pivot points such as PP, R1 and S1. Next to the newest swing, the indicator prints a column of percentage labels so you can read retracement and extension levels without drawing a Fibonacci
RelicusRoad SuperTrend is a SuperTrend indicator for MetaTrader 4 and MetaTrader 5 that plots an ATR-based trailing line below price in an uptrend and above price in a downtrend. It is the classic SuperTrend calculation with nothing layered on top: one line for the up side, one for the down side, and no arrows, labels or panels. How it works For every bar the indicator takes the median price, the midpoint of the bar's high and low, and sets a band a chosen number of Average True Range (ATR) unit
Filter:
No reviews
Reply to review