RelicusRoad SuperTrend MT5
- Indicators
- Version: 2.297
- Activations: 10

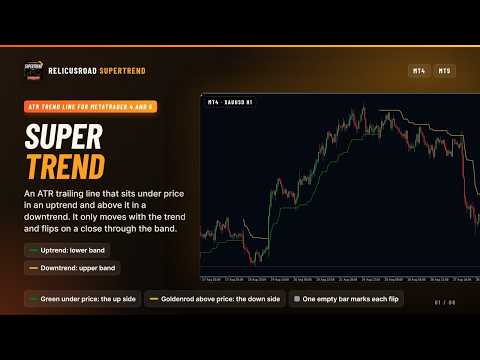
RelicusRoad SuperTrend is a SuperTrend indicator for MetaTrader 4 and MetaTrader 5 that plots an ATR-based trailing line below price in an uptrend and above price in a downtrend.
It is the classic SuperTrend calculation with nothing layered on top: one line for the up side, one for the down side, and no arrows, labels or panels.
How it works
For every bar the indicator takes the median price, the midpoint of the bar's high and low, and sets a band a chosen number of Average True Range (ATR) units above and below it. The trend turns up when a close finishes above the previous bar's upper band, and turns down when a close finishes below the previous bar's lower band. Between those two events the trend side does not change.
- Uptrend: the lower band is plotted under price in the up color, green by default.
- Downtrend: the upper band is plotted above price in the down color, goldenrod by default.
- Flip: the active line ends, one bar is left empty, and the line for the other side begins.
- No neutral state: every calculated bar belongs to either the up side or the down side.
The SuperTrend line only moves with the trend. In an uptrend the lower band may rise but never fall, so it steps up behind price; in a downtrend the upper band may fall but never rise. When the trend flips, the band resets to its raw distance from the median price, which is why a new line often starts some way from where the old one ended.
What it draws
- Up line: a solid line under price while the trend is up, green with width 2 by default.
- Down line: a solid line above price while the trend is down, goldenrod with width 2 by default.
- Flip gap: a one-bar break in the line where the trend changes side, used in place of an arrow.
- Stepped trailing shape: the line holds level or moves with the trend, never against it, until a flip.
- Calculated range: the latest 3000 bars by default, with older bars left empty.
- Uncluttered chart: no arrows, labels or panels are added.
Reading the chart
A green line under price means the latest flip was upward and no close has since finished below the trailing band. A goldenrod line above price means the opposite. The distance between price and the line shows how much room is left before a close on the other side would flip the reading.
The SuperTrend line is calculated once at the start of each new bar, not on every tick. On a live chart the value for the forming bar is set from the first price of that bar, so a flip becomes visible when the next bar opens. After a reload or a timeframe switch the history is recalculated from final bar closes, and an older flip can then land on a slightly different bar than the one you saw live.
A flip marks a change of trend side as this calculation defines it. It does not say how far the new move will run, so use it as context for your own entry, exit and risk rules.
Inputs
Calculation:
- ATR Period: the Average True Range length, default 10.
- Multiplier: the band distance in ATR units, default 3.0; a larger value gives the trend more room before it flips.
- History: how many bars are calculated, default 3000 and capped at 5000.
- TimeFrame: the timeframe the prices and ATR are read from, current chart by default; see the note below before changing it.
Line style:
- Up Color and Down Color: green and goldenrod by default.
- Up Style and Down Style: solid by default.
- Up Width and Down Width: 2 by default.
Recommended use
Suited to forex, gold (XAUUSD), indices, stocks and crypto on any chart timeframe. ATR Period 10 with Multiplier 3.0 is the default. Raise the multiplier on noisier symbols so small swings stay inside the band, or lower it for a line that hugs price more closely and flips more often.
Common questions
Why did the SuperTrend line stay flat while price pulled back? In an uptrend the lower band can rise but not fall, so a pullback toward it leaves the line level until price either moves on or closes below it. The down side works the same way in reverse.
Why is there a gap where the line changes color? At a flip the old side's value on that bar is cleared, which leaves a one-bar break between the two lines. That break is the only flip marker; no arrow is drawn.
Does the SuperTrend line repaint? Live values are set at the open of each bar, while a reload recalculates the history from final closes and can move an older flip by a bar. For that reason this listing does not describe it as non-repainting.
Can I put an H4 SuperTrend on an M15 chart? Not in a time-aligned way. The TimeFrame input places each H4 value on one M15 bar, so the line is compressed rather than stepped. Open an H4 chart when you want the H4 reading.
About and support
This is the ATR trend module from RelicusRoad Pro, released separately as a single-line trend filter. It runs standalone and needs no other RelicusRoad product.
Questions and support are handled in the product comments and through the mql5.com messaging system.