RelicusRoad Dynamic Circles MT4
- Indicators
- Version: 2.297
- Activations: 10

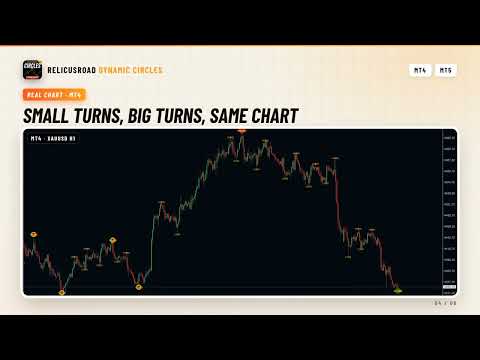
RelicusRoad Dynamic Circles is a swing high and swing low indicator for MetaTrader 4 and MetaTrader 5 that marks turning points with circles at three lookback lengths at once: 9, 60 and 156 bars.
Small turns and large turns sit on the same chart but look different. A short range dot shows a minor swing, while the larger medium and long range rings only appear where price made the extreme of a much longer window. Each circle can carry a short text label such as HH(60) or LL(156).
How it works
For every bar, the indicator checks whether that bar's high is the highest high of the last N bars, counting the bar itself. If it is, the bar gets a high circle. Lows are checked the same way. The test only looks back, so a bar can be marked as soon as it becomes the extreme so far. The same test runs three times, once for each range:
- Short range: 9 bars by default, drawn as a small dot.
- Medium range: 60 bars by default, drawn as a ring.
- Long range: 156 bars by default, drawn as a larger ring.
After marking, a second pass thins the result. When several high circles follow each other with no low circle between them, only the highest one stays. Lows are thinned the same way, so each range alternates between highs and lows much like a zigzag. The three ranges are calculated independently and carry no score or grade beyond their lookback length.
What it draws
- Short high and low dots: orange-red for highs and green for lows by default.
- Medium high and low rings: both orange by default, so position tells them apart.
- Long high and low rings: crimson for highs and dark green for lows by default.
- Circle placement: each circle sits exactly on the high or low price of its bar.
- Text labels: HH(9), HH(60) or HH(156) above highs and LL(9), LL(60) or LL(156) below lows.
- Label spacing: long range labels sit farther from price than short range labels, so they do not overlap.
Reading the chart
A turn that carries a short dot only was the extreme of the last 9 bars. A turn that also carries a medium or long ring was the extreme of 60 or 156 bars. When all three ranges mark the same bar, that swing stands out from every shorter swing around it.
The circles are not fixed once drawn. If price makes a higher high before any swing low forms, the earlier high circle is removed and the new one stays. The most recent circle on each range should therefore be read as the extreme so far, not as a finished turn.
The label style is fixed: small orange text in Trebuchet MS Bold. Show Labels turns all labels on or off together.
Inputs
Ranges and history:
- Short Period, Medium Period and Long Period: the three lookback lengths, 9, 60 and 156 by default.
- History: how many recent bars are calculated, 3000 by default and capped at 5000.
- Show Short High and Show Short Low: show or hide each side of the short range.
- Show Medium High and Show Medium Low: show or hide each side of the medium range.
- Show Long High and Show Long Low: show or hide each side of the long range.
- Show Labels: the HH and LL text next to each circle, on by default.
Colors and sizes:
- Short High Color and Short Low Color: OrangeRed and Green by default.
- Medium High Color and Medium Low Color: both Orange by default.
- Long High Color and Long Low Color: Crimson and DarkGreen by default.
- Short High Size and Short Low Size: circle width, 2 by default.
- Medium High Size and Medium Low Size: circle width, 4 by default.
- Long High Size and Long Low Size: circle width, 5 by default.
Recommended use
Useful on forex, gold (XAUUSD), indices, stocks and crypto, on the chart timeframe you trade. The default lengths of 9, 60 and 156 bars suit intraday charts; on daily and weekly charts you may prefer to lower the long range so it still marks several turns within the visible history. The indicator recalculates when a new bar opens, not on every tick.
Common questions
Why did a circle disappear? A newer bar on the same side went further before the opposite side printed a circle, so only the more extreme point was kept. This is how each range keeps one high and one low per swing.
Can it show swings from a higher timeframe? No. Keep the Timeframe input on the current chart timeframe. Other values do not map the circles onto the right bars.
Can a live chart look different from the same chart after a reload? It can. On a live chart the newest bar is tested when it opens, so a swing that develops inside that bar may only receive its circle after the chart is reloaded.
Does it open trades? No. It only draws circles and labels on the chart.
About and support
Three-range swing marking is the dynamic circles module of RelicusRoad Pro, published separately for traders who read market structure by hand. It runs standalone and needs no other RelicusRoad product.
Questions and support are handled in the product comments and through the mql5.com messaging system.