RelicusRoad Signal Cloud MT4

RelicusRoad Signal Cloud is a cloud indicator for MetaTrader 4 and MetaTrader 5 that projects a price band 21 bars ahead, sized by the gap between the 12 and 26 period EMAs.

The band is centered on a 3-period EMA of close and smoothed so its edges move gradually. Because it is shifted forward, part of the cloud always sits to the right of the last bar, and price later arrives at the section that was drawn earlier.

How it works

For each bar the indicator measures the absolute gap between the 12 and 26 period exponential moving averages of close, the same distance a MACD line shows. That gap becomes the half-width of the band: it is added to a 3-period EMA of close for the upper bound and subtracted from it for the lower bound. Both bounds are then smoothed with a 9-period simple moving average and plotted 21 bars to the right.

  • Width: the distance between EMA 12 and EMA 26.
  • Center: a 3-period EMA of close, fixed in this build.
  • Smoothing: a 9-period simple moving average applied to both bounds.
  • Forward shift: 21 bars to the right by default.
  • Daily wait: an optional gate that holds the calculation at the start of each day.

The daily wait is on by default. At the start of each chart day it pauses the calculation, so only the newest bar is computed, until the 9 and 14 period simple moving averages of close cross or come within 1.0 price unit of each other. Because that distance is measured in raw price, the wait is open nearly all the time on pairs quoted near 1.0, such as most forex majors, while on gold, indices and JPY pairs it can stay closed until a real cross.

What it draws

  • Upper line: a dotted line, blue by default, along the top of the cloud.
  • Lower line: a dotted line, dark goldenrod by default, along the bottom of the cloud.
  • Cloud fill: a histogram fill between the two lines in one color.
  • Projected section: the newest 21 values, drawn to the right of the current bar.
  • Fixed fill color: the cloud does not change color when price moves up or down.
  • No chart objects: no arrows or labels.

Reading the chart

The part of the cloud under the current bar was built from data 21 bars earlier, and the section to the right is the band projected from the latest bars. As price arrives, note whether it trades above, inside or below the cloud.

Cloud thickness follows the gap between EMA 12 and EMA 26. A thick cloud comes from a large difference between the fast and slow averages, and a thin cloud means the two are close together.

The Signal Cloud shows no direction by color. Read direction from where price sits against the band and from its slope, alongside your own entry and risk rules.

Inputs

Calculation:

  • Fast Period: the fast EMA used for the cloud width, default 12.
  • Slow Period: the slow EMA used for the cloud width, default 26.
  • Signal Period: the length of the simple moving average that smooths both bounds, default 9.
  • InpInt_SC_Offset: how many bars the cloud is shifted to the right, default 21; the settings window shows this internal name.
  • Maximum bars calculations: how many recent bars are calculated, default 5000.
  • Wait for the daily 9/14 MA crossover (RelicusRoad Pro parity): the daily wait described above, on by default.

Appearance:

  • Upper Color, Upper Size and Upper Style: the upper line, blue and dotted by default.
  • Cloud Color, Cloud Size and Cloud Style: the lower line, dark goldenrod and dotted by default.
  • Lower Color, Lower Size and Lower Style: the cloud fill, dark goldenrod by default.

Recommended use

Suited to forex, gold (XAUUSD), indices and crypto on any timeframe. On symbols quoted far from 1.0, such as gold or stock indices, consider turning the daily wait off if you want the cloud calculated through the whole day.

Common questions

Why is the cloud drawn ahead of the price bars? The forward shift is 21 bars by default. Lower InpInt_SC_Offset to bring the projected band closer to the current bar.

Can the Signal Cloud show a higher timeframe on a lower chart? The Timeframe input writes each higher timeframe value to one chart bar without matching times, so the result does not line up with the real higher timeframe cloud. Leave Timeframe on the current chart.

Does the Signal Cloud repaint? Live, the newest bar is calculated once when it opens, and the lower bound uses that bar's first price. After a reload the history is recalculated from final closes, so the lower line can differ from what was shown live.

Why is part of today's cloud history missing? If the daily wait was closed when the indicator loaded, earlier bars are not filled in when it opens later in the day. Reload the indicator, or turn the wait off, to draw the full history.

Two input labels do not match what they style: Cloud Color, Size and Style set the lower line, and Lower Color, Size and Style set the cloud fill.

About and support

The projected cloud is a context layer from RelicusRoad Pro, split out for traders who want a single forward band on the chart. It runs standalone.

Questions and support are handled in the product comments and through the mql5.com messaging system.

Recommended products
GTAS STrend
Riviera Systems
4.5 (2)
GTAS S-Trend is a momentum indicator that helps to determine trends using combination of MACD, RSI and moving averages. This indicator was created by Bernard Prats Desclaux, proprietary trader and ex-hedge fund manager, founder of E-Winvest. Description The indicator oscillates between -65 and +65 with a neutral zone between -25 and +25 around a 0 equilibrium line. S-Trend between -25 and +25 indicates congestion zones with a bullish bias between 0 and +25, and a bearish bias between 0 and -25.
FREE
SMAconfirm
Muhammad Robith
This indicator helps you to comfirm SMAs' crossovers by draw a signal line that determines SMA movement direction. when Short SMA cross above Long SMA and Close price is above the signal several bars later, then uptrend is expected. when Short SMA cross below Long SMA and Close price is below the signal several bars later, then downtrend is expected. Input Description :  MA_Period_short: Short-term SMA's period. Used for short-term PriceX. Must be higher than 1.  MA_Period_long: Long-term SMA's
FREE
Coloured Bollinger Bands
Moegamat Luqmaan Titus
Coloured Bollinger Bands The Coloured Bollinger Bands indicator is an enhanced version of the standard Bollinger Bands, offering customizable features to suit your trading needs. It uses the classic Simple Moving Average (SMA) as the middle band, and allows you to easily change the appearance of the bands, including the option to select colors and line types, ensuring better visual clarity and adaptability on your charts
FREE
Email Drawdown Alert
Roman Starostin
5 (12)
Free informative Indicator-helper. It'll be usefull for traders who trade many symbols or using grid systems (Averaging or Martingale). Indicator counts drawdown as percent and currency separate. It has a number of settings: Count deposite drawdown according equity value and send e-mail or notifications to user if DD more than set; Sending e-mail when max open orders reached; Shows price and remaining pips amount before MarginCall on current chart and Account generally; Display summary trade lot
FREE
Astra BB RSI Arrows — a visual indicator for precise trading signals based on Bollinger Bands and RSI Astra BB RSI Arrows was created for traders who need a clear, clean, and fast tool for identifying potential market entry and exit points. The indicator combines two widely used concepts of technical analysis: Bollinger Bands and RSI. Instead of constantly switching between windows and manually monitoring crossovers, overbought zones, and oversold zones, you receive a complete visual signal sys
FREE
Master Trading Matrix
Jeffrey Lloyd Lauzon
Master Trading Matrix (Free Advanced Multi-Indicator Dashboard) The Master Trading Matrix is an institutional-grade technical convergence scanner designed to combine 10 foundational momentum, trend, and exhaustion engines into a single, unified execution display. By integrating RSI, Stochastic, CCI, Williams %R, DeMarker, Momentum, RVI, Chande Momentum, Rate of Change, and Ultimate Oscillator into an executive matrix, this utility eliminates multi-window clutter and provides a complete, real-ti
FREE
The Crossing
Anton Iudakov
5 (2)
+ 2 bonus strategies! Alerts! I recommend watching my advisor -   Night Zen EA The indicator combines the most popular moving average strategies: Simple moving average crossover. Moving average crossover relative to the position of the slower moving average. 2 bonus strategies : The crossing of the fast moving average with the calculation of the opening prices of the slow moving average with the calculation of the closing prices taking into account the slower moving average. (The settings for th
FREE
WAD Stoch
Yonny Pascal Ekwa Mezui
WAD Divergence + Stochastic Overview WAD Divergence + Stochastic is a technical indicator designed to assist traders in identifying potential market turning points. It combines price behavior with momentum confirmation to highlight areas where buying or selling pressure may be shifting. The indicator works directly on the chart and provides clear visual signals to support decision-making in fast-moving markets. How It Works The indicator analyzes the relationship between price movement and inte
FREE
Free automatic Fibonacci is an indicator that automatically plots a Fibonacci retracement based on the number of bars you select on the BarsToScan setting in the indicator. The Fibonacci is automatically updated in real time as new highest and lowest values appears amongst the selected bars. You can select which level values to be displayed in the indicator settings. You can also select the color of the levels thus enabling the trader to be able to attach the indicator several times with differe
FREE
Trendline indicator
David Muriithi
2 (1)
Are you tired of drawing trendlines every time you're analyzing charts? Or perhaps you would like more consistency in your technical analysis. Then this is for you. This indicator will draw trend lines automatically when dropped on a chart. How it works Works similar to standard deviation channel found on mt4 and mt5. It has 2 parameters: 1. Starting Bar 2. Number of bars for calculation The   starting bar   is the bar which drawing of the trend lines will begin, while the   number of bars for c
FREE
FTU Idioteque The indicator is for MT4 platform, can be used alone but best combined with other indicators or strategies Combines various indicators such as macd, adx to draw an arrow for suggestion of entry or trend change Watch a short intro video on youtube:  https://youtu.be/lCRJ3mFNyOQ Indicator Features: Sell and Buy arrows Visual and sound alert Trend continuation / Early trend change signal New features: Limit to amount of bars in history Change distance of arrow from bar Usage : Thi
FREE
Discover the power of precision and efficiency in your trading with the " Super Auto Fibonacci " MT4 indicator. This cutting-edge tool is meticulously designed to enhance your technical analysis, providing you with invaluable insights to make informed trading decisions. Key Features: Automated Fibonacci Analysis: Say goodbye to the hassle of manual Fibonacci retracement and extension drawing. "Super Auto Fibonacci" instantly identifies and plots Fibonacci levels on your MT4 chart, saving you tim
FREE
Color Macd Tf
Syarif Nur Arief
5 (1)
MACD is well known indicator that still can be use for prediction where price will go next few minutes, hours or even weekly  With colored bar of Macd, your eyes can easily catch when color is changed based what market price movement to find any early trend on market. here is the parameter of the indicator: TF_MACD , default is 1 Hour , this mean you can see clearly MACD of 1 Hour TimeFrame on Lower TimeFrame. InpPrice , default is Price Close , this is original MACD parameter from Metaquotes st
FREE
Three Stochastics
Pavel Zamoshnikov
3.7 (10)
This indicator signals about crossing of the main and the signal lines of stochastic (lower stochastic) in the trend direction which is determined by two stochastics of higher time frames (higher stochastics). It is not a secret that stochastic generates accurate signals in a flat market and a lot of false signals in a protracted trend. A combination of two stochastics of higher time frames performs a good filtration of false signals and shows the main tendency. The indicator is recommended for
FREE
SMA Indicator
Nitu Brijesh Yadav
Arrow Indicator (Buy/Sell Alerts) – Simple Yet Powerful Tool!             Product Version: 1.01           Indicator Type: Trend Reversal Signals           Timeframes Supported: All (Recommended: H1, H4, D1)           Key Features: Buy Signal: Green upward arrow () appears below the candle  Sell Signal : Red downward arrow () appears above the candle Accurate Trend Reversal Detection – Based on tried and tested SMA strategy. ️ Clean Chart View – Minimalist, non-i
FREE
Average Directional Movement Index (ADX) indicator with multi-timeframe support, customizable visual signals, and configurable alert system. Freelance programming services, updates, and other TrueTL products are available on my MQL5 profile . Feedback and reviews are highly appreciated! What is ADX? The Average Directional Movement Index (ADX), developed by J. Welles Wilder, is a technical indicator used to measure the strength of a trend, regardless of its direction. The ADX is derived from
FREE
Bollinger Bands Max Free
John Louis Fernando Diamante
4.67 (3)
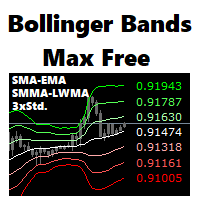
A BB indicator with MA options You're no longer limited to the built in default of using BB off a SMA method, now you can choose from SMA-EMA-SMMA-LWMA. You now also have up to 3 standard deviation levels, with price labels. Options: - MTF - moving average type SMA-EMA-SMMA-LWMA -  3 adjustable deviation levels - separate coloring to lines and texts Troubleshooting: - If there are any issues or suggestions for the indicator, please comment and let me know. The feedback will be noted and consid
FREE
BB Arrows MTF
Yuriy Shatsckiy
The BB Arrows MTF indicator is based on the Bollinger Bands indicator. Represents input signals in the form of arrows. All signals are generated on the current bar. In 2 modes, Signals are not redrawn (Exception of very sharp jumps)! All signals in MTF mode correspond to signals of the period specified in MTF. It is maximally simplified to use both for trading with only one indicator and for using the indicator as part of your trading systems. A feature of the indicator is that the indicator ti
FREE
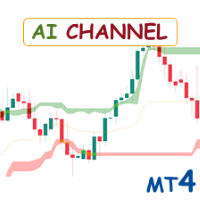
AI Channels MT4
Duc Hoan Nguyen
5 (1)
Get ALL my MT4 & MT5 indicators FREE — See how here New tools   will be   $30   for the   first week   or the   first 3 purchases !  Trading Tools Channel on MQL5 : Join my MQL5 channel to update the latest news from me The AI Channels Indicator utilizes rolling K-means clustering —a powerful machine learning technique in clustering analysis—to deliver real-time insights into underlying price trends. This indicator creates adaptive channels based on clustered price data, enabling traders to ma
FREE
Tipu Heikin Ashi Panel
Kaleem Haider
4.56 (18)
Tipu Heikin-Ashi Panel is the modified version of the original Heiken Ashi indicator published by MetaQuotes here . A professional version of this indicator is available here . Features An easy to use Panel that shows the Heiken Ashi trend of selected timeframe. Customizable Buy/Sell alerts, push alerts, email alerts, or visual on-screen alerts. Customizable Panel. The panel can be moved to any place on the chart or minimized to allow more space. Heikin means "the average", and Ashi means "foot
FREE
PZ Penta O MT4
PZ TRADING SLU
2.33 (3)
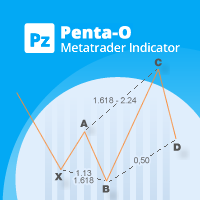
The Penta-O is a 6-point retracement harmonacci pattern which usually precedes big market movements. Penta-O patterns can expand and repaint quite a bit. To make things easier this indicator implements a twist: it waits for a donchian breakout in the right direction before signaling the trade. The end result is an otherwise repainting indicator with a very reliable trading signal. The donchian breakout period is entered as an input. [ Installation Guide | Update Guide | Troubleshooting | FAQ | A
FREE
MASi Three Screens
Aleksey Terentev
5 (2)
MASi Three Screens is based on the trading strategy by Dr. Alexander Elder. This indicator is a collection of algorithms. Algorithms are based on the analysis of charts of several timeframes. You can apply any of the provided algorithms. List of versions of algorithms:     ThreeScreens v1.0 - A simple implementation, with analysis of the MACD line;     ThreeScreens v1.1 - A simple implementation, with analysis of the MACD histogram;     ThreeScreens v1.2 - Combines the first two algorithms in
FREE
The Scaled Awesome Oscillator (SAO) represents a refined adaptation of the Awesome Oscillator, aimed at establishing consistent benchmarks for identifying market edges. Unlike the standard Awesome Oscillator, which records the variation in pips across different commodities, the only unchanging reference point is the zero line. This limitation hampers investors and traders from pinpointing specific levels for trend reversals or continuations using the traditional Awesome Indicator, a creation of
FREE
This indicator is a perfect tool able to compare which brokers have the lower latency. It shows us immediately which brokers are slower or faster. When you see the dot icon on the line, it means this broker is the faster one and the red line (Broker_A) is the slower one. See the example on the screenshot. How It Works? This indicator shares the prices information to and from the "shared" common data folder. It compares all the prices. The price is based on average by (Ask + Bid) / 2. There are
FREE
Stochastic Arrow
Anton Iudakov
4.5 (4)
The indicator has combined 5 popular strategies. Draws an arrow after confirming a signal for the selected strategy. There are signal alerts. Doesn't redraw its values. I recommend watching my advisor -   Night Zen EA 5 strategies. The main line crosses the signal line. The main line crosses the signal line in the oversold (for buy) / overbought (for sell) zones. The main line enters the oversold (for sell) / overbought (for buy) zones . The main line comes out of the oversold (for buy ) / over
FREE
Perfect for one minutes high trading and scalping. This indicator is very effective for trading on one minutes, in the hour. A combination of moving averages and STOCHASTICS calculation to produce a very convincing signal every hour. Blue colour signals a buy opportunity. Follow the X signs for possible buy points. The Blue average line serves as possible trend direction and support. Red colour signals a sell opportunity. Follow the X signs for possible sell points. The Red average line serves a
FREE
CCI Warrior
Marco Barbosa
4.25 (4)
Info:   marcobarbosabots CCI Warrior CCI is the short name of Commodity Channel Index indicator. The CCI Warrior is an Expert Advisor that get signals using CCI (Commodity Channel Index) levels. A SELL signal is generated above a positive level and a BUY signal is generated below a negative level. When a signal is generated, a Moving Average filter checks it. If the signal is in the same direction of the trend indicated by a Moving Average filter, then it is validated. After the signal was vali
FREE
Smart FVG Indicator MT4   delivers professional Fair Value Gap (FVG) detection, monitoring, and alerting directly on your charts. It combines   ATR-based filtering   with structure-aware logic to remove noise, adapt to liquidity, and keep only the most relevant imbalances for precise decisions. Key Advantages Accurate FVG detection:   Identifies genuine inefficiencies, not just simple candle gaps. ATR-based precision:   Adaptive sensitivity filters out low-quality signals across markets and time
FREE
Follow The Line
Oliver Gideon Amofa Appiah
3.94 (16)
FOLLOW THE LINE GET THE FULL VERSION HERE: https://www.mql5.com/en/market/product/36024 This indicator obeys the popular maxim that: "THE TREND IS YOUR FRIEND" It paints a GREEN line for BUY and also paints a RED line for SELL.  It gives alarms and alerts of all kinds. IT DOES NOT REPAINT and can be used for all currency pairs and timeframes. Yes, as easy and simple as that. Even a newbie can use it to make great and reliable trades. NB: For best results, get my other premium indicators for more
FREE
Double HMA lines MTF
Pavel Zamoshnikov
5 (2)
This is a multi-timeframe version of the popular Hull Moving Average (HMA). The Double HMA MTF Light indicator combines two timeframes on a single chart. The HMA of the higher timeframe defines the trend, and the HMA of the current timeframe defines short-term price movements. The indicator is freely distributed and hasn't audio signals or messages. Its main function is the visualization of price movements. If you need advanced functionality of the HMA multi-timeframe indicator (information ab
FREE
Buyers of this product also purchase
Trend SniperX MT4
Sarvarbek Abduvoxobov
5 (5)
Trend Sniper X is a multi-timeframe trend-following indicator for MetaTrader 5 that helps traders identify trend direction and potential reversal points with clarity and precision. For MT5: https://www.mql5.com/en/market/product/181101 Price Information: The current price is promotional and is subject to change as upcoming updates and new features are released. Code2Profit Channel Master the Market with Multi-Timeframe Analysis! How to Maximize Your Win Rate with Trend Sniper X: Key Rules & Sess
Zoryk Gold mt4
Reda El Koutbane
5 (3)
discount ends soon original price 69 $ ZORYK — Advanced XAUUSD Signal System for MetaTrader 4 You know the feeling. You spend time analyzing gold. You wait for the entry. You finally open the trade, and price immediately moves against you. You close too early, move the Stop Loss, or hesitate for a few seconds. Then the market reaches the exact destination you originally expected without you. The direction was not always the problem. The real problem was uncertainty. You did not know exactl
PRO Renko System
Oleg Rodin
5 (31)
PRO Renko System is a highly accurate trading system specially designed for trading RENKO charts. The ARROWS and Trend Indicators DO NOT REPAINT! The system effectively neutralizes so called market noise giving you access to accurate reversal signals. The indicator is very easy to use and has only one parameter responsible for signal generation. You can easily adapt the tool to any trading instrument of your choice and the size of the renko bar. I am always ready to provide extra support to help
Currency Strength Wizard is a very powerful indicator that provides you with all-in-one solution for successful trading. The indicator calculates the power of this or that forex pair using the data of all currencies on multiple time frames. This data is represented in a form of easy to use currency index and currency power lines which you can use to see the power of this or that currency. All you need is attach the indicator to the chart you want to trade and the indicator will show you real str
Atomic Analyst
Issam Kassas
5 (14)
Atomic Analyst — MetaTrader 4 For product questions, setup guidance, or technical support, message me directly here on MQL5. The indicator turns complex market calculations into simple visual signals, color-coded candles, trend readings, stop-loss levels, and multiple take-profit zones that traders can understand quickly and use in real market conditions. Main Trading Uses: Scalping and intraday trading: Designed for fast decision-making, clear arrows, alerts, candle colors, and structured entry
Gann Made Easy
Oleg Rodin
4.84 (173)
Gann Made Easy is a professional and easy to use Forex trading system which is based on the best principles of trading using the theory of W.D. Gann. The indicator provides accurate BUY and SELL signals including Stop Loss and Take Profit levels. You can trade even on the go using PUSH notifications. PLEASE CONTACT ME AFTER PURCHASE TO GET TRADING  INSTRUCTIONS   AND GREAT EXTRA INDICATORS  FOR FREE! Probably you already heard about the Gann trading methods before. Usually the Gann theory is a
Smart Trend Trading System is a chart indicator for MetaTrader 4 that brings trend information, entry and exit signals, and price levels into one workspace. It combines 10+ trading tools into one system, including trend detection, reversal zones, smart cloud, trailing stop logic, support and resistance, candle coloring, alerts, and multi-timeframe analysis. The system is designed to help you trade different market conditions: Trending markets: Identify the main trend, detect pullbacks, follow mo
Top Bottom Tracker is an indicator based on sophisticated algorithms that analyse the market trend and can detect the highs and lows of the trend / MT5 version . The price will progressively increase until it reaches 500$. Next price --> $99 Features No repainting This indicator does not change its values when new data arrives Trading pairs All forex pairs Timeframe     All timeframes Parameters ==== Indicator configuration ==== Configuration parameter // 40 (The higher the value, the
Scalper Vault
Oleg Rodin
5 (40)
Scalper Vault is a powerful, fully-equipped trading system designed for traders who want to achieve consistency in intraday trading . This high-precision indicator serves as a complete, standalone trading system that delivers institutional-grade analysis for both Forex and Binary Options traders. PLEASE CONTACT ME AFTER PURCHASE TO GET MY TRADING TIPS PLUS A GREAT BONUS! By eliminating the guesswork and complex manual analysis, Scalper Vault allows you to focus purely on execution using easy t
Neuro Poseidon MT4
Daria Rezueva
4.74 (46)
Neuro Poseidon is a new indicator by Daria Rezueva. It combines precise trading signals with adaptive TP/SL levels - creating best possible trades as a result! Message me and get  Neuro Poseidon Assistant  as a gift to automize your trading process! What makes it stand out? 1. Proven profitability on all assets and timeframes 2. Only confirmed BUY and SELL signals present on the chart 3. Adaptive TP & SL levels generated by the software for each trade 4. Easy to understand - suitable for all
Tokyo mt4 Indicator
Vasiliy Strukov
5 (9)
Tokyo Indicator provides a clear visual overview of trend direction, potential trading signals, and market conditions. Its colour-coded, stepped trend line distinguishes bullish phases in blue from bearish phases in magenta. Matching directional arrows highlight potential buying and selling opportunities when the displayed trend changes. An integrated dashboard brings together the current signal, market bias, momentum, volatility, and signal quality in one convenient view. This allows traders t
Liquidity Scalper System: a liquidity-based trading system in indicator form. Most indicators only show an arrow, and the trader then has to decide where the stop goes, where the target is and whether the signal can be trusted at all. Liquidity Scalper System covers the full trade cycle: it finds liquidity pools, gives a signal when they are broken, immediately calculates Entry, Stop Loss and three targets, and shows statistics and out-of-sample test results on the panel. The system picks its o
Trading Special – 30% OFF Best Solution for any Newbie or Expert Trader! This dashboard software is working on 28 currency pairs plus one. It is based on 2 of our main indicators (Advanced Currency Strength 28 and Advanced Currency Impulse). It gives a great overview of the entire Forex market plus Gold or 1 indices. It shows Advanced Currency Strength values, currency speed of movement and signals for 28 Forex pairs in all (9) timeframes. Imagine how your trading will improve when you can watch
SR Liquidity
Oleg Rodin
5 (2)
SR Liquidity is a trading indicator designed to reveal the hidden zones where market liquidity concentrates and price reacts most strongly. These special liquidity areas act as powerful support and resistance levels, giving you a clear map of where the market is most likely to reverse. Instead of drawing ordinary Support/Resistance lines, SR Liquidity analyzes real price behavior to detect the zones where buying and selling pressure accumulate. These are actually the pools of liquidity that driv
AW Prime Oscillator
AW Trading Software Limited
5 (1)
A combination of two oscillators. The first one displays the entry points, the second shows the current trend . The indicator can display oscillator signals by arrows in two modes, all fast oscillator signals or signals only in the direction of the current trend. It has a multi-timeframe panel and three types of signal notifications. Benefits: Suitable for day and scalping trading Trend filtering Simple and sensitive setup Multi-timeframe panel Suitable for integration into an advisor. Works on
M1 Sniper
Oleg Rodin
4.97 (30)
M1 SNIPER  is an easy to use trading indicator system. It is an arrow indicator which is designed for M1 time frame. The indicator can be used as a standalone system for scalping on M1 time frame and it can be used as a part of your existing trading system. Though this trading system was designed specifically for short-term trading, it still can be helpful for all traders. This trading system can be used with any forex pair and time frame, though lower time frames are recommended from M1 up to M
CRT Candle Range Theory HTF MT4 - Ultimate CRT Indicator: Advanced ICT Concepts and Malaysian SnR Trading System Master the Market Maker's Footprints with the Most Advanced Candle Range Theory Indicator. Unlock the true power of Smart Money Concepts (SMC) and trade precisely like the institutions with the Ultimate CRT Indicator. Built exclusively for serious traders, this indicator automates the highly effective Candle Range Theory (CRT), a core pillar of ICT Concepts (Inner Circle Trader), and
Cycles Predictor Indicator This indicator uses past market cycles to predict future price movements. The indicator scans through past data and considers  combinations  of cycles. When cycles  coincide  at the same future date/time then it is considered a valid future prediction. The predictions are drawn as vertical lines on the right side of the chart in the future. A prediction will often result in type of candle (ex. bull or bear) and/or a reversal point (ex. bottom or top) forming at this ex
GoldRush Trend Arrow Signal V1.6 The GoldRush Trend Arrow Signal indicator V1.6 continues to provide precise, real-time trend analysis tailored for high-speed, short-term scalpers in XAU/USD , but it now has additional features and improved efficiency and reliability. Built specifically for the 1-minute time frame, this tool displays directional arrows for clear entry points, allowing scalpers to navigate volatile market conditions with confidence. The indicator consists of PRIMARY and SECONDARY
Break and Retest Hunter MT4 is a powerful MetaTrader 5 indicator designed to automatically identify support and resistance levels, breakout structures, and potential retest opportunities in real time. Bonus Indicator: After purchasing Break and Retest Hunter , contact me to receive Trade Indicator Assistant EA completely free as a bonus utility. $65 for the next 10 copies . Next price is $120.  Combining adaptive market analysis, clear BUY/SELL signals, Fibonacci-based profit targets, and a pre
ForexTrendMT4
Andriy Sydoruk
5 (1)
ForexTrendMT4 Indicator: A Reliable Tool for Market Tracking The ForexTrendMT4 indicator offers reliable market trend tracking, filtering out sudden fluctuations and market noise. This tool helps identify trends and signals favorable entry points into the market using arrows. It is suitable for both scalping on shorter timeframes and long-term trading strategies. Based on the principles of technical analysis, ForexTrendMT4 takes into account the cyclical nature of the market. Key Features and A
CRT Multi-Timeframe Market Structure & Liquidity Sweep Indicator Non-Repainting | Multi-Asset | MT5 Version Available MT5 Version:   https://www.mql5.com/en/market/product/162075 Full User Guide — explains what each feature does and why:   https://www.mql5.com/en/blogs/post/767525 Quick Start User Guide  — explains how to configure and in what order:  https://www.mql5.com/en/blogs/post/767540 Indicator Overview CRT Ghost Candle HTF Fractal is a complete institutional-grade market structure too
Super Signal – Skyblade Edition Professional No-Repaint / No-Lag Trend Signal System with Exceptional Win Rate | For MT4 / MT5 It works best on lower timeframes, such as 1-minute, 5-minute, and 15-minute charts. Core Features: Super Signal – Skyblade Edition is a smart signal system designed specifically for trend trading. It applies a multi-layered confirmation mechanism to detect only strong, directional moves supported by real momentum. This system does not attempt to predict tops or bottoms
Trading Special –40% OFF Best Solution for any Newbie or Expert Trader! This Indicator is a unique, high quality and affordable trading tool because we have incorporated a number of proprietary features and a new formula. With only ONE chart you can read Currency Strength for 28 Forex pairs! Imagine how your trading will improve because you are able to pinpoint the exact trigger point of a new trend or scalping opportunity? User manual: click here Looking for the MT5 version? Click here: https:/
Volume Orderflow Profile
Suvashish Halder
5 (2)
Introducing Volume Orderflow Profile , a versatile tool designed to help traders visualize and understand the dynamics of buying and selling pressure within a specified lookback period. Perfect for those looking to gain deeper insights into volume-based market behavior! MT5 Version -  https://www.mql5.com/en/market/product/122657 The indicator gathers data on high and low prices, along with buy and sell volumes, over a user-defined period. It calculates the maximum and minimum prices during this
Smart Price Action Concepts — MetaTrader 4 For product questions, setup guidance, or technical support, message me directly here on MQL5. Smart Money Concepts SMC  Inner Circle Trading ICT  Price Action PA and Institutional Trading IT Real time market structure and swing structure highs and lows ( HH HL LL LH ) Real time internal and swing supply and demand order blocks Premium Equilibrium and Discount Zones Automatic Fibonacci Detection with 2 Options (current swing or previous swing ) Equal hi
VWAP Ultimate Pro MT4 – Persistent Anchored VWAP | Session VWAP | Dynamic Bands & Smart Alerts Bring an Advanced Professional VWAP Workflow to the Classic MetaTrader 4 Platform WHY TRADERS CHOOSE VWAP ULTIMATE PRO MT4? VWAP (Volume-Weighted Average Price) is a widely used benchmark for evaluating fair value, session bias and price positioning. VWAP Ultimate Pro MT4 delivers a complete VWAP workflow optimised for the MT4 architecture, including persistent Anchored VWAP, multiple VWAP periods,
This indicator works on MT4 and is very easy to use. When you receive a signal from it, you wait for that candle with the signal to close and you enter your trade at the beginning of the next new candle . A red arrow means sell and a green arrow means buy. All arrows comes with Alert  like for easy identification of trade signal. Are you okay with that? 1 minute candle 1 minute expire
Trend Lines PRO
Roman Podpora
5 (2)
TREND LINES PRO    helps understand where the market is truly changing direction. The indicator shows real trend reversals and points where major players re-enter. You see   BOS lines   Trend changes and key levels on higher timeframes — without complex settings or unnecessary noise. Signals don't repaint and remain on the chart after the bar closes. VERSION MT 5     -     Reveals its maximum potential when paired with the   RFI LEVELS PRO  indicator What the indicator shows: Real shifts   tren
Advanced Supply Demand
Bernhard Schweigert
4.91 (302)
Trading Special – 30% OFF Best Solution for any Newbie or Expert Trader! This indicator is a unique, high quality and affordable trading tool because we have incorporated a number of proprietary features and a new formula. With this update, you will be able to show double timeframe zones. You will not only be able to show a higher TF but to show both, the chart TF, PLUS the higher TF: SHOWING NESTED ZONES. All Supply Demand traders will love it. :) Important Information Revealed Maximize the pot
More from author
RelicusRoad Pro MT5
Relicus LLC
4.96 (25)
Stop guessing your trades. Know when to enter, where to get out and which way the market leans, all on one chart. RelicusRoad Pro brings nearly twenty tools into one indicator, and you switch on the ones that fit the way you trade. Clear entries. Clear exits. A plan on every chart. Sound familiar? You buy, and price turns against you a minute later. You close too early, then watch the move carry on without you. Five indicators on the chart, five different answers. Your stop loss is a guess. Why
The Moving Average Convergence Divergence (MACD) trading strategy is a popular technical analysis tool that is used to identify changes in momentum and trend direction. The MACD is calculated by subtracting the 26-period exponential moving average (EMA) from the 12-period EMA. A 9-period EMA, called the "signal line," is then plotted on top of the MACD to act as a trigger for buy and sell signals. Want support and every tool in one streamlined indicator? This MACD is part of the RelicusRoad Pr
FREE
RelicusRoad MACD v2
Relicus LLC
4.67 (6)
The Moving Average Convergence Divergence (MACD) trading strategy is a popular technical analysis tool that is used to identify changes in momentum and trend direction. The MACD is calculated by subtracting the 26-period exponential moving average (EMA) from the 12-period EMA. A 9-period EMA, called the "signal line," is then plotted on top of the MACD to act as a trigger for buy and sell signals. Want support and every tool in one streamlined indicator? This MACD is part of the RelicusRoad Pr
FREE
RelicusRoad Signal Line is a trend filter indicator for MetaTrader 4 and MetaTrader 5 that draws two moving average lines and colors each bar of them green, salmon or gray from a strategy filter you choose. The line shows where the average is. The color shows what the chosen filter says about that bar. By default Line 1 is a fast KAMA 9 colored by momentum and Line 2 is a slow Hull moving average 200 colored by Ichimoku. How it works Each line is calculated from closing prices with the average t
FREE
RelicusRoad Signal Line is a trend filter indicator for MetaTrader 4 and MetaTrader 5 that draws two moving average lines and colors each bar of them green, salmon or gray from a strategy filter you choose. The line shows where the average is. The color shows what the chosen filter says about that bar. By default Line 1 is a fast KAMA 9 colored by momentum and Line 2 is a slow Hull moving average 200 colored by Ichimoku. How it works Each line is calculated from closing prices with the average t
FREE
RelicusRoad Multi Timeframe Trendbar is a multi-timeframe trend indicator for MetaTrader 4 and MetaTrader 5 that shows an Uptrend, Neutral or Downtrend state for nine timeframes, M1 to MN1, as a row of colored dots in the chart corner. Each timeframe gets one dot with its name above it, in the lower-right corner of the chart. The color tells you the state, so you can see which timeframes agree without switching charts. How it works For each timeframe, the indicator compares two standard tools on
FREE
RelicusRoad Daily Pivots is a daily pivot points indicator for MetaTrader 4 and MetaTrader 5 that divides the previous day's range into Fibonacci levels and extends them above and below it, from minus 100 to plus 200 percent. Instead of classic floor pivots, the previous completed range is treated as a scale where the low is 0% and the high is 100%. Nineteen levels are printed as compact colored markers at the right edge of the chart, so the size of today's move reads as a fraction or a multiple
FREE
RelicusRoad SuperTrend is a SuperTrend indicator for MetaTrader 4 and MetaTrader 5 that plots an ATR-based trailing line below price in an uptrend and above price in a downtrend. It is the classic SuperTrend calculation with nothing layered on top: one line for the up side, one for the down side, and no arrows, labels or panels. How it works For every bar the indicator takes the median price, the midpoint of the bar's high and low, and sets a band a chosen number of Average True Range (ATR) unit
FREE
RelicusRoad SuperTrend is a SuperTrend indicator for MetaTrader 4 and MetaTrader 5 that plots an ATR-based trailing line below price in an uptrend and above price in a downtrend. It is the classic SuperTrend calculation with nothing layered on top: one line for the up side, one for the down side, and no arrows, labels or panels. How it works For every bar the indicator takes the median price, the midpoint of the bar's high and low, and sets a band a chosen number of Average True Range (ATR) unit
FREE
RelicusRoad Multi Timeframe Levels is a multi-timeframe support and resistance indicator for MetaTrader 4 and MetaTrader 5 that draws the latest swing high and swing low from H1, H4, D1, W1 and MN1 as horizontal lines on the chart you are trading. Each of those five timeframes contributes one resistance line and one support line, so an intraday chart carries up to ten lines. Every line is colored by the timeframe it came from, which keeps the higher-timeframe swings in view without switching cha
FREE
RelicusRoad Daily High Low is a previous day high and low indicator for MetaTrader 4 and MetaTrader 5 that marks yesterday's high and low and today's open on every bar of an intraday chart. The three levels are drawn as colored dot series that step to new values when a new period starts, with small High, Low and Open tags at the end of each period. On charts from H1 to H4 the same markers show last week's range and this week's open instead, and on D1 they show the monthly equivalents. How it wor
FREE
RelicusRoad Daily High Low is a previous day high and low indicator for MetaTrader 4 and MetaTrader 5 that marks yesterday's high and low and today's open on every bar of an intraday chart. The three levels are drawn as colored dot series that step to new values when a new period starts, with small High, Low and Open tags at the end of each period. On charts from H1 to H4 the same markers show last week's range and this week's open instead, and on D1 they show the monthly equivalents. How it wor
FREE
RelicusRoad Fractals is a fractal indicator for MetaTrader 4 and MetaTrader 5 that marks swing highs and swing lows at two strengths, a Fast test of 7 bars on each side and a Slow test of 15 bars on each side. A 7-bar window on each side already filters out many small wiggles, and the Slow test asks for more than twice that, so its thicker arrows pick out the swings that held over a much wider stretch of the chart. Both strengths are shown together, so minor and larger swings can be told apart a
FREE
RelicusRoad Multi Timeframe Trendbar is a multi-timeframe trend indicator for MetaTrader 4 and MetaTrader 5 that shows an Uptrend, Neutral or Downtrend state for nine timeframes, M1 to MN1, as a row of colored dots in the chart corner. Each timeframe gets one dot with its name above it, in the lower-right corner of the chart. The color tells you the state, so you can see which timeframes agree without switching charts. How it works For each timeframe, the indicator compares two standard tools on
FREE
RelicusRoad Multi Timeframe Levels is a multi-timeframe support and resistance indicator for MetaTrader 4 and MetaTrader 5 that draws the latest swing high and swing low from H1, H4, D1, W1 and MN1 as horizontal lines on the chart you are trading. Each of those five timeframes contributes one resistance line and one support line, so an intraday chart carries up to ten lines. Every line is colored by the timeframe it came from, which keeps the higher-timeframe swings in view without switching cha
FREE
RelicusRoad Signal Cloud is a cloud indicator for MetaTrader 4 and MetaTrader 5 that projects a price band 21 bars ahead, sized by the gap between the 12 and 26 period EMAs. The band is centered on a 3-period EMA of close and smoothed so its edges move gradually. Because it is shifted forward, part of the cloud always sits to the right of the last bar, and price later arrives at the section that was drawn earlier. How it works For each bar the indicator measures the absolute gap between the 12 a
FREE
RelicusRoad Trading Sessions is a trading sessions indicator for MetaTrader 4 and MetaTrader 5 that marks the opening time of the Tokyo, London and New York sessions with dotted vertical lines on M1, M5 and M15 charts. Each session open is shown as a line, a small rotated name label and an event marker in the session's color, for the current day and the previous weekdays. Hovering over one shows the session name and its opening time. The indicator marks opens only: it does not shade session rang
FREE
RelicusRoad Daily Pivots is a daily pivot points indicator for MetaTrader 4 and MetaTrader 5 that divides the previous day's range into Fibonacci levels and extends them above and below it, from minus 100 to plus 200 percent. Instead of classic floor pivots, the previous completed range is treated as a scale where the low is 0% and the high is 100%. Nineteen levels are printed as compact colored markers at the right edge of the chart, so the size of today's move reads as a fraction or a multiple
FREE
RelicusRoad Fractals is a fractal indicator for MetaTrader 4 and MetaTrader 5 that marks swing highs and swing lows at two strengths, a Fast test of 7 bars on each side and a Slow test of 15 bars on each side. A 7-bar window on each side already filters out many small wiggles, and the Slow test asks for more than twice that, so its thicker arrows pick out the swings that held over a much wider stretch of the chart. Both strengths are shown together, so minor and larger swings can be told apart a
FREE
RelicusRoad CopyTrader is a free trade copier for MetaTrader 5 . It copies trades between MT5 terminals on the same computer, so you can trade one account and have the others follow it, each at its own size and risk. Full version, no limitations, no trial period. Trade one account. Let the rest follow. MetaTrader 4: RelicusRoad CopyTrader MT4 How it works One terminal runs as the Leader (master) and shares the orders it holds. Any number of terminals run as Followers (slaves) and mirror them. Te
FREE
RelicusRoad Trading Sessions is a trading sessions indicator for MetaTrader 4 and MetaTrader 5 that marks the opening time of the Tokyo, London and New York sessions with dotted vertical lines on M1, M5 and M15 charts. Each session open is shown as a line, a small rotated name label and an event marker in the session's color, for the current day and the previous weekdays. Hovering over one shows the session name and its opening time. The indicator marks opens only: it does not shade session rang
FREE
RelicusRoad CopyTrader is a free trade copier for MetaTrader 4 . It copies trades between MT4 terminals on the same computer, so you can trade one account and have the others follow it, each at its own size and risk. Full version, no limitations, no trial period. Trade one account. Let the rest follow. MetaTrader 5: RelicusRoad CopyTrader MT5 How it works One terminal runs as the Leader (master) and shares the orders it holds. Any number of terminals run as Followers (slaves) and mirror them. Te
FREE
RelicusRoad Pro
Relicus LLC
4.65 (107)
Stop guessing your trades. Know when to enter, where to get out and which way the market leans, all on one chart. RelicusRoad Pro brings nearly twenty tools into one indicator, and you switch on the ones that fit the way you trade. Clear entries. Clear exits. A plan on every chart. Sound familiar? You buy, and price turns against you a minute later. You close too early, then watch the move carry on without you. Five indicators on the chart, five different answers. Your stop loss is a guess. Why
RelicusRoad Support Resistance is a support and resistance indicator for MetaTrader 4 and MetaTrader 5 that builds supply and demand zones from fractal swings and grades each one by its strength and recent tests. It keeps a short map of zones above and below price, each labeled with its grade, width and recent test count. How it works Swing highs and lows are collected into price zones rather than single lines. A swing is a bar whose high or low is not exceeded by the 7 bars on either side, and
RelicusRoad Action Levels is a support and resistance levels indicator for MetaTrader 4 and MetaTrader 5 that fits a grid of major and minor price levels to the symbol's own volatility and past reactions, and labels each level with its touch count. The grid is not a fixed pip spacing and not a plain round-number grid. Its spacing and offset are chosen from completed bars, each level is scored on how price behaved around it, and only the strongest levels near the current price are drawn. How it w
RelicusRoad Scalping Pivots is a swing point and Fibonacci level indicator for MetaTrader 4 and MetaTrader 5 that marks alternating swing highs and lows over a 60-bar lookback and labels Fibonacci retracements and extensions of the latest swing. The pivots in the name are these swing points, not classic floor pivot points such as PP, R1 and S1. Next to the newest swing, the indicator prints a column of percentage labels so you can read retracement and extension levels without drawing a Fibonacci
RelicusRoad Dynamic Circles is a swing high and swing low indicator for MetaTrader 4 and MetaTrader 5 that marks turning points with circles at three lookback lengths at once: 9, 60 and 156 bars. Small turns and large turns sit on the same chart but look different. A short range dot shows a minor swing, while the larger medium and long range rings only appear where price made the extreme of a much longer window. Each circle can carry a short text label such as HH(60) or LL(156). How it works For
RelicusRoad Trendlines is an automatic trendline indicator for MetaTrader 4 and MetaTrader 5 that fits trendline channels through confirmed swing pivots at three swing sizes and draws them as shaded zones. Short, medium and long swings each have their own color. The chart shows the two or three channels that score highest at the moment, plus a grey checkerboard box that maps a reference entry, stop and target for one selected rail. How it works A swing high or low is confirmed only when it is th
RelicusRoad Order Blocks is an order block indicator for MetaTrader 4 and MetaTrader 5 that finds displacement candles, marks the candle that started each move as a bullish or bearish order block, and tracks how far price has traded back into it. It is written for traders who work with smart money concepts (SMC). How it works A displacement candle is one whose body is at least 1.5 times the Average True Range (ATR) of the last 14 bars and at least 55 percent of its own high-to-low range. The ind
RelicusRoad for MetaTrader 4 and MetaTrader 5 draws a channel of volatility-based liquidity levels around a center line, so you can see at a glance whether price is near its recent average or stretched to an edge where targets and stops belong. The center line is a weighted average of recent prices. Three Sell levels sit above it and three Buy levels below, each a fixed step further out, so the outer lines are only reached when price has travelled a long way from its average. What Each Line Tell
Filter:
No reviews
Reply to review