RelicusRoad Signal Line MT4
- Indicators
- Version: 2.297
- Activations: 10

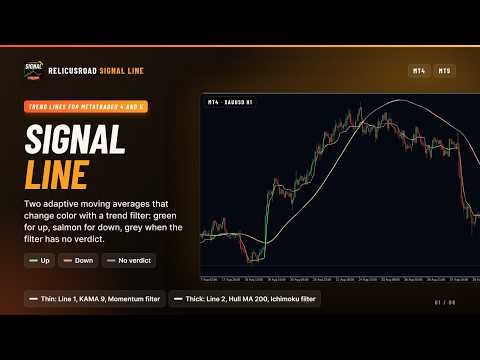
RelicusRoad Signal Line is a trend filter indicator for MetaTrader 4 and MetaTrader 5 that draws two moving average lines and colors each bar of them green, salmon or gray from a strategy filter you choose.
The line shows where the average is. The color shows what the chosen filter says about that bar. By default Line 1 is a fast KAMA 9 colored by momentum and Line 2 is a slow Hull moving average 200 colored by Ichimoku.
How it works
Each line is calculated from closing prices with the average type and length you set. A gray copy of the line is always drawn underneath. On bars where the selected filter gives an up reading, a green segment is drawn over it, and on bars where the filter gives a down reading, the segment is light salmon. When the filter is undecided the gray line stays visible. Each line has its own average and its own filter.
- Momentum: 5-period momentum of the previous closed bar compared with its value two bars earlier.
- Ichimoku: Tenkan above Kijun with the previous close above both cloud spans for green, the mirror case for salmon.
- MACD: the 12, 26, 9 main line above or below its signal line.
- ParabolicSAR: the bar's open above the SAR for green, the bar's high below the SAR for salmon.
- Moving Average and Reversal: the open against the line itself, or a one-bar reversal pattern against a 9-period average.
Moving Average is the only filter that colors the line by which side of it price is on. The other filters judge the bar on their own terms, so a green line can sit above price. Reversal needs a specific candle pattern and therefore leaves the line gray most of the time. Disable turns the coloring off.
What it draws
- Line 1: the fast line, width 2 by default, in its three state colors.
- Line 2: the slow line, drawn at width 3, in its own three state colors.
- Uptrend segments: light green by default, on bars where the filter reads up.
- Downtrend segments: light salmon by default, on bars where the filter reads down.
- Neutral line: gray by default, visible wherever the filter gives no reading.
- Six indicator buffers: Neutral, Up and Down for each line; there are no arrows, labels or other chart objects.
Reading the chart
Read the slope and position of each line as you would any moving average, then read its color as a second opinion. A fast line turning from green to gray tells you momentum has stopped rising before the average itself has turned.
The two lines are not compared with each other and their crossings are not marked. Whether you wait for both colors to agree, or use the slow line only as a regime filter for the fast one, is your own rule.
The lines are calculated once per new bar, not on every tick. After a reload or a timeframe change the history is rebuilt from final closing prices, so older segments can look slightly different from what was shown live.
Inputs
Line setup (the same inputs exist for Line 1 and Line 2):
- Show Signal Line 1 and Show Signal Line 2: draw and calculate each line; a hidden line is not calculated.
- Line 1 Type/Mode: SMA, EMA, SMMA, LWMA, KAMA, VIDYA, FRAMA or HMA.
- Line 1 Length: the average period, 9 for Line 1 and 200 for Line 2 by default.
- Line 1 (Strategy Based): the coloring filter, Momentum for Line 1 and Ichimoku for Line 2 by default.
- Line 1 History: bars calculated, 3000 by default and at most 5000.
- Line 1 Timeframe and Line 1 Strategy Timeframe: where the average and the filter read their prices; the chart timeframe by default.
Appearance:
- Line 1 Uptrend, Neutral and Downtrend Color: the three state colors, set separately for each line.
- Line 1 Uptrend, Neutral and Downtrend Style: solid by default.
- Line 1 Uptrend, Neutral and Downtrend Width: 2 by default; Line 2 is always drawn solid at width 3.
Recommended use
Works on forex, gold (XAUUSD), indices, stocks and crypto, on any chart timeframe. Every average type, length and filter can be changed, so the defaults are a starting pair rather than a fixed system.
Common questions
Does it signal when the two lines cross? No. Nothing detects or marks crossings. The only change the indicator shows is a line changing color.
Can I read the average and the filter from a higher timeframe? The inputs allow it, but the other timeframe is read by bar position rather than by time, so its values do not line up with the chart bars. Leave both timeframe inputs on the chart timeframe for a clean reading.
Why is my line gray for long stretches? The filter has no up or down reading on those bars. Ichimoku needs the cloud and the Tenkan and Kijun lines to agree, and Reversal needs its candle pattern, so both stay gray through mixed conditions.
About and support
The two colored lines are the trend filter layer of RelicusRoad Pro, published separately for traders who want a colored moving average and nothing else on the chart. It runs standalone.
Questions and support are handled in the product comments and through the mql5.com messaging system.