RelicusRoad Daily Pivots MT5
- Indicators
- Version: 2.297
- Activations: 10

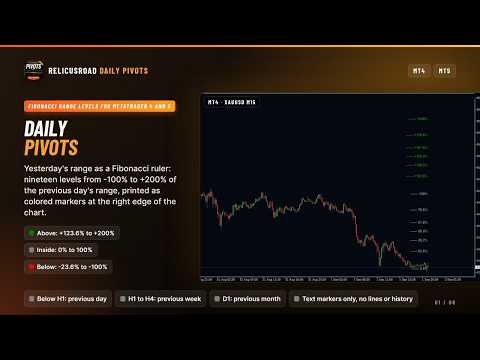
RelicusRoad Daily Pivots is a daily pivot points indicator for MetaTrader 4 and MetaTrader 5 that divides the previous day's range into Fibonacci levels and extends them above and below it, from minus 100 to plus 200 percent.
Instead of classic floor pivots, the previous completed range is treated as a scale where the low is 0% and the high is 100%. Nineteen levels are printed as compact colored markers at the right edge of the chart, so the size of today's move reads as a fraction or a multiple of yesterday's range.
How it works
The indicator takes the high and low of the previous completed reference period and places a level at each ratio of that range: level = low + ratio x (high - low). Weekend bars are skipped, so on a Monday the reference is the last trading day. The reference period comes from the chart timeframe.
- Inside set, gray: 0%, 23.6%, 38.2%, 50.0%, 61.8%, 78.6% and 100%.
- Above set, green: +123.6%, +138.2%, +150.0%, +161.8%, +178.6% and +200%.
- Below set, red: -23.6%, -38.2%, -50.0%, -61.8%, -78.6% and -100%.
Below H1 the reference is the previous day. On H1 to H4 charts it is the previous week, and on D1 it is the previous month. W1 and MN1 charts show nothing. Period boundaries follow the broker's server time.
What it draws
- Level markers: up to 19 text markers, each a short dashed stroke followed by its ratio, for example ------ 61.8%.
- Position: the right end of every marker sits at the time of the current bar.
- Colors: green above the range, gray inside it including 0% and 100%, red below it.
- Tooltips: hovering a marker shows its ratio, for example DailyPivots 161.8%.
- Background drawing: markers sit behind price, cannot be selected and are hidden from the object list.
- No lines or history: there are no horizontal lines, zones, buffers or levels from earlier days.
Reading the chart
On an M15 chart the gray markers split yesterday's candle at the familiar Fibonacci ratios, with 50.0% at its midpoint. Price holding between 0% and 100% is still trading inside yesterday's range.
The green markers above and the red markers below repeat the same ratios outside the range. A move that reaches +161.8% has traveled 61.8% of yesterday's range beyond yesterday's high, which puts the size of a breakout in plain proportion.
The high and low behind the scale are the widest seen since the indicator was loaded, and they are not reset at a new day. After several days on the chart the scale can therefore cover more than the latest day. Reload the indicator, or switch timeframe and back, to rebuild it from the most recent range.
Inputs
Level sets:
- 100% -> 200% Pivot: the first of the two inputs with this name shows or hides the six levels above the range.
- 0% -> 100% Pivot: the first of the two inputs with this name shows or hides the seven levels inside the range.
- =100% -> 0% Pivot: shows or hides the six levels below the range.
Appearance:
- 100% -> 200% Pivot (second input): the color of the levels above, green by default.
- 0% -> 100% Pivot (second input): the color of the levels inside, gray by default.
- -100% -> 0% Pivot: the color of the levels below, red by default.
- Font Size: the marker text size, 9 by default.
Recommended use
Suited to forex, gold (XAUUSD), indices and crypto on intraday charts below H1, where the reference is the previous trading day. Leave TimeFrame on Current.
Common questions
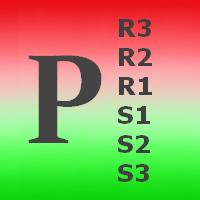
Are these classic floor pivots? No. There is no central pivot and no R1 or S1. The levels are Fibonacci ratios of the previous range.
Why are the levels weekly on my H1 chart? With TimeFrame on Current, charts from H1 to H4 use the previous week. In this version the other TimeFrame choices are not applied, so for daily levels use a chart below H1.
Does it keep the levels of earlier days? No. Only the current set of markers is shown, at the right edge of the chart.
Why did the scale get wider after a new day? The stored high and low only widen until the indicator is reloaded. Reloading it rebuilds the scale from the latest completed range.
About and support
The Fibonacci range scale is the daily pivot model from RelicusRoad Pro, published on its own for traders who measure moves against the previous day's range. It runs standalone.
Questions and support are handled in the product comments and through the mql5.com messaging system.