PivotForge
- Indicators
- Version: 1.0

Overview
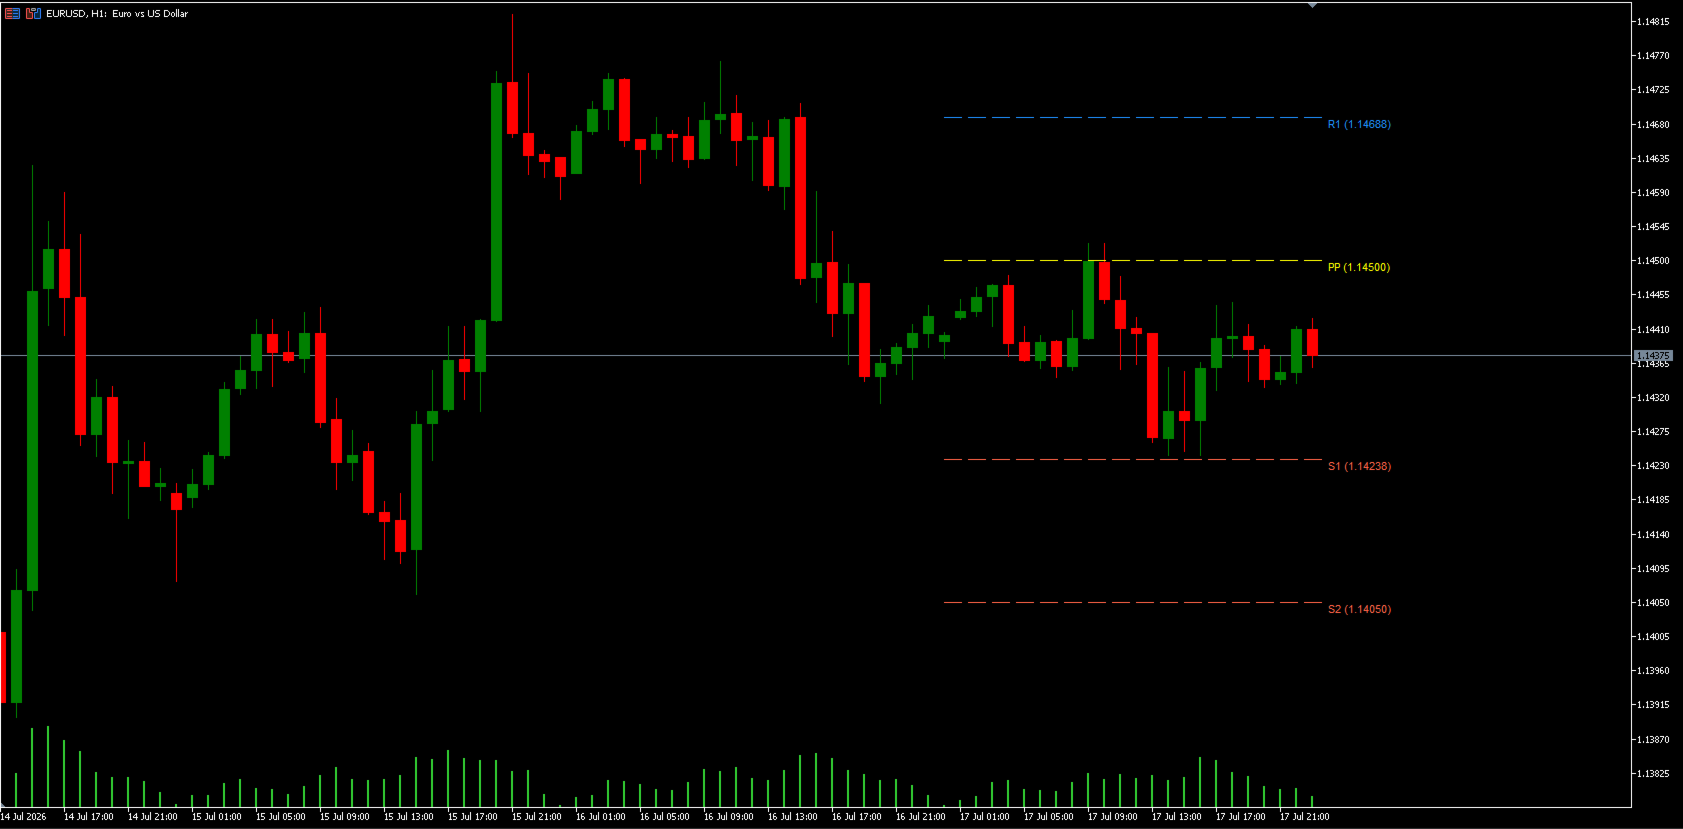
PivotForge calculates and plots Daily or Weekly Pivot Points directly on your chart, using either the Classic or Fibonacci method. Levels update automatically at the start of each new period, giving you clean, objective support/resistance zones without manual recalculation.
How it works
- Selects the previous completed Daily or Weekly candle as the reference period
- Computes Pivot (PP), Resistance (R1-R3), and Support (S1-S3) using Classic or Fibonacci formulas
- Draws horizontal lines spanning the current period, each labeled with its price
- Automatically redraws on every new period (day or week)
Inputs
- Pivot_Timeframe: Daily or Weekly calculation period
- Pivot_Method: Classic or Fibonacci
- Show_S3_R3: Toggle outer levels
- Line_Style: Line style
- Line_Width: Line width
- Show_Price_Labels: Show price value next to label
- Color_PP: Pivot line color
- Color_R1 / Color_R2 / Color_R3: Resistance line colors
- Color_S1 / Color_S2 / Color_S3: Support line colors
Recommended setup
Works on any symbol and timeframe. Daily pivots suit intraday trading (M15-H1); Weekly pivots suit swing trading (H4-D1). No VPS required for this indicator.
Screenshots
Screenshots show PivotForge on a live chart with default Classic settings, and the input panel with recommended values.
Disclaimer
For informational and educational purposes only. Past performance does not guarantee future results. Always test on a demo account before live use.