VolumaxProfile
- Indicators
- Version: 1.0

Overview
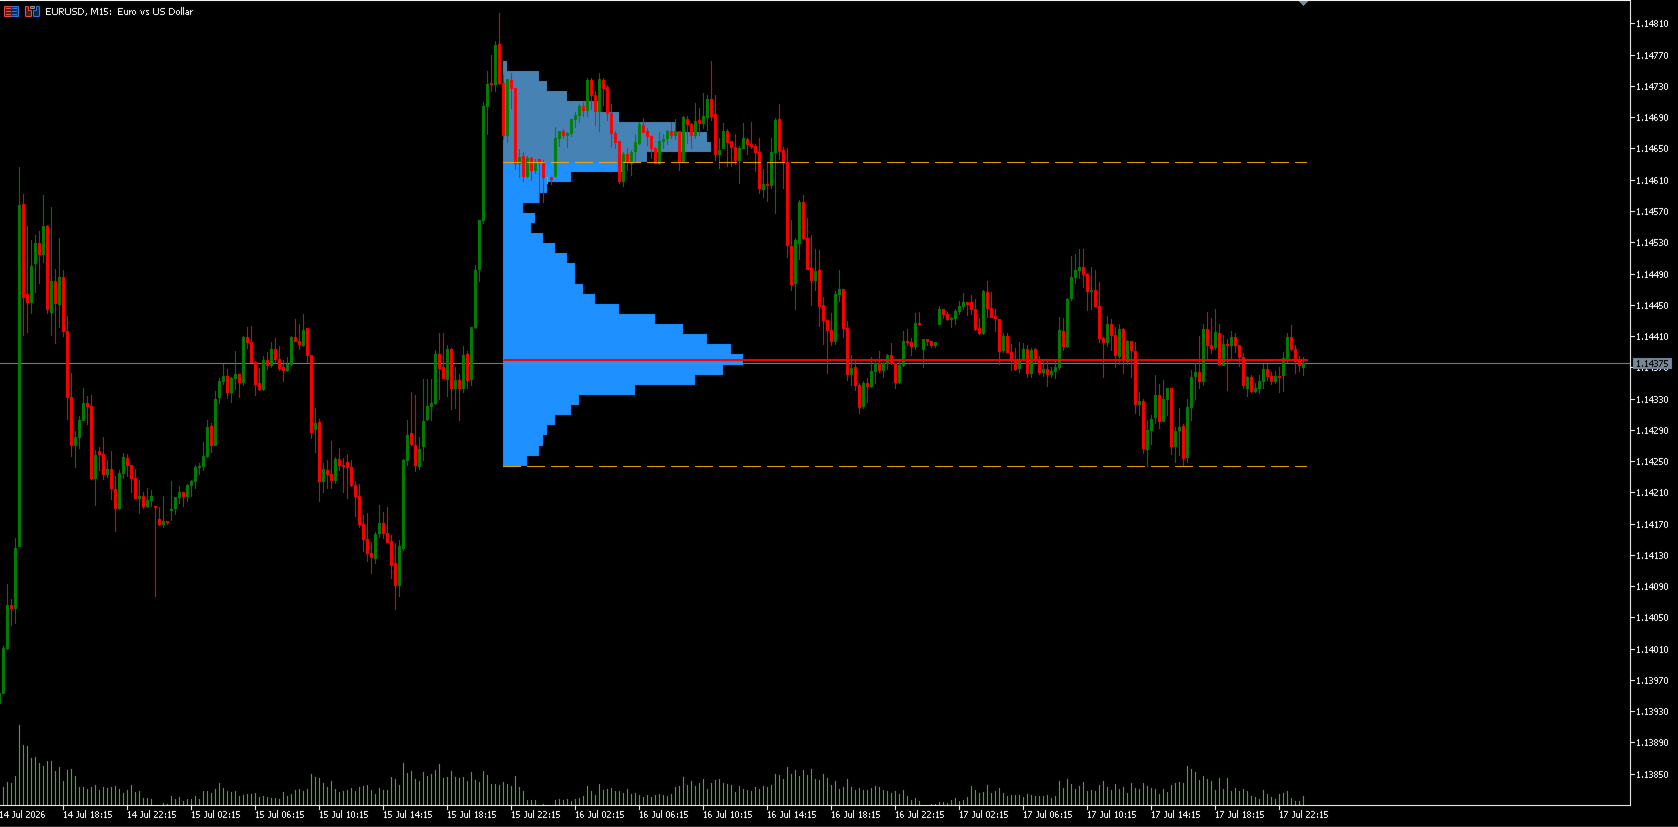
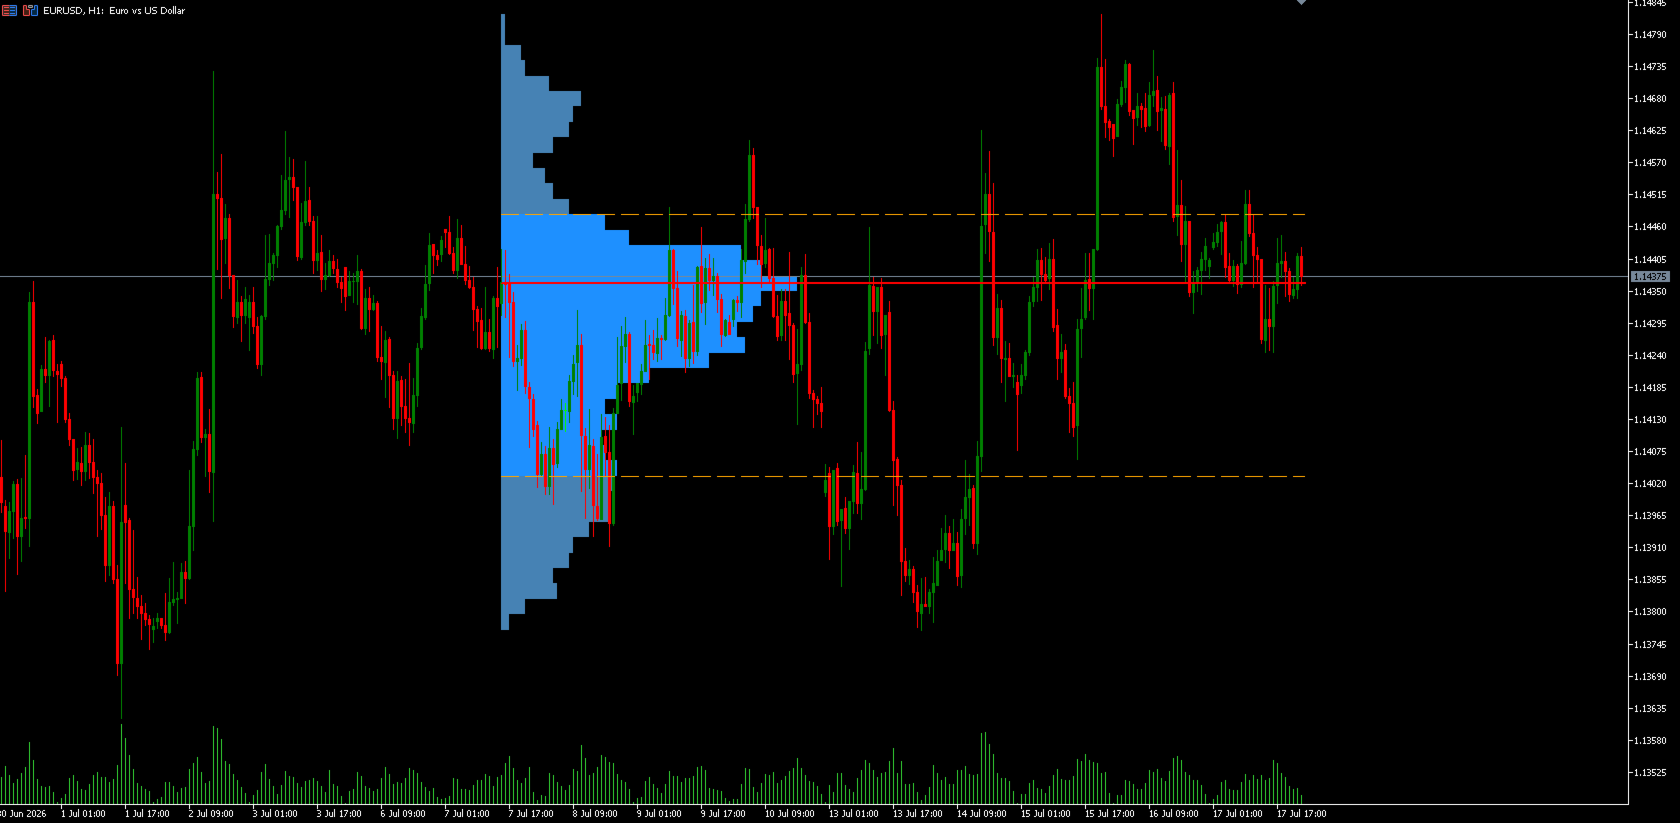
VolumaxProfile builds a real Volume Profile histogram directly on your chart, showing exactly where volume concentrated across price levels over your chosen lookback period. It automatically highlights the Point of Control (POC) and Value Area (VAH/VAL), giving you objective, data-driven support/resistance zones instead of subjective drawing.
How it works
- Scans the last N bars (Lookback_Bars) and splits the price range into rows (bins)
- Distributes each bar's volume (tick or real) across the price rows it touched
- Draws a horizontal histogram bar for each row, sized by volume concentration
- Identifies the POC (highest-volume row) and calculates the Value Area covering the configured percentage of total volume
- Rebuilds automatically on every new bar
Inputs
- Lookback_Bars: Number of bars used to build the profile
- Row_Count: Number of price rows (bins)
- Value_Area_Pct: Percentage of volume covered by the Value Area
- Max_Bar_Width_Px: Maximum width of histogram bars
- Show_POC: Toggle Point of Control line
- Show_Value_Area: Toggle VAH/VAL lines
- Use_Tick_Volume: Use tick volume or real volume
- Color_Profile: Histogram bar color
- Color_ValueArea: Value Area bar color
- Color_POC: POC line color
- Color_VAH_VAL: VAH/VAL line color
Recommended setup
Works on any symbol and timeframe. Best on liquid instruments (Forex majors, Gold, indices) with real or reliable tick volume. Intraday trading: M15-H1 with 100-300 bar lookback. No VPS required.
Screenshots
Screenshots show VolumaxProfile on a live chart with default settings, and the input panel with recommended values.
Disclaimer
For informational and educational purposes only. Past performance does not guarantee future results. Always test on a demo account before live use.