Forex Strength Matrix HeatMap
- Indicators
-
Xiaoyu Huang
 I have more than 10 years in the development of automated trading systems in the financial markets.
Focus on MQL5 and long-term stable profitability with large funds - Version: 3.0
- Activations: 20
Overview
Forex Strength Matrix HeatMap is a real-time currency strength heatmap indicator that calculates the percentage change between 8 major currencies (EUR, GBP, AUD, NZD, USD, JPY, CAD, CHF) in pairs, and visually displays their relative strength on the chart via an 8×8 matrix panel.
View the real-time status of 28 currency pairs at a glance. Red indicates bullish, blue indicates bearish, and the intensity of the color represents the magnitude of the move — quickly identify the strongest and weakest currencies to support your trading decisions.
Key Features
- Full Coverage of 28 Currency Pairs: All combinations of 8 major currencies with automatic detection of available pairs; unavailable pairs display N/A
- Automatic Reverse Pair Detection: When a direct pair is unavailable, automatically switches to the reverse pair and inverts the direction
- Color Gradient Heatmap: Colors smoothly transition from neutral (white) to bullish (red) or bearish (blue) based on the magnitude of the move
- Draggable Panel: The panel supports mouse dragging and can be freely placed anywhere on the chart
- Hover Tooltip: Hovering over any cell automatically displays the corresponding currency pair name
- Highly Customizable: Colors, cell size, calculation period, and color sensitivity threshold are all freely adjustable
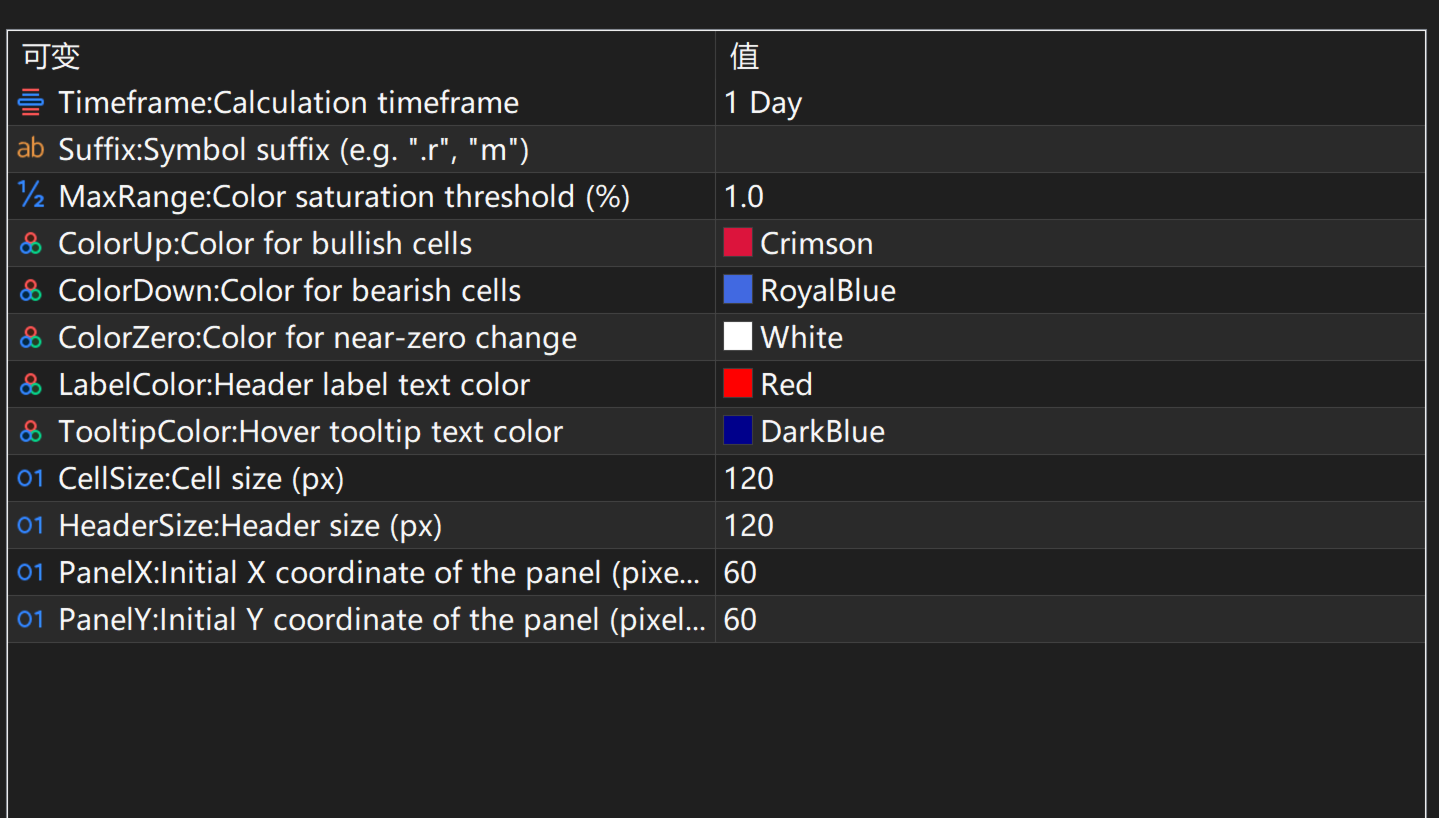
Input Parameters
| Parameter | Type | Default | Description |
|---|---|---|---|
| Timeframe | ENUM_TIMEFRAMES | D1 | Time period used for calculating percentage change |
| Suffix | string | (empty) | Symbol suffix, e.g. ".r", "m", to accommodate different broker naming conventions |
| MaxRange | double | 1.0 | Color saturation threshold (%), the move reaches full color intensity at this value |
| ColorUp | color | Crimson | Color for bullish (up) cells |
| ColorDown | color | RoyalBlue | Color for bearish (down) cells |
| ColorZero | color | White | Neutral color when the change is near zero |
| LabelColor | color | Red | Text color for the currency header labels |
| TooltipColor | color | DarkBlue | Text color for the hover tooltip |
| CellSize | int | 120 | Cell size (pixels) |
| HeaderSize | int | 120 | Header size (pixels) |
| PanelX | int | 60 | Initial X coordinate of the panel (pixels) |
| PanelY | int | 60 | Initial Y coordinate of the panel (pixels) |
How to Use
Installation
- Download the indicator file and copy it to the MQL5/Indicators directory
- Restart MetaTrader 5 or refresh the indicator list in the Navigator
- Drag the indicator onto any chart and the heatmap panel will display automatically
Signal Explanation
The heatmap displays relative currency strength through color and numerical values:
- Red cells: The row currency is gaining against the column currency — the deeper the color, the larger the gain
- Blue cells: The row currency is losing against the column currency — the deeper the color, the larger the loss
- White cells: The change is near zero, indicating balanced bullish/bearish forces
- Gray cells (diagonal): Same currency comparison (not meaningful, displays "-")
- Light gray N/A: The currency pair is not available with the current broker
Each cell displays a percentage value. For example, the EUR row and USD column showing "+0.35%" means EUR/USD is currently up 0.35%.
Usage Tips
- Recommended Timeframe: D1 (default) is suitable for assessing daily currency strength; H1 works well for intraday trading reference
- Applicable Instruments: Major forex currency pairs (combinations of EUR, GBP, AUD, NZD, USD, JPY, CAD, CHF)
- Complementary Use: Combine with trend indicators (e.g., MA,ADX) to confirm direction, then go long on the strongest currency and short on the weakest