FX Volume MT5
- Indikatoren
-
Daniel Stein
 Jedes Tool hier ist von einem Trader gebaut, der es selbst handelt.
 - Version: 4.95
- Aktualisiert: 8 April 2026
- Aktivierungen: 10
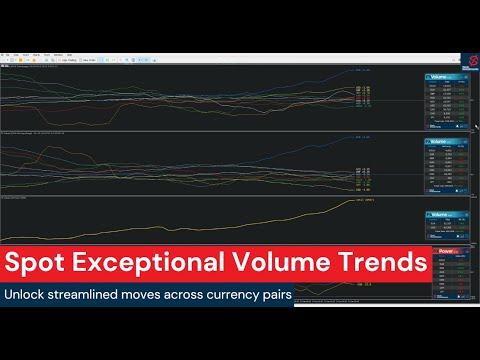
FX Volume: Erleben Sie den echten Marktüberblick aus der Sicht eines Brokers
Kurzüberblick
Möchten Sie Ihre Handelsstrategie auf das nächste Level bringen? FX Volume liefert Ihnen Echtzeit-Einblicke in die Positionierung von Retail-Tradern und Brokern — lange bevor verzögerte Berichte wie der COT verfügbar sind. Ob Sie nach beständigen Gewinnen streben oder einfach einen tieferen Vorteil am Markt suchen, FX Volume hilft Ihnen, große Ungleichgewichte zu erkennen, Breakouts zu bestätigen und Ihr Risikomanagement zu verfeinern. Legen Sie jetzt los und entdecken Sie, wie authentische Volumendaten Ihre Entscheidungen revolutionieren können!
1. Warum FX Volume für Trader besonders vorteilhaft ist
Frühwarnsignale mit überragender Genauigkeit
• Erhalten Sie nahezu in Echtzeit Informationen darüber, wie viele Trader jedes Währungspaar kaufen oder verkaufen — deutlich vor den meisten anderen.
• FX Volume ist das einzige Tool, das echte Volumendaten von mehreren Retail-Brokern zusammenträgt und in einem klaren, benutzerfreundlichen Format bereitstellt.Starkes Risikomanagement
• Erkennen Sie bedeutende Ungleichgewichte (long oder short), die oft auf mögliche Trendwenden hindeuten, und platzieren Sie Stopps und Ziele selbstbewusster.
• Authentische und exklusive Daten sorgen dafür, dass jede Handelsentscheidung auf verlässlicher Grundlage steht.Optimieren Sie Ihre Ein- und Ausstiege
• Identifizieren Sie „überfüllte“ Trades, bei denen die Mehrheit auf einer Seite festsitzt, und bestätigen Sie Breakouts mithilfe echter Volumenwerte.
• Vermeiden Sie irreführende Signale, die in Standardindikatoren häufig vorkommen, indem Sie sich auf tatsächliche Echtzeit-Flussdaten stützen.Funktioniert mit jeder Strategie
• Kombinieren Sie FX Volume mühelos mit Trendlinien, Unterstützungs-/Widerstandszonen oder anderen Indikatoren. Echte Volumendaten bieten eine einzigartige Bestätigungsebene, die Sie anderswo nicht finden.
2. Mehr erfahren bei Stein Investments
Bei Stein Investments bieten wir Ihnen:
• Expert Advisors und Indikatoren für diverse Märkte.
• Tutorials, Videos und Leitfäden, um Ihren Lernprozess zu beschleunigen.
• Eine unterstützende Community mit exklusiven Trading-Chats.
Besuchen Sie unsere Stein Investments Seite für Strategien, Updates und Ressourcen — damit Sie FX Volume optimal nutzen und Ihr Trading auf das nächste Level bringen.
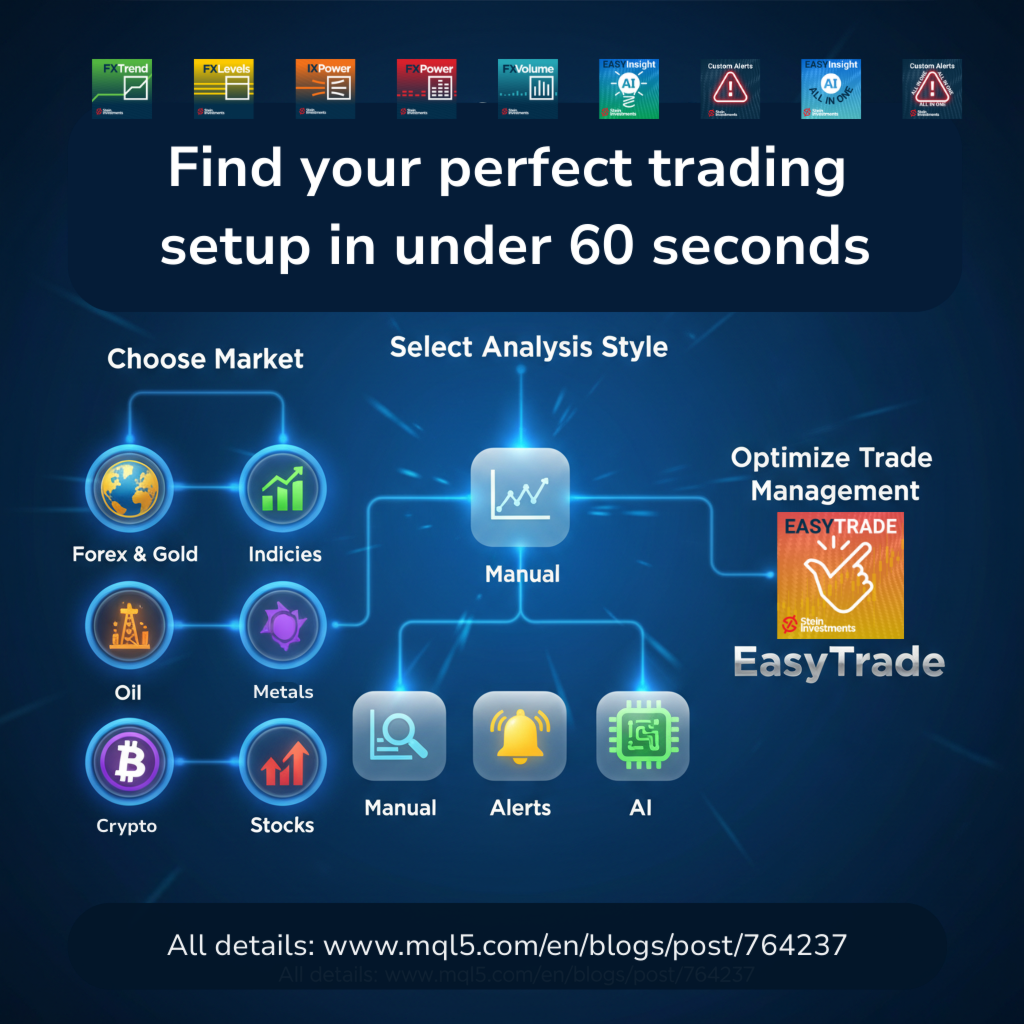
3. Wie Sie mit FX Volume starten
Fügen Sie die erforderliche URL hinzu
• Gehen Sie in Ihrem MetaTrader-Terminal auf Extras > Optionen > Expert Advisors und fügen Sie hinzu:
https://stein.investments
Dadurch kann FX Volume echte Marktdaten von unserem spezialisierten Datenzentrum abrufen.Installieren Sie SI Connect
• Öffnen Sie ein separates Chart (beliebiges Symbol/Timeframe).
• Fügen Sie dort SI Connect hinzu — dieses lädt automatisch alle Daten, die FX Volume benötigt.Fügen Sie FX Volume Ihrem Hauptchart hinzu
• Ziehen Sie FX Volume in das Chart, in dem Sie Echtzeit-Volumeninfos sehen möchten.
• Sie erhalten Einblicke zu Long-/Short-Verhältnissen, Gesamtvolumen und Nettopositionen — alles basierend auf exklusiven Daten mehrerer Broker.
4. Wie FX Volume funktioniert (kurze Erklärung)
Jeder Trade hat zwei Seiten
• Wenn Sie kaufen, verkauft ein Broker oder eine Institution — so entsteht die tatsächliche Marktposition auf der Gegenseite.Datenbeschaffung
• Wir sammeln echte, anonymisierte Volumendaten von Retail-Tradern und Retail-Brokern, ohne persönliche Informationen — nur authentische Volumenzahlen.
• FX Volume fasst diese Infos in einem verlässlichen Datenstrom zusammen, damit Sie genau sehen, wo die Marktteilnehmer stehen.Aggregation & Analyse
• Unser Datenzentrum verarbeitet kontinuierlich alle benötigten Infos für FX Volume.
• SI Connect lädt diese aufbereiteten Dateien herunter und aktualisiert sie laufend — ganz ohne zusätzlichen Aufwand für Sie.Konträre Perspektive (Contrarian)
• Sind 80 % der Retail-Trader im Long, stehen große Institutionen oft auf der Short-Seite. FX Volume macht solche Ungleichgewichte sichtbar und verschafft Ihnen den Klarheitsvorteil für stärkere Entscheidungen.
5. Praktische Einsatzmöglichkeiten von FX Volume
Überfüllte Trades erkennen
• Wenn sich die Mehrheit in Long oder Short drängt, könnte bald eine Marktwende bevorstehen.
• Unsere exklusive Datenquelle hilft Ihnen, solche Verschiebungen frühzeitig zu erkennen und entsprechend zu handeln.Breakouts bestätigen
• Ein Breakout, begleitet von steigendem Kauf-/Verkaufsvolumen, deutet oft auf eine kräftige Preisbewegung hin.
• Vertrauen Sie auf tatsächlich globale Retail-Volumendaten, um Breakouts glaubwürdiger zu validieren.Stop-Loss-Platzierung optimieren
• Volumenspikes markieren häufig Zonen, in denen große Akteure den Preis bewegen. Mit diesem Wissen platzierte Stopps reduzieren unliebsame Volatilität.Mit Price Action kombinieren
• Kombinieren Sie zentrale Unterstützungs-/Widerstandsbereiche oder Candlestick-Formationen mit den Echtzeitdaten von FX Volume für eine doppelte Bestätigung Ihrer Setups.
6. Einstellungen des FX Volume Indikators
Passen Sie FX Volume an Ihren bevorzugten Handelsstil an:
Broker DST Zone & GMT Shift
• Sorgen Sie dafür, dass Ihre Zeiteinstellungen zum Broker passen, um konsistente Volumendaten zu erhalten.Back Comparison In (Hours oder Minutes)
• Entscheiden Sie, ob Sie aktuelle Daten mit einem in Stunden oder Minuten gemessenen Intervall vergleichen möchten.Compare with X Units Back
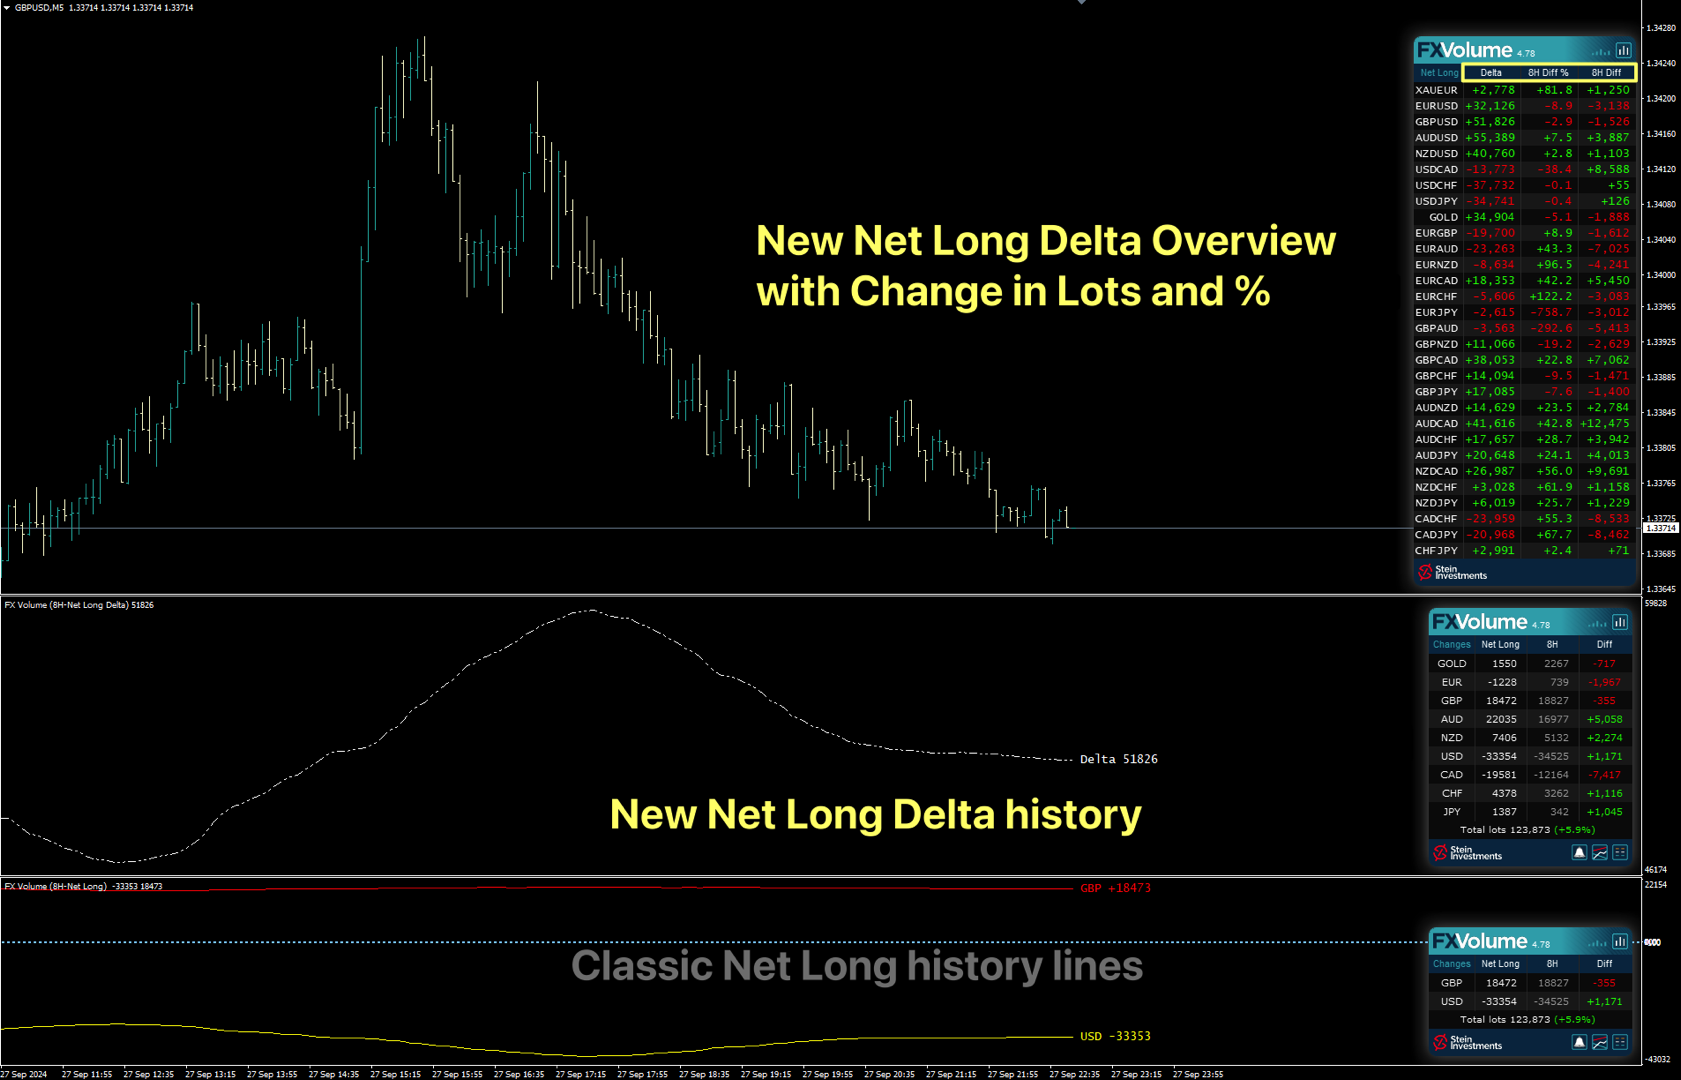
• Legen Sie fest, wie weit Sie zurückblicken (in Stunden/Minuten), um plötzliche Volumensprünge oder -rückgänge aufzudecken.Display All History Lines
• True: Zeigt historische Linien aller relevanten Währungen.
• False: Zeigt nur Linien für das aktuell gewählte Symbol.History Values
• Wählen Sie, welche Volumendaten Sie sehen möchten: Net Long, Long Volume, Short Volume oder Total Volume usw.Multi-Instance Settings
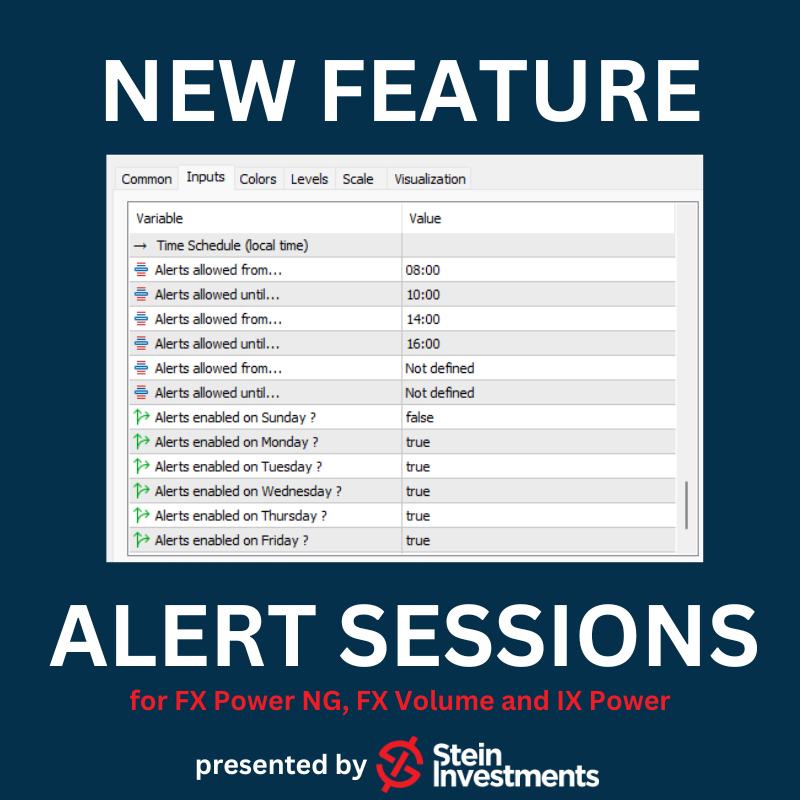
• Wenn Sie mehrere FX Volume Indikatoren in einem Fenster verwenden, vergeben Sie eindeutige IDs, um Konflikte zu vermeiden.Alert Settings
• Definieren Sie Volumenschwellen oder Spike-Alerts, damit Sie wesentliche Marktbewegungen rechtzeitig erkennen.Graphical Settings
• Passen Sie Farben, Linienstärke und Layout Ihrem persönlichen Chartstil an.Schedule
• Kontrollieren Sie, wann FX Volume Alarmmeldungen ausgibt, ideal für den Handel in bestimmten Sitzungen.
7. Weitere Informationen & Hilfe
• FX Volume FAQ: Werfen Sie einen Blick auf unsere FX Volume FAQ, um mehr zu erfahren oder Probleme zu lösen.
• Community Chat: Treten Sie unserer privaten Gruppe bei, um Strategien auszutauschen, Fragen zu stellen und sich mit anderen FX Volume Anwendern zu vernetzen.
• Support: Brauchen Sie Hilfe oder haben Fragen? Kontaktieren Sie uns. Wir unterstützen Sie gern.
Bereit, Ihr Trading zu transformieren?
• Zugriff auf exklusive Daten: Wir sammeln echte Volumendaten von mehreren Retail-Brokern und decken so die tatsächliche Marktlage auf.
• Handeln Sie mit mehr Präzision: Bestätigen Sie Sentiment, erkennen Sie Umkehrpunkte und stützen Sie Ihre Strategien auf Live-Daten in hoher Qualität.
• Werden Sie Teil der Stein Investments Community: Nutzen Sie unsere Tools, Guides und ein unterstützendes Netzwerk, um Ihre Tradingziele sicher zu verfolgen.
Zögern Sie nicht! Installieren Sie FX Volume noch heute und erleben Sie die bahnbrechende Kraft echter Volumendaten — sichern Sie sich den Vorteil und heben Sie jeden Trade auf ein höheres Niveau.
Viel Erfolg beim Trading!
Daniel & Alain


Really very accurate, just the fact that this indicator is linked to a data center where the data is transmitted and sent gives us a real sense of the volume where forex pair trades are concentrated. It's extraordinarily good.