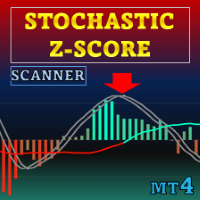
Stochastic Z Score MT4 Scanner
- Indicators
-
Duc Hoan Nguyen
 I develop practical trading tools for MetaTrader 4/5, with a focus on indicator integration, Multi-Timeframe analysis, market scanning, and automated trading solutions.
My work mainly includes:
• Indicator-to-EA Solutions - Version: 1.10
- Updated: 1 September 2025
- Activations: 10
New tools will be $30 for the first week or the first 3 purchases!
Trading Tools Channel on MQL5: Join my MQL5 channel to update the latest news from me
See more MT5 version at: Stochastic Z Score MT5 Scanner
See more MT4 version at: Stochastic Z Score MT4 Scanner
See more products at: All Products
Overview
Stochastic Z-Score is a momentum oscillator that blends a volatility-normalized Z-Score with stochastic logic and smooths it using a Hull Moving Average (HMA).
It converts price deviations into a normalized signal, with a long-term ALMA component providing additional context.
The result is an oscillator designed to reflect imbalances.
Visualization elements include colored histograms, dynamic bands, and reversal labels.
-
A Z-Score compares price with its mean and scales it by standard deviation to show how far current price has moved from typical values.
-
Passing that Z-Score through a stochastic function bounds the signal for interpretation.
-
HMA smoothing reduces noise.
-
A long-term ALMA of the Z-Score acts as a trend filter.
-
The tool is intended for use across different symbols and timeframes.
-
Z-Score histogram (optional) with a gradient to show deviation intensity.
-
Primary oscillator line (smoothed stochastic Z-Score).
-
Levels at overbought (default +2) and oversold (default −2).
-
Long-term momentum line (ALMA) with contextual coloring for trend phases.
-
Reversal markers when short-term crosses occur at extremes with supporting long-term momentum.
-
Built-in alerts for momentum shift, zero-line crosses, overbought/oversold entries, and trend alignment.
The scanner can be enabled or disabled to monitor other charts.
Available alerts include:
-
Up/Down label appears
-
Momentum Shift label appears
-
Oscillator crossed above/below the zero line (bullish/bearish state)
-
Long-term momentum (ALMA) crossed above/below the zero line
-
Oscillator entered overbought (default > 2.0) / oversold (default < −2.0) zone
These alerts are available when using the scanner.
Usage
Use the oscillator to track momentum shifts and review threshold crosses.
A rise that crosses above the previous value—especially from below oversold (default −2)—combined with an ALMA above zero marks a bullish state; the reverse marks a bearish state.
Reversal labels appear only when both short- and long-term conditions align.
Treat overbought and oversold levels as warning zones:
-
Values inside indicate typical ranges.
-
Moves beyond indicate stretched states.
Adjust the length parameter to match the asset’s volatility.
Enable the histogram to examine raw Z-Score movements.
Configure alerts to be notified of key momentum changes and zone entries.





























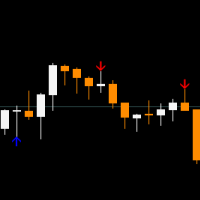





























Indicateur intéressant mais avec (quelques faux signaux : 1 signal sur 3) malgrès que l'indicateur confirme son signal entrée à l'achat ou à la vente. Il ne filtre pas assez les signaux.
Il est important de préciser que Stochastic Z Score MT4 Scanner n’est pas conçu pour remplacer l’analyse du trader ni pour prendre automatiquement tous les signaux affichés. Son objectif principal est de scanner rapidement plusieurs symboles et unités de temps afin d’identifier les zones où les conditions Stochastic + Z-Score deviennent intéressantes.
Un signal confirmé signifie que les conditions de l’indicateur sont réunies, mais cela ne signifie pas qu’il faut entrer immédiatement sur chaque signal. Le véritable avantage du scanner est justement de vous faire gagner du temps dans la recherche des opportunités, puis de vous laisser filtrer les meilleurs setups selon le contexte du marché.
Pour améliorer la qualité des entrées, je recommande par exemple de privilégier les signaux dans le sens de la tendance principale, d’éviter les marchés trop plats, de vérifier les supports/résistances et, si nécessaire, de confirmer le setup sur une unité de temps supérieure.
En utilisant le scanner de cette manière, vous pouvez éliminer vous-même une partie importante des signaux moins intéressants et vous concentrer uniquement sur les configurations les plus propres.
Aucun indicateur ne peut supprimer 100 % des faux signaux, mais un bon scanner doit surtout aider le trader à trouver plus vite les bonnes zones et à prendre de meilleures décisions. Merci encore pour votre retour, il est très utile pour les prochaines améliorations.