Smoothed Gaussian Trend Filter MT5 MTF Scanner
- Indicators
-
Duc Hoan Nguyen
 I develop practical trading tools for MetaTrader 4/5, with a focus on indicator integration, Multi-Timeframe analysis, market scanning, and automated trading solutions.
My work mainly includes:
• Indicator-to-EA Solutions - Version: 1.0
- Activations: 10
See the MT5 version at: Smoothed Gaussian Trend Filter Multi TF Scanner
See the MT4 version at: Smoothed Gaussian Trend Filter Multi TF Scanner
See more products at: All Products or Trading Indicators, Special Offers & New Releases
New tools will be $30 for the first week or the first 3 purchases!
Trading Tools Channel on MQL5: Join my MQL5 channel for the latest news from me
A useful trend curve should show both the prevailing direction and when short-term movement starts to disagree with it. This toolkit combines a filtered curve, signals and multi-market monitoring within one observation process.
Read the full indicator logic and usage guide
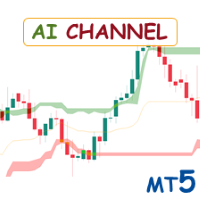
Smoothed Gaussian Trend Filter Multi TF Scanner is a trend-monitoring indicator combining Gaussian filtering and linear regression smoothing, Buy/Sell arrows directly on the curve, three color phases and optional Trailing Bands. Scanner and Multi-TF extend your observation to multiple symbols and timeframes.
Main components
- Gaussian curve: defaults are Gaussian Length 15, Poles 3, Smoothing Length 22 and Flatten Multiplier 7. The last parameter is a regression evaluation offset, not a price multiplier or a prediction of future prices.
- Trend phases: a custom Supertrend reference uses a distance of 0.15 × ATR(21) around the filtered curve. The trend is bullish when the curve is above the reference and bearish otherwise. Gray appears only with Mid-Trend Signals enabled and when slope disagrees with trend direction.
- Buy/Sell: by default, events mark bearish→bullish or bullish→bearish direction changes. Enabling Mid-Trend Signals changes the rule to leaving a ranging phase: the previous bar was ranging and the current bar is not; the arrow follows the current trend and is anchored directly to the Gaussian curve.
- Trailing Bands: a lower band in bullish trends and an upper band in bearish trends, two smoothed candle-body distances from the Gaussian curve. Body Distance MA defaults to SMA(100), with selectable MA methods and tick/real volume for VWMA. Bands are hidden by default; they are not ATR bands or automatic stop-loss orders.
Alerts and developing signals
The four alerts, Buy, Sell, Choppy Market and End of Choppy Market, use closed bars. Choppy Market reports each qualifying ranging bar; End of Choppy Market reports when that state ends. Both Choppy alerts require Mid-Trend Signals to be enabled.
Curves and arrows on the open bar can change or disappear as prices update. The filter and regression need sufficient history to initialize; Trailing Bands may need additional data for the candle-body MA.
Scanner and Multi-TF
Monitor multiple symbols and timeframes in the Scanner table, display another timeframe's data on the current chart and use separate parameters per timeframe. The default list is M1, M5, M15, M30, H1, H4, D1, W1; the Scanner supports up to 10 timeframes. Shared instructions are linked in the Multi-Timeframe & Scanner guide above.
How to use it
- Choose Gaussian Length, Poles, Smoothing Length and Flatten Multiplier for your observation horizon; the defaults provide a starting point for assessing the curve's response.
- Choose the Mid-Trend Signals mode first: off for direction changes, or on for the gray phase and signals when disagreement ends. These are two different signal rules.
- Enable Show Scanner when you need the monitoring table, select symbols/timeframes and open a chart to inspect the curve, arrows and price context. Use Multi-TF for context without requiring simultaneous signals across every timeframe.
- Enable alerts for the current symbol or Enable alerts for all Scanner symbols, then choose alert types and message/push/email/sound channels. Both alert-scope switches and Show Scanner are off by default.
Display customization
Options include arrow visibility, codes, colors and widths; line colors, transparency, styles and widths; and timeframe labels with a countdown. Bullish/bearish Gaussian transparency defaults to 50%, gray to 0%, and Trailing Bands to 90%. Phase colors are fixed rather than volume-dependent. Hiding drawings does not disable signal calculation.
Ranging describes disagreement between slope and trend direction, not confirmation that price is inside a fixed box. The indicator provides analytical information and does not place orders automatically.