KT Trend Reversal Probability MT4
- Indicators
-
KEENBASE SOFTWARE SOLUTIONS
 Keenbase Trading develops professional MetaTrader 4 and MetaTrader 5 indicators and Expert Advisors designed to help traders make more informed trading decisions.
 - Version: 1.0
- Activations: 10
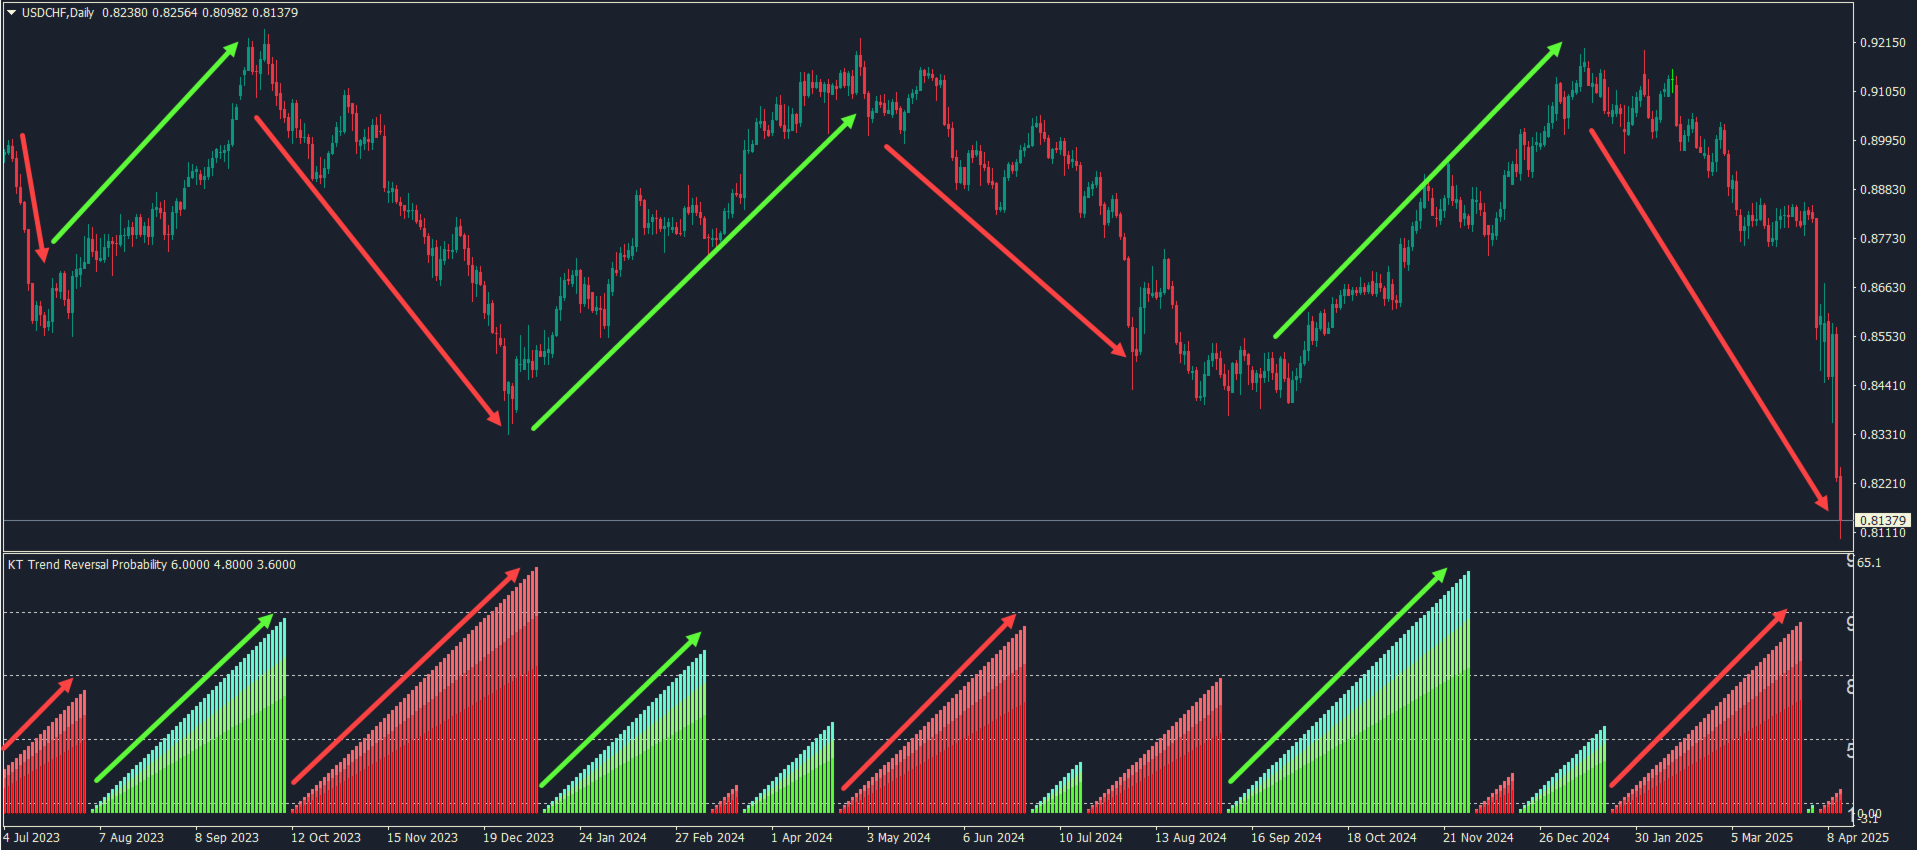
The KT Trend Reversal Probability calculates the real-time probability of a trend reversal using a refined RSI-based algorithm. Displayed as a clear percentage, this probability helps you gauge when an ongoing trend is losing steam or when a new one is likely forming.
Whether you’re planning your entries or tightening your exits, this indicator brings a data-backed edge to your trading decisions.
Features
- Displays a clear probability percentage directly on the oscillator, helping traders anticipate potential reversals ahead of time.
- Uses a custom-built oscillator that blends fast and slow RSI signals to detect potential reversals with minimal lag.
- Uses intuitive color gradients to visually represent reversal probabilities—from weak to strong—making it easy to read at a glance.
- Sends alerts when reversal probabilities reach critical levels or when a potential new trend begins—so you never miss a key market shift.
- Lets you customize everything—from oscillator periods to probability thresholds—so you can fine-tune the indicator to match your trading style.
How it Works
It operates on a custom-built oscillator that measures trend momentum and strength using a unique calculation approach. Instead of relying on traditional inputs, it analyzes price behavior to estimate when a trend is likely to lose steam.
By studying the timing of past reversals and the rhythm of market moves, the indicator builds a statistical profile of trend lifespans. A dynamic probability engine then evaluates how likely it is for the current trend to reverse, displaying the result in a clean data table. When those probabilities hit critical levels, instant alerts help you respond before the shift happens.
Combining with Other Indicators
While the indicator can stand alone, combining it with other tools—like volume analysis, support/resistance zones, or price action patterns—can further increase the accuracy of your signals.
The key is to avoid overlapping indicators that tell the same story. Instead, pair it with complementary tools that offer different perspectives. This approach gives you a sharper, more reliable edge without cluttering your chart or over-complicating your decisions.
Avoid using multiple indicators that deliver the same type of signal—it adds noise, not clarity. Think of the probability model like a market forecast—it won’t guarantee the next move, but it gives you a reliable estimate of when a reversal is likely, helping you trade with more confidence.