Dashboard Scanner Kalman MT5
- Indicators
- Agus Santoso
- Version: 1.5
- Updated: 13 June 2025
- Activations: 20
MT4 Version https://www.mql5.com/en/market/product/129411
MT5 Version https://www.mql5.com/en/market/product/129412
Dashboard Scanner Kalman – Multi-Pair, Multi-Timeframe Scanner
All-in-One Scanner for Smart Trend Detection Using Kalman Filter Technology
Dashboard Scanner Kalman is an advanced scanner based on the modified Kalman Filter Trend Levels algorithm, designed to monitor trend direction, signal levels, and trend strength across multiple timeframes and multiple symbols simultaneously.
Whether you're a scalper, swing trader, or trend follower – this dashboard provides a real-time bird’s-eye view of market conditions, helping you make faster and more accurate trading decisions.
Key Features
1. Kalman-Based Trend Analysis
Utilizes the Kalman filter to dynamically adapt to price movements, smoothing trends while reducing noise. This ensures accurate identification of trend levels and pivotal zones.
2. Support & Resistance Detection
- Automatically calculates key support and resistance levels based on Kalman-filtered price action.
- Highlights levels where price is crossing or retesting, enabling quick decision-making for potential trade setups.
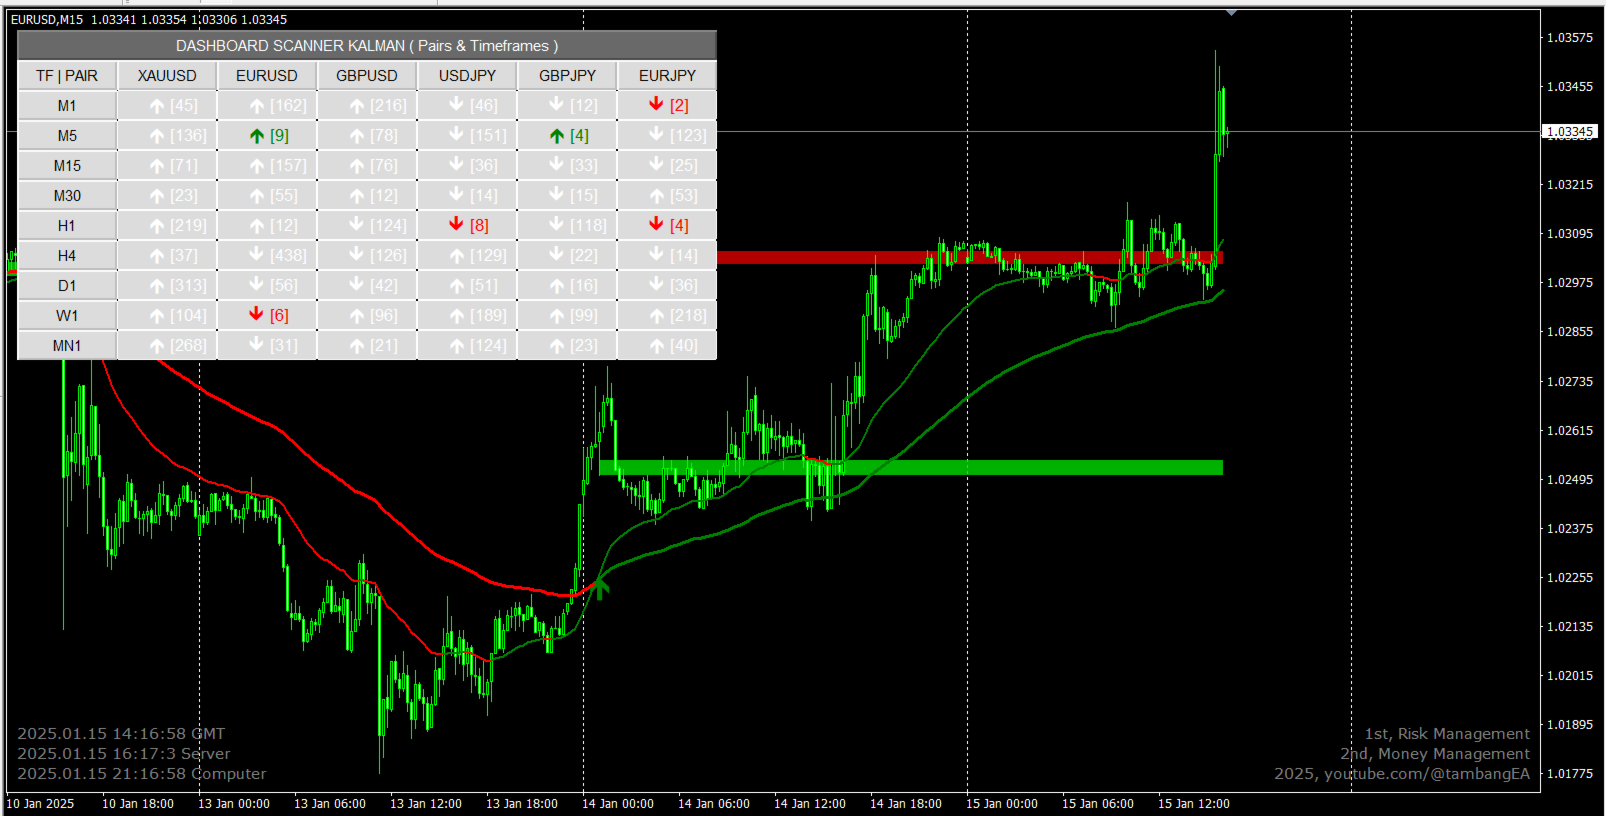
3. Multi-Symbol & Multi-Timeframe Dashboard
- Displays the status of multiple symbols and timeframes in a single, intuitive interface.
- Clear visual indicators show:
Crossing levels: Price breaking through significant support/resistance zones.
Retest levels: Price revisiting these zones, confirming their validity.
4. Real-Time Alerts
- Provides real-time alerts (on-screen, email, or push notification) when a crossing or retest occurs.
- Alerts include symbol, timeframe, and action type for precise tracking.
5. Customizable Filters
- Allows you to set thresholds for sensitivity to trend levels and support-resistance calculations.
- Focus on specific timeframes or symbols of interest based on your strategy.
6. Visual Insights
- Color-coded signals for quick comprehension:
Green for bullish crossings/retests.
Red for bearish crossings/retests.
7. Scalable for Multiple Strategies
Whether you're trading breakouts, retests, or trend continuations, the Dashboard Scanner Kalman adapts to your needs, offering unparalleled flexibility.
How It Works
1. The Kalman filter processes price data, identifying trend levels and significant support-resistance zones.
2. The dashboard aggregates data from selected symbols and timeframes, displaying them in an easy-to-read grid.
3. Real-time monitoring ensures you are immediately informed of potential trade setups:
- Crossing events: Strong trend momentum when price breaks support/resistance levels.
- Retest events: Validation of levels as price revisits them before continuation.
Ideal For
- Traders seeking an efficient way to monitor multiple pairs and timeframes simultaneously.
- Those who value precision in identifying high-probability zones for entries and exits.
- Scalpers, swing traders, and trend followers who rely on robust support-resistance frameworks.
Conclusion
The Dashboard Scanner Kalman is a must-have tool for traders looking to combine cutting-edge Kalman filtering techniques with a robust support-resistance strategy. It eliminates the need for constant chart switching, offering a streamlined approach to identifying profitable opportunities with clarity and precision.