PL Graph Visualizer MT4
- Utilities
-
Sajiro Yoshizaki
 The best way to Master Trading with PracticeSimulator - the ultimate tool for mastering trading strategies! Whether you're a beginner or an experienced trader, this tool helps you practice, learn, and refine your skills in a completely risk-free environment.
Why Choose PracticeSimulator? - Version: 1.5
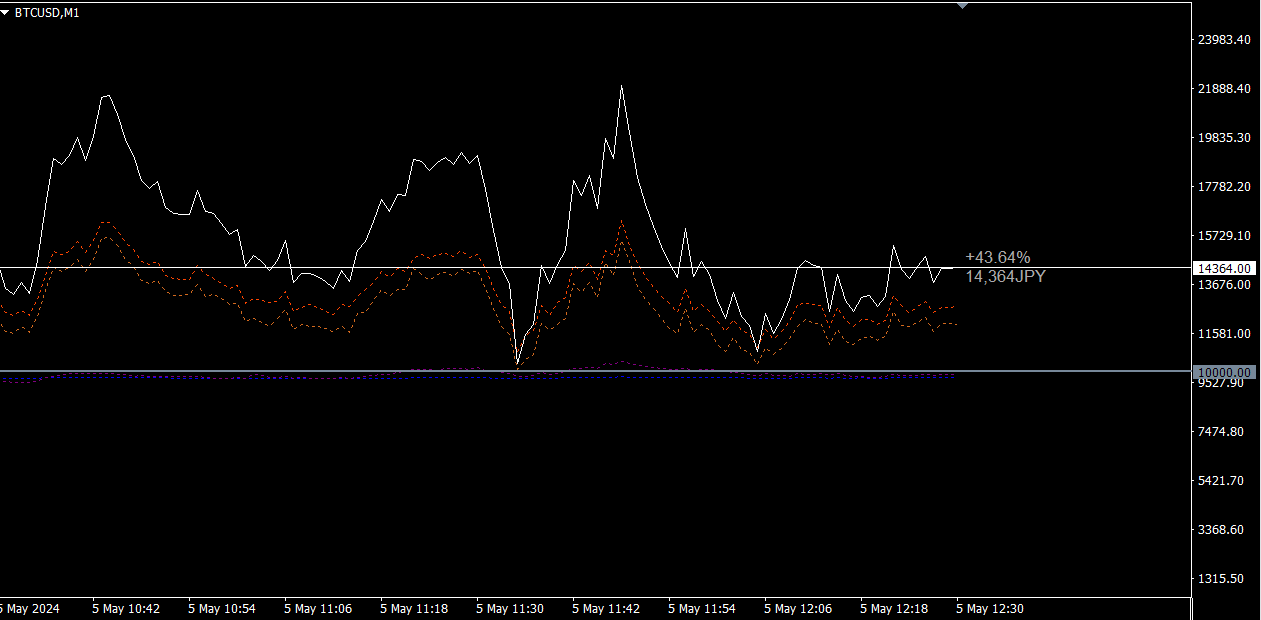
PL Graph Visualizer is a utility that displays real-time graphs of your account's profit and loss.
The graph can be viewed separately by currency pair or by magic number, allowing you to see the changes in profit and loss of each position at a glance.
This tool can be used in conjunction with the integrated close tool, which can be found here, to further enhance its functionality.
The real-time graphs show not only the total profit and loss of the account, but also the profit and loss status of multiple currency pairs, allowing traders to instantly grasp detailed changes, aiding decision making and making trading more effective.
Enhance your trading strategies with real-time profit/loss visibility.
This tool generates charts in real time, so if you close the chart, change the time frame or restart MT4, the chart will be re-generated from the latest data.
more detailed information:
https://www.mql5.com/en/blogs/post/757410