ArwByIdx MT5
- Indicators
-
Sajiro Yoshizaki
 The best way to Master Trading with PracticeSimulator - the ultimate tool for mastering trading strategies! Whether you're a beginner or an experienced trader, this tool helps you practice, learn, and refine your skills in a completely risk-free environment.
Why Choose PracticeSimulator? - Version: 2.14
- Updated: 3 May 2024
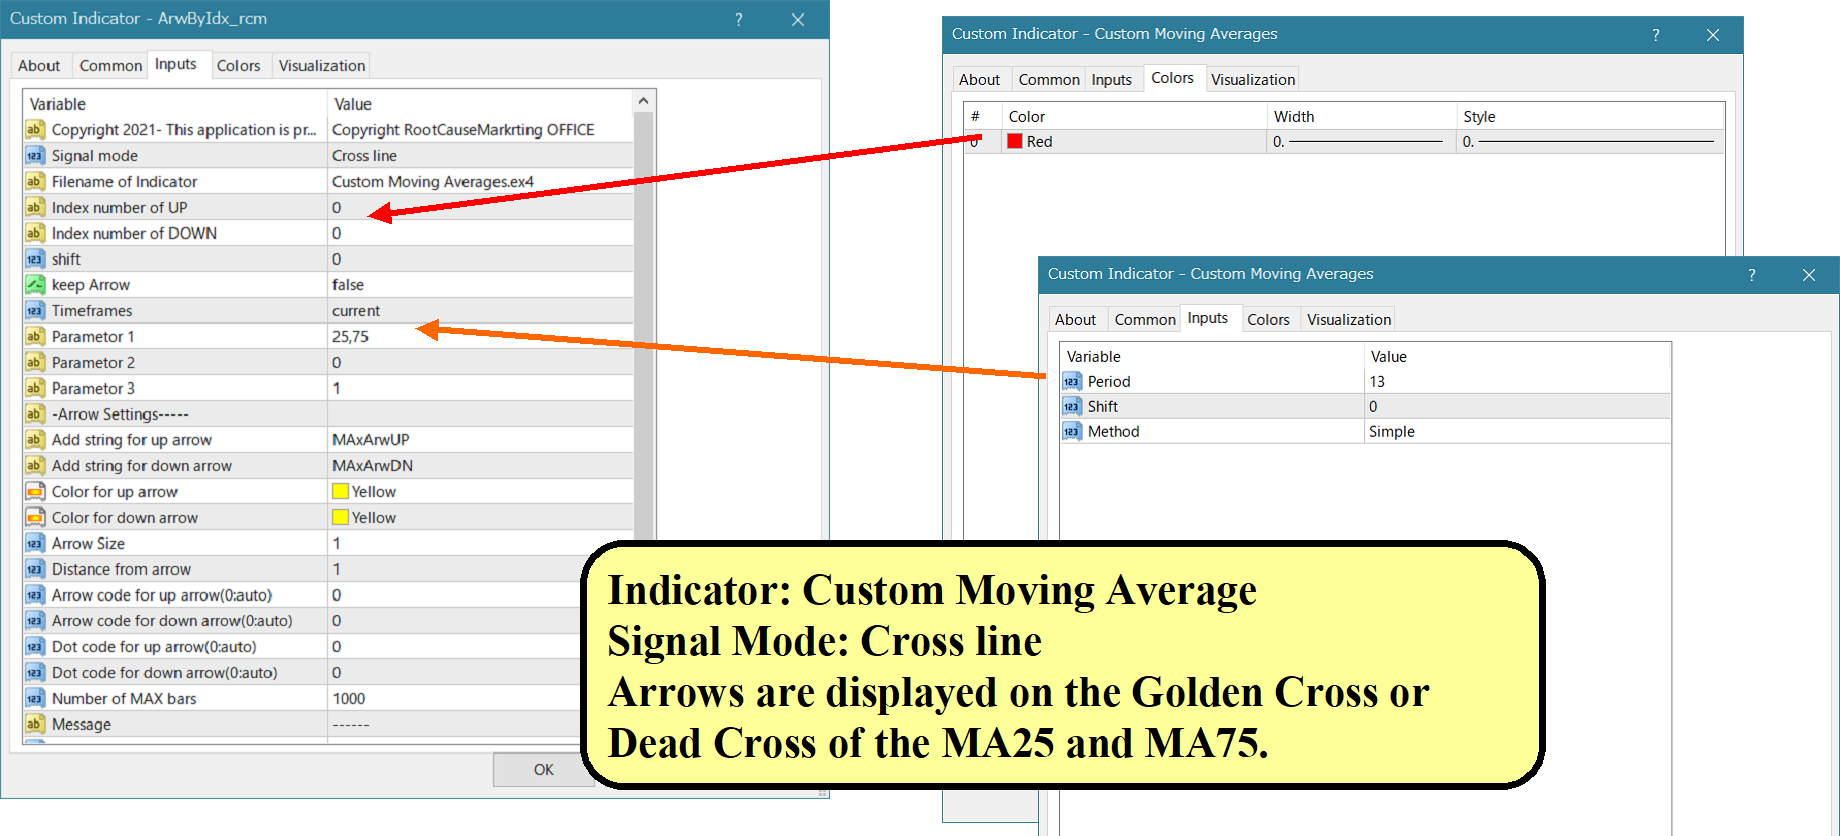
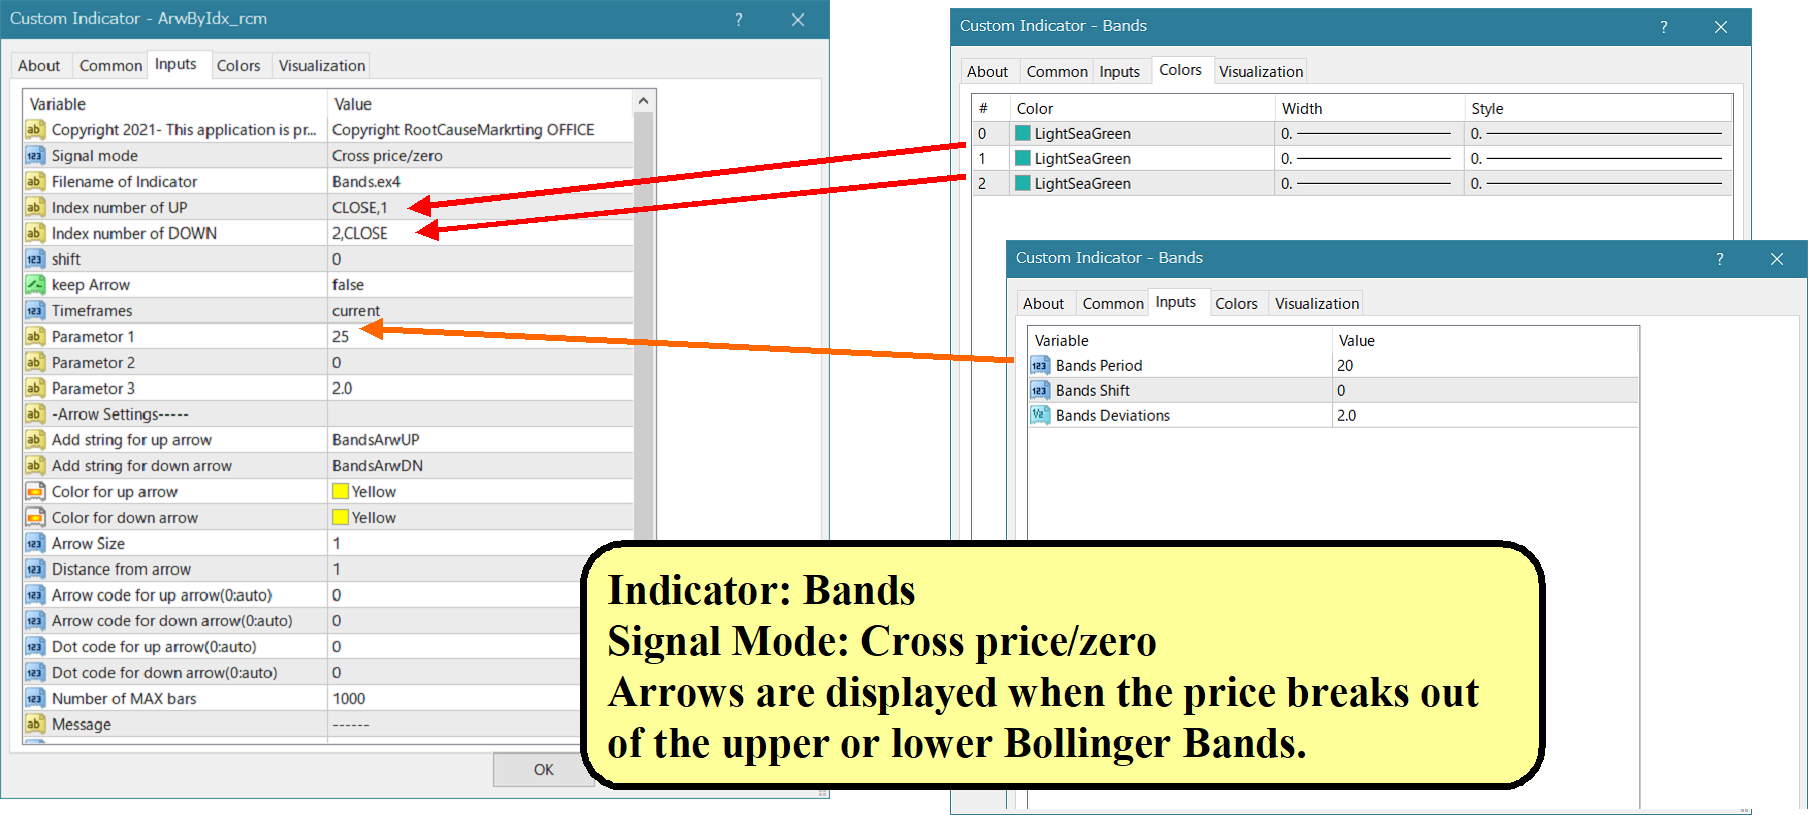
This product receives information from indicators/signal tools and displays arrows or notifications when specific conditions are met.
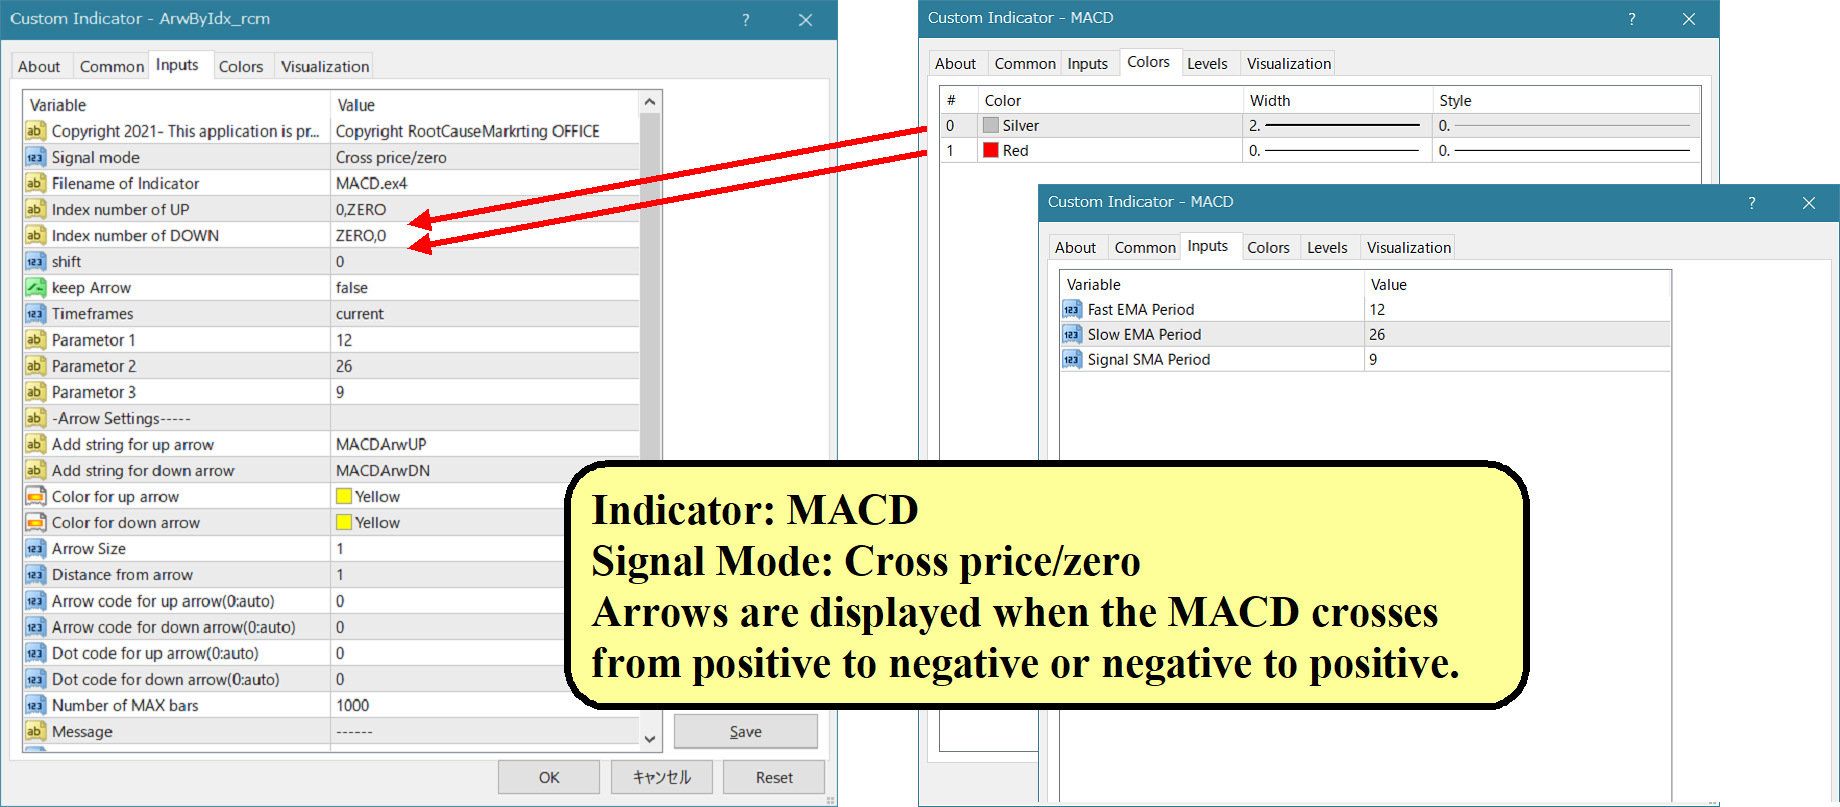
For example, arrows and notifications are shown when MA25 and MA50 cross, when SAR reverses, when MACD changes its plus/minus, or when the closing price crosses the Bollinger Bands.
Please refer to the sample settings image for specific configurations.
For detailed manuals and configuration files:
https://www.mql5.com/en/blogs/post/755082
A free version is also available for download.
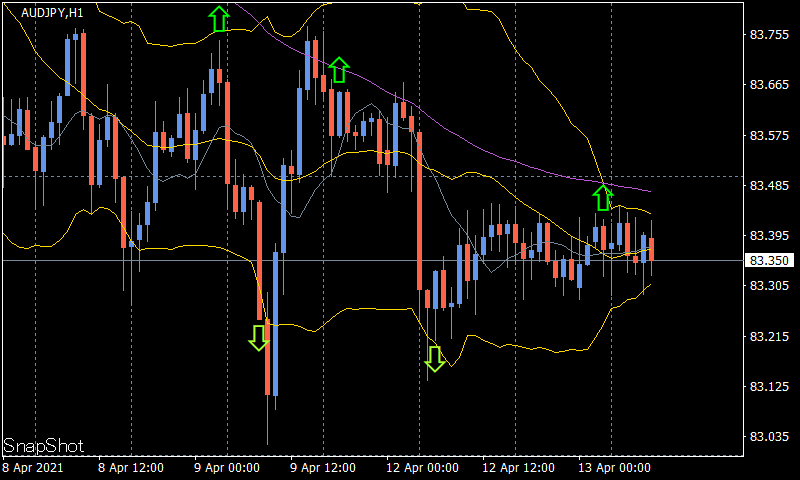
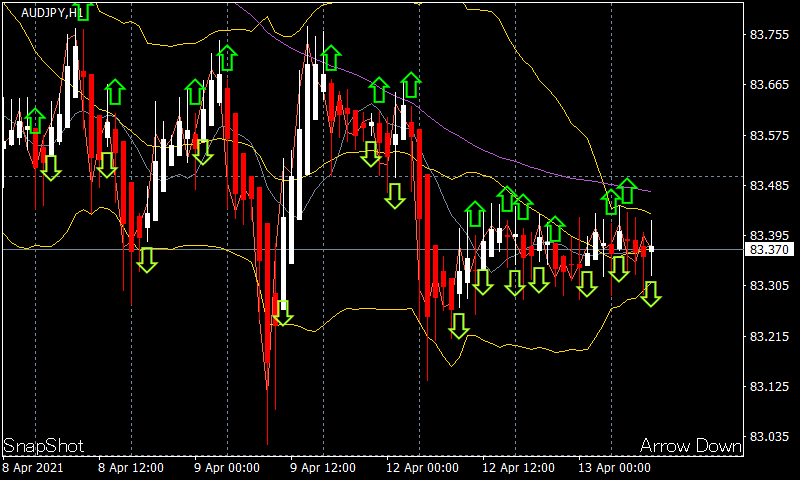
The arrows can be displayed in a variety of configurations, and the combinations are as limitless as your imagination.
If you are having trouble setting up the linkage to signal tools and indicators, please contact us for assistance.
We can also push notifications to smartphones, email, Slack, Line, Discord, etc., add up to 8 parameters, or link to indicators on an individual basis if you request it. You can use it as a supplement to your signal tools or as a notification function for events.
https://www.mql5.com/en/users/mt4kabukimono

User didn't leave any comment to the rating