Watch the Market tutorial videos on YouTube
How to buy а trading robot or an indicator
Run your EA on
virtual hosting
virtual hosting
Test аn indicator/trading robot before buying
Want to earn in the Market?
How to present a product for a sell-through
Expert Advisors and Indicators for MetaTrader 4 - 51

Uncomplicated straightforward indicator that shows the maximum account drawdown since the indicator was added to the chart. The indicator does not take transaction history into account since it is impossible to calculate drawdown from historical entries en closures of trades. The indicator will be free in this basic form. Eventually it will be developed but the focus is to keep it plain and simple.
FREE
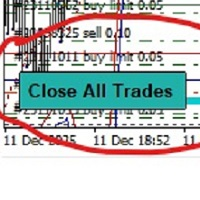
-Product Description- This close_all_entry button can use to close all your active entry with profit or lose . Button can't use to delete all your pending order . Just one click can close all active entry , no need anymore to close one by one . Maybe get some delay to close all your active entry . Just trade with amount you dare to lose . o.o.o.o.o.o.o.o.o.o.o.o.o.o.o
FREE
The one and only indicator that identifies Volatility Squeeze.
A Squeeze is a compression of volatility in the market.
If this compression of volatility reaches a certain percentage it means that the market could explode in moments.
I highly recommend using the indicator in conjunction with the economic calendar.
If there are important news and the indicator shows a BLUE HISTOGRAM on the exchange in question, a sign of a powerful compression of volatility.
Then get ready to grasp the next
FREE

Current indicator shows the trading sessions for the major financial centres: London New York Tokyo Sydney There are available two types of displaying zones: in sub window below the chart and on the chart. When the subwindow is selected, the sessions are shown in the form of bars. If the sessions are shown on the main chart, they are displayed in the form of lines at the open price of the session that may also act as a support and resistance for further price action during the trading day. The
FREE
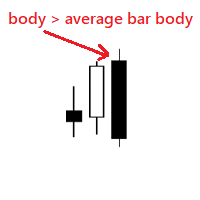
Very simple indicator that shows if body of a new bar is bigger than the average bar body. We can use the indicator to notice bars that are bigger than usual, for example this could mean a new trend. Input params: history bars to display from how many bars to get the average bar body To calculate only bars from the same type distance for the dots bull color bear color dot size
FREE

Traders Dynamic Index (TDI) Signal Input parameters: signal mode: set it to true if you want to plug it into STAT (Signal Tester and Trader) arrow shift: distance between fast EMA line to arrow on chart middle band filter price line filter RSI period RSI price method Volatility period MA period 1 MA period 2 Averaging method You can find the best setting for 4 hour EURUSD on this video
FREE

Highly configurable Demarker indicator.
Features: Highly customizable alert functions (at levels, crosses, direction changes via email, push, sound, popup) Multi timeframe ability Color customization (at levels, crosses, direction changes) Linear interpolation and histogram mode options Works on strategy tester in multi timeframe mode (at weekend without ticks also) Adjustable Levels Parameters:
Demarker Timeframe: You can set the lower/higher timeframes for Demarker. Demarker Bar Shift: Y ou
FREE

THE LiveExpertVisitor
Please make this Change than the Robot Work. Stop Loss to 60 or higher and Take Profit to 2000 or 1000. Indize: DE40, US30 “IC Market or FTMO” Recomment Broker. This EA „LiveExpertVisitor“ BUY and SELL in one.
Only DE40 with this Standart Settings Stopp Loss 50 Take Profit 2000 or 1000.
For other Indizes or Pairs Set the Stopp Loss to actuall Spread and maximal the Take Profit x40 to Spread Points.
-Recomment M5
-minimum 1000$/€ ...Lot 1 in first Week
Strong Code for Err
FREE

Retracement Reversal and Support and Resistance Pro is based on a formula used by Proprietary trading firms and other big institutions on WallStreet including on my Company and used by my traders here in the capital of the world. This indicator will create Red and Green arrows on a possible mayor Retracement level, Reversal Level and future Support and Resistance levels and Yellow arrows on a possible m i nor Retracement level, Reversal Level and future Support and Resistance levels . This in
FREE
This EA is a set n forget type. Once attached to GOLD / XAUUSD chart, you can forget it. ========== Broker recommended (EA tuned) > JustMarket (fully tested & optimized) Register using this link & get 50% auto rebate with daily reimbursement > https://one.justmarkets.link/a/6dgco0za1a Change your current IB to me & get 50% auto rebate with daily reimbursement. Visit this link for instructions > https://t.me/ea1234x/1 ========== Leverage recommended > 1:500 TF > H1 (auto set & lock by this EA)
FREE

MACD Trend FREE is Expert Advisor for EURJPY based on MACD Indicator . You can completely edit settings of MACD Indicator, TakeProfit, StopLoss and TrailingStop. Default paramters are optimized for best results. But you can test other settings for antoher currency pairs or timeframe. MACD Trend FREE has been tested from year 2003 to 2021 . My test used the real tick data with 99,90% accuracy. Doesn't use Martingale or other dangerous strategies.
Recommendations
Symbol: EURJPY Timeframe:
FREE
Elan: Enhance Your Trading Experience on MT5 and MT4 Are you looking to elevate your trading efficiency and fully leverage your time on MT5 or MT4? Look no further than Elan, a powerful trading assistant designed to optimize and streamline your trading experience. Elan offers a comprehensive set of features to support your trading needs: Position Management : Easily manage your positions with visual closing options, providing a clear view of your current order profits at a glance. Profit and Lo
FREE

NNFX TOOL – The Essential Order Management Tool for the Modern Trader A "small but mighty" EA, designed to optimize your trading workflow: High Performance: Lightweight yet powerful operation, ensuring precise and efficient order execution. Versatile: Perfect for NNFX method followers, while being incredibly user-friendly for beginners and sophisticated enough for pro-traders. SPECIAL FEATURE - Mobile Trading Support: Automatically sets immediate Stop Loss (SL) and Take Profit (TP) for pending
FREE

1. Overview This EA is a discretionary trading support tool for MT4 that enables batch SL/TP operations for open positions and pending orders, as well as trailing stops based on unrealized profit amounts. To use it, attach the EA to a chart while MT4's "Auto Trading" is enabled. 2. Trailing Stop Function 2.1. Basic Specifications The standard MT4 trailing stop is set in points, but this EA allows you to set the trailing stop based on unrealized profit amounts (in USD or JPY), making it more int
FREE

The Zig-Zag based levels indicator is a highly accurate tool for Forex trading that will help you improve your strategy and make more precise decisions. It uses the Zig-Zag algorithm to identify various support and resistance levels on the market, based on which you can determine when it is best to enter or exit a trade.
This indicator has high performance and accuracy in calculating levels, which allows traders to gain maximum profits with minimal risks. Thanks to its intuitive interface, you
FREE

EURUSD H1 Simple Martingale that works on daily swing levels, low DD, TP and SL defined on the basis of certain pre-set calculations in the algorithm, executes one trade at a time, weekly trading no overnight on weekends, possibility to establish customized exit times, possibility of customize money management. average return of 7.92% per year with the factory settings of the V1, it is always constantly updated, it is recommended to use it with a GMT +2 server TESTED SINCE 2003
Happy trading
FREE

Полная версия индикатора находится здесь .
Индикатор предназначен для торговли внутри дня. Строит канал по пробою крайних уровней которого вы можете открывать ордер на покупку или продажу. Во флетовом рынке работа ведётся на отбой от этих уровней. Для фильтрации входов используется цветная гибридная скользящая средняя. Настройки по умолчанию предназначены для терминального времени GMT +3 (подходит для большинства брокеров) и для терминалов с пятизначными котировками. Индикация канала и уровней A
FREE

This is a trend indicator.
Timeframe: any Symbol: any Color meaning: blue: long trend, up trend red: short trend, down trend yellow: market trend is changing Feature: 1, very easy to use, obvious signal, profitable 2, suitable to work on charts of any timeframe 2, all type of alerts 3, standard data buffers, can be easily implanted into any EA program. 4, all color customizable.
wish you like it :)
FREE

Key Level Key Level is a MetaTrader 4 Indicator that uses a proprietary algorithm based on Price Retracement/Breakout Method to show the Entry-Line on your trading.
Instead, it analyzes data of market and identify entry points and opportunities. (Price Retracement / Price Breakout)
It's also a trading tool that be used to practice and enhance your manual trading skills.
Key Level is an amazing tool for Scalping Trader. It also a trading tool that be used to practice and enhance your manual trad
FREE
StarkerFX EA is a martingale and trend following robot with trailing stop . This expert advisor is using MACD and Parabolic SAR indicators. There are no complicated settings. The only one input is the equity multiplier for automatic lot calculation. If you want to change it, please backtest it before using on real account. higher equity multiplier = higher lots = higher risk (recommended setting is: 1.0) This EA has been optimized for EUR/USD currency pair and for M5 timeframe. Feel free to ba
FREE

Unlock the power of Renewed Hope EA , a fully loaded, ultra-versatile Expert Advisor tailored for traders seeking high-performance automation without complexity. Whether you're a scalper, day trader, or swing trader, this EA gives you full control with OneShot precision , advanced filtering systems, and bulletproof money management. ️ Note: This is the FREE version
Some features are limited in this version. You may not fully experience the EA’s power and flexibility compared to the Premium ver
FREE

Quantum Swing 1. What is Quantum Swing The indicator calculates and displays future price levels based on quantum mathematics with high accuracy of probability and direction. Levels are displayed in the form of zones for making trading decisions; they clearly define a narrow price range for placing orders with a minimum stop-loss and maximum take-profit. The indicator displays future trading zones on different timeframes H1, H4, D, W. Quantum oscillations are also displayed without reference to
FREE

It uses three moving averages to analyze the market and generate buy and sell signals. The first and second moving averages are of the simple type with respective periods of 20 and 50. They are used to determine entry and exit points.
The third moving average is of the simple type with a period of 200. It is used to indicate the trend direction based on its position relative to the price. The robot only takes signals that are consistent with the trend, allowing it to reduce the number of false
FREE

Hello everyone,
Today I want to share with you a strategy who is designed especially on EURUSD timeframe M5 .
Pikachu is a sclaper who is not spread sensitive . Pikachu is very easy to use . Pikachu is using a dangerous strategy .
Why it's free? Pikachu is using a dangerous strategy : the expert will multiply by 2 the lot for each loss trade until a trade close with profit. To see another product with another strategy click on the link : https://www.mql5.com/en/users/coco
FREE

Trend Monkey is an EA that integrates various strategies such as trend identification, grid, and hedging. After using it, I believe you will be able to start your journey of wealth. This is the free version, you can download the professional version. This EA trades based on trends, so trading is not very frequent, and you need to wait until a clear trend appears.
Feature Spread requirements are not particularly demanding, general platforms can run Follow trends, use trends to trade Using hedgi
FREE
Highly configurable RSI indicator. Features: Highly customizable alert functions (at levels, crosses, direction changes via email, push, sound, popup) Multi timeframe ability Color customization (at levels, crosses, direction changes) Linear interpolation and histogram mode options Works on strategy tester in multi timeframe mode (at weekend without ticks also) Adjustable Levels Parameters:
RSI Timeframe: You can set the current or a higher timeframes for RSI. RSI Bar Shift: you can set t
FREE
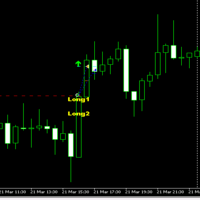
The Breakout EA trades fully automatically He doesn't use dangerous strategies like martingale or gritter etc. With this EA you can set a lot according to your wishes or according to my set. In addition, it has a news filter, it pauses the trades during the set time. In addition, it automatically increases the lots size if desired.
The backtest and trades were done with Fusion Markets: Leverage 1:500 Zero account Account opening with this link: https://fusionmarkets.com/en?cxd=45701_1642076&cx
FREE
Highly configurable OBV indicator.
Features: Highly customizable alert functions (at levels, crosses, direction changes via email, push, sound, popup) Multi timeframe ability Color customization (at levels, crosses, direction changes) Linear interpolation and histogram mode options Works on strategy tester in multi timeframe mode (at weekend without ticks also) Adjustable Levels Parameters:
OBV Timeframe: You can set the lower/higher timeframes for OBV. OBV Bar Shift: Y ou can set the offset
FREE

Screener Breakout Congestion: Have you ever missed a trading opportunity because you were not looking at the chart of that market in that specific time frame? Here is this screener to help you identify congestion breakouts in the markets you want to follow in the different time frames required. Once you have identified the markets (forex, indices, CDF) and the different time frames (1M, 5M, 15M, 30M, 1H, 4H, Daily), the screener is represented by several buttons that change colour when the conge
FREE

Using the indicator you can 1 Identify the trend and follow the large and small trends by drawing lines. When the price leaves the corridor of the lines, then with a high probability the price will go to the next line and reverse on it. 2 Long-line - Lay lines along the centers of fractals, the indicator can detect the fractal of the second point (Number bars analysis). Often the price can approach the line even after a week or a month and you can open a reversal trade. If the wave has passed w
FREE

This indicator graphically displays profit ($),risk/reward and % of risk according SL&TP Open orders on Current Symbol. when you open orders on current symbol and set StoplLoss and TakeProfit this indicator automatically calculate Risk/Reward and calculate %risk Of Equity Account that your order get stop Loss. If you trade on several symbols at the same time, you can install the indicator on each one separately and see the relevant calculations on each one.
FREE

This is a tool to measure the velocity of the price. It's completely free, you can download and use. "Way: distance of price after one tick." "Speed: price velocity after one tick." p/s: The time for the price to jump 1 tick will not be fixed, you should know this. If Way > 0, the indicator will change color to Green If Way < 0, the indicator will change color to Red || I am a 3D artist and I love math and programming! ||
FREE

Indicator showing the breakout after at least X candles of the same sign, followed by an opposite candle. PARAMETERS: BARS TO SHOW = Story of Indicators (0 = all bars) Consecutive Bars for Breakout = How many Bars of the same direction and after a Bar with opposite direction Minimu Point between H/L = To consider a bar valid, she must have a Minimun Hi/Lw value Minimu Point between O/C = To consider a bar valid, she must have a Minimun Open/Close value Graphics are self-explanatory
FREE
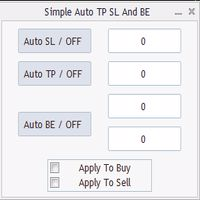
Program for automatic placement of stop loss and take profit orders. Values are calculated as points distance from open price. BreakEven option is also included. all options could be applied to BUY, SELL separately or together. Enter values in points in the fields on the right side of the menu and press dedicated button to aplly your settings.
If in doubt, The instruction is displayed in the tooltip.
FREE

Идея индикатора очень проста и скорее всего пригодится тем, кто используют линейный график для технического анализа. Что-бы устранить "неровности" (-: линейного графика и был написан этот индикатор. Линия графика соединяет цены закрытия свечей, как и в классическом линейном графике, но игнорирует цены, которые шли в направлении линии и новый экстремум возникает только тогда, когда цена закрытия последней свечи явно ниже или выше предыдущего значения. Это облегчает визуальное восприятие при поиск
FREE
Use Forex Trading Profit Tracker to keep a record of your earnings across accounts. This indicator will show a dashboard in the Meta Trader chart to show for the profit or loss money in your account. It’s easy to see just how much money you’re making matched betting with the Forex Trading Profit Tracker. Key features: Track your profit over time Check out your stats. Track expected profits against actual profits. Export account history to Excel.
MT5 version(*): https://www.mql5.com/en/market/
FREE
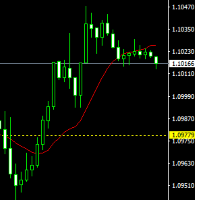
The indicator draws lines (with line objects) to the close prices of the previous day close, on selected timeframes. The indicator uses the closing price of the past day to draw a horizontal line, it can help you determine the direction of the market at the moment, which is necessary for making trades.. Parameters
Line Color Line style Line width Set on the top
FREE
This indicator displays the historical spread values on the chart. This is an extremely useful tool for watching the spread rise and fall, allowing you to enter the market at just the right time. This indicator will help you stay out of the market when the spread begins to rise and help you get into the market as the spread begins to fall again.
ON SALE FOR FREE, GET IT FREE FOR A LIMITED TIME ONLY
FREE

Three Sixty Dollar EA IC Market Recomment Broker
-THIS EA ONLY BUY
-only DE40 -minimum 3000$/€ ...Lot 1-5 -M1
-maximal 30min per Day Robot Worktime
Version 1 BUY only -this EA only BUY Trade only on the DE40 indices - Don't close trades the robot will close everything automatically on point. -The maximum working time of the robot is 30 minutes since the broker has a maximum of trading messages per day Test the trading news per day with your broker first with a demo account or read about it i
FREE

Procyon is an automated Expert Advisor that uses the combination of the Ichimoku Kinko Hyo , Candle Patterns and a relatively new Reflex Indicators to identify Spinning Top Candles in Bullish or Bearish patterns. The EA has a hard, fixed Stop Loss and Take Profit. Even though the win rate is a little more than 50 percent, the SL is about half of the TP. So, you will have trades float in high positive sometimes. Recommended pairs and time frames are located in the Comment section.
FREE

Title: Risk Commander Trade Assistant and Simulator Description: Risk Commander is a trade management panel designed to assist with manual execution and risk calculation. It functions as both a live trading assistant and a training tool within the Strategy Tester. Product Utility: Live Assistant: Facilitates trade execution with automated position sizing and risk management calculations in real-time. Training Simulator: Fully compatible with the MetaTrader Strategy Tester (Visual Mode). This all
FREE
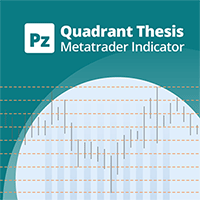
This is a general purpose indicator that displays colored lines at fixed and customizable price intervals, entered as parameters. It offers universal, constant, and familiar price ranges that allow quick and precise price analysis of a currency pair. With default parameters, this indicator implements The Quarters Theory , as described originally by Ilian Yotov . [ Installation Guide | Update Guide | Troubleshooting | FAQ | All Products ] Easy to use No optimization needed Customizable price inte
FREE

Smart Equity Protector (PropFirm Edition) Smart Equity Protector (PropFirm Edition) is a professional account equity protection and risk-management utility for MetaTrader 4. This Expert Advisor is designed to protect trading accounts from excessive losses by monitoring account equity in real time and automatically closing trades when predefined risk limits are reached. ️ This product does NOT open trades and does NOT generate trading signals .
It works as a safety and protection system for manu
FREE
Highly configurable Rate of Change (ROC) indicator. Features: Highly customizable alert functions (at levels, crosses, direction changes via email, push, sound, popup) Multi timeframe ability Color customization (at levels, crosses, direction changes) Linear interpolation and histogram mode options Works on strategy tester in multi timeframe mode (at weekend without ticks also) Adjustable Levels Parameters:
ROC Timeframe: You can set the current or a higher timeframes for ROC. ROC Bar Shift:
FREE

RangeMasterFX combines trend analysis and technical indicators based on multiple timeframes. Multi-Timeframe Analysis: Analyze trends on three timeframes: daily (D1), 4-hour (H4), and 1-hour (H1). RSI Filter: Uses the RSI (Relative Strength Index) to identify overbought and oversold market conditions and filter entries. Trailing Stop: Apply trailing stops when positions move in your favor to maximize profits. Dynamic Stop Loss and Take Profit: Dynamic stop loss and take profit depending on marke
FREE
LimitGridEA Pro – Smart & Clean Grid EA for Gold and Forex Trade confidently with a Buy/Sell Limit Grid System powered by technical filters, equity control, and a user-friendly interface. Key Features : Buy/Sell Limit Only – Structured order placement, no spamming, no chaos RSI + Bollinger Band Filters – Ensures entries happen only with clear technical signals Combined TP (per side) – Automatically closes all orders on each side when profit target is hit Average Price TP (opt
FREE

Optimus uses a unique strategy based on averaging positions against the current trend. This approach allows you to profit from market corrections and reversals by opening additional positions in the direction opposite to the main trend. Monitoring
All signals are managed by our advisors, details are disclosed only to existing clients - after purchasing/renting any product. https://www.mql5.com/en/users/robotstroi/seller Main characteristics: Multicurrency: The advisor works on all major and
FREE
06/30/23 v1.1 New features.
Read before operate. Remarkable configurations: 1) "No close order", "Auto-Hedging" FALSE, "Close all" FALSE : You can transform this EA in a assistant that simply open orders. After you will be the mind of the operativity. Warning : find a good setting of "Pause in minute" and "Max alert" to delay the operativity and filter the wrong signals. These last parameters can change by market condition and asset.
2) "Breakeven and WPR inversion", "Auto-Hedging" FALSE, "Clo
FREE

This EA is a free version of Vino EA . Unlike the full version, the parameters cannot be changed and the lot size is set to 0.01.
Description Vino EA is a grid Expert Advisor using mainly customized oscillators to analyze the market prices and volatility in order to identify trend reversals. It uses a grid of orders which increases the lot size only after the stop loss is reached. It includes an automatic stop loss, which computes the stop loss value based on the volatility of prices.
Require
FREE
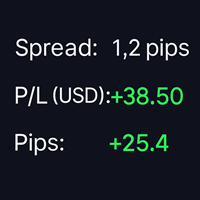
SpreadPipsProfit – Real-Time Spread, P/L & Pip Tracker SpreadPipsProfit is a lightweight, non-intrusive MT4 indicator that displays your key trading metrics in real time — directly on your chart. It’s designed for traders who value clarity, precision, and clean visuals. Key Features Right-Aligned Display Panel – Perfectly positioned in the top-right corner with adaptive spacing and safe edge margins. Live Spread Monitor – Shows the current spread in pips , helping you avoid overpaying on e
FREE

The FxSProMT indicator shows the current market trend and trend change.
Indicator Parameters Ind_Period - the number of previous bars used to calculate actual values. Number_Bars - the number of bars to display the indicator.. Too many bars may significantly slow down the operation of the trading terminal. Signal_Sound - sound alert to notify of trend change. The sound can be played multiple times until the signal is confirmed (the bar closes). Default is disabled. Signal_Alert - an alert to no
FREE

Features:
1. Your constructor strategies.
2. Large selection of standard indicators.
3. Exact market entry according to your strategy.
4. Slip filter.
5. Support for four and five characters.
6. Trend trading.
7. Trading in flat.
8. Minimum deposit.
9. Aggressive or quiet trade.
10. Limit the lot. 11. Position tracking.
12. Restoring balance after loss.
Input parameters
Lot - fixed lot size. StopLot - lot restriction. UseVxod - enable / disable login pattern. UseStop -
FREE
The automatic advisor works according to a simple strategy for the breakout of the previous day's high and low. In the settings there is a function to reverse orders Reverse, when the maximum is broken, instead of buying, a sell will be opened, and when the minimum is broken, instead of selling, a buy will be opened. Real monitoring https://www.mql5.com/en/signals/833080
Settings Reverse - when the level is broken, orders will be opened in the opposite direction The maximum number of limit o
FREE

Script to create arrows and lines on chart of history positions traded on account for the symbol where you launch the application. From inputs you can select: - Magic number (default is -1; -1 = all magics number) - "From" date and time (default is 1970.01.01 00:00; all positions) - "To" date and time (default is 1970.01.01 00:00; all positions) - Color for buy open positions (arrows and lines between open and close) - Color for buy closing positions (arrows) - Color for sell open positions (arr
FREE
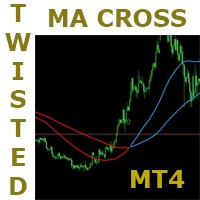
This is a very simple but very powerful strategy. It has a lot of potential. This strategy is based on the popular moving average crossover but with a very interesting twist to it. It has some mechanisms to delay signals untill direction is clear and confirmed. Follow the indication colors and arrows for trade ideas It has a potential winning rate of somewhat greater than 70%. Try it in all timeframes and determine which one is good for you. ===========
FREE

This EA (Expert Advisor) is based on the logic of the ADX and utilizes the strength of trends as entry signals.
The most crucial factor here is the success rate of these entries.
By increasing the success rate, even with smaller profits for each individual trade, it becomes possible to accumulate substantial gains when trading across numerous currency pairs.
This EA primarily operates on longer timeframes because it makes it easier to determine whether the trend is upward or downward.
Addi
FREE
The purpose of this new version of the MT4 standard indicator provided in your platform is to display in a sub-window multiple timeframes of the same indicator. See the example shown in the picture below. But the display isn’t like a simple MTF indicator. This is the real display of the indicator on its timeframe. Here's the options available in the FFx indicator: Select the timeframes to be displayed (M1 to Monthly) Define the width (number of bars) for each timeframe box Alert pop up/sound/ema
FREE

Are you ready to take your trading game to new heights? Introducing Quantum Fx, the ultimate Expert Advisor designed to enhance your trading strategy and maximize your profit potential in the forex market. In this groundbreaking video, we unveil the remarkable features and benefits of Quantum Fx, empowering you to trade with confidence and precision. Whether you're a novice trader or an experienced investor, this EA is tailored to cater to your unique trading goals. Key Features of Quantum Fx: A
FREE

Panel Display is a free utilities indicator, to display basic account information, in a beautiful way. This indicator is a plug and play, where the is no input required except for display corners. User can quickly engage how much profit/loss for current day / week! This Week's Performance - This week closed order for all pairs. Today's Performance - Today's closed order for all pairs. Current Floating Profit / Loss - Current Floating Profit/Loss (all pairs) in the account
FREE
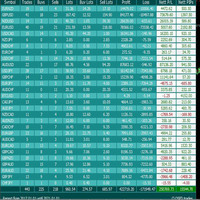
For more info, questions and problems join to discord.gg/reitakfx
Very informative and detailed tool for your account. - pairs, number of trades, lot size, profit, lose, nett p/l, net pips - profit growth chart
Instalation : - open chart and delete every other indicator on it - put this report on chart
Setting : - magic number - filters (comment, symbols, currencies) - date (today, week, month custom) - Start / End date (this is for custom date) - report type (open - only active trades wi
FREE

This indicator determine price volatility using correlation between Price and Time. WARNING: Not suitable for 1M timeframe, you would not see any lines in this frame!
How to Use:
More closer the indicator's value to 0, the price is considered more volatile. When reversal is started, the indicator's value would be rise or fall significantly. During a strong trend, the indicator's value would be closer to 1 or -1, depends on current trend. Entry Signal:
BUY SIGNAL: Indicator crosses 0.2 from bel
FREE

Never miss a trend change again! This indicator uses various calculation methods based on price action to detect changes in the direction of the trend. It can be used on high timeframes (from H1 to D1) and is most suitable for H4 and Daily timeframe. This indicator is compatible with all broker symbols (forex, indices, CFD, commodities, crypto…). It is also possible to open the indicator on several charts to follow several symbols at the same time. In addition, you don't have to stand by your P
FREE

TwoMA Crosses indicator displays arrows based on whether the short term moving average crosses above or below the long term moving average. A moving average doesn't predict price direction. Instead, it defines the current direction. Despite this, investors use moving averages to filter out the noise. Traders and investors tend to use the EMA indicator, especially in a highly volatile market because it’s more sensitive to price changes than the SMA.
Download for FREE TwoMA Crosses EA from the
FREE

Trends are like the "Saint Graal of traders": it can give you an higher win rate, a better risk to reward ration, an easier position management and so on...
But it is really hard to determine the trend with accuracy, avoiding fase signals, and with the right timing, in order to take massive movements. That's why I created the Trend Validator: a new and EASY tool that will make identifying trend and build new strategy a really easier work.
ANATOMY OF THE SOFTWARE
The indicator is composed by 3
FREE

Broken Trends is an indicator for scalpers and intraday traders. The indicator selects and displays trend levels on the chart in the real time mode. The indicator reacts to price momentum: it starts searching for the trends as soon as the momentum amplitude exceeds the threshold set in a special parameter. The indicator can also play a sound when the price crosses the current trend line. In normal mode, the indicator shows only one (last found) upward and one downward trend, but there is an adva
FREE

TMA Classic – Overview of the Triangular Moving Average Indicator The TMA Classic is a very simple and lightweight indicator that displays the Triangular Moving Average (TMA) as a single smooth line. It effectively removes excessive noise and captures the central movement of prices, making it useful for identifying trend direction and range-bound market conditions. Since it only displays a single line, it offers high visibility on the chart without interfering with other indicators or candlestic
FREE
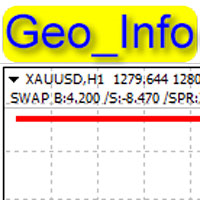
Geo_Info is one of the most informative indicators displaying net levels as well as basic data on a symbol and trading positions in a space-saving manner. displays brief data on the basic symbol parameters in the upper left corner of the chart: Swap for Buy order, swap for Sell order, current spread, margin, tick size, stop level, order freeze level . The data is shown for one lot in points. The data is displayed as follows: SWAP B:4.200 /S:-8.470 /SPR:342 /MRG:256.0/TCV:0.10/STL:0/FRL The data
FREE
This indicator for MT4 automatically draws support and resistance levels based on fractals, highlighting key areas of the market where the price could reverse or slow down. Fractals are graphical structures that identify significant highs and lows, thus forming a dynamic system of support and resistance levels. The indicator allows you to visualize these levels directly on the chart, facilitating technical analysis and identifying potential entry or exit points in the market. It is an ideal too
FREE

This is a very simple multiple moving average indicator.
It can display 12 moving averages. The time axis of the moving averages can be changed in the input field of the indicator. The process is faster than the 12 moving averages included with MT4.
We also have a buffer set up so you can access it from an Expert Advisor. *For advanced users.
If you have any questions or requests, please message me.
Thank you. MT5 Version: https://www.mql5.com/en/market/product/124997
FREE

Советник использует две МА ( Moving Average ) для открытия позиции. В MA Slim гибкие настройки для выставления стоп лосс и тейк профит. Так же можно выставить свой трейлинг стоп. Хорошо оптимизирован для eurusd H4 , но можно настроить под любую валютную пару по своему усмотрению. Lots/ Лот DecreaseFactor/ Коэффициент Уменьшения SL/ Стоп Лосс TP/ Тейк профит MovingPeriod1/ Период MA MovingPeriod2/ Период MA MovingShift/ Сдвиг МА AllPositions/ Управлять всеми позициями ProfitTrailing/ Тралить то
FREE
The MetaTrader Market is the best place to sell trading robots and technical indicators.
You only need to develop an application for the MetaTrader platform with an attractive design and a good description. We will explain you how to publish your product on the Market to offer it to millions of MetaTrader users.
You are missing trading opportunities:
- Free trading apps
- Over 8,000 signals for copying
- Economic news for exploring financial markets
Registration
Log in
If you do not have an account, please register
Allow the use of cookies to log in to the MQL5.com website.
Please enable the necessary setting in your browser, otherwise you will not be able to log in.