Multi currency RSI MT4
- Indicators
-
Navdeep Singh
 The momentum of money is always more potent than the gravity of logic
Free or paid, All tools are coded with intention to help traders
My tools:- - Version: 1.0
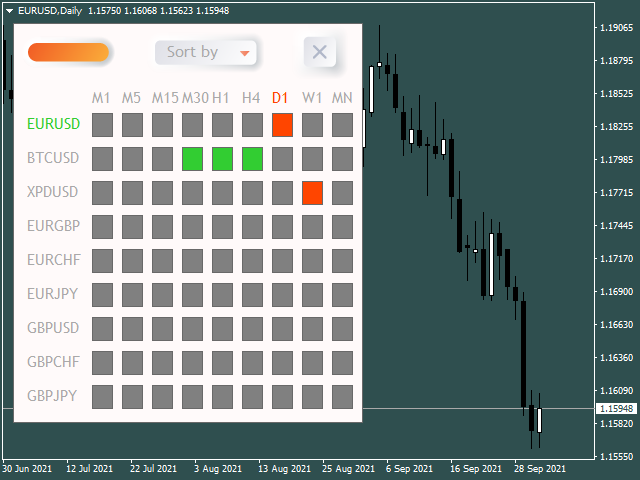
RSI Scanner, Multiple Symbols and Timeframes, Graphical User Interface
An indicator that scans multiple symbols added from the market watch and timeframes and displays result in a graphical panel.
Features:
- Multi symbol
- Multi timeframe
- Alerts and Notifications
- Live Monitoring
- Sorting modes
- One click to change symbol and timeframe
- Inputs for RSI and scanner settings

Great tool!