Watch the Market tutorial videos on YouTube
How to buy а trading robot or an indicator
Run your EA on
virtual hosting
virtual hosting
Test аn indicator/trading robot before buying
Want to earn in the Market?
How to present a product for a sell-through
Expert Advisors and Indicators for MetaTrader 4 - 45

This Indicator is based on Mr. Dan Valcu ideas.
Bodies of candles(open-close) are the main component used to indicate and assess trend direction, strength, and reversals.
The indicator measures difference between Heikin Ashi close and open.
Measuring the height of candle bodies leads to extreme values that point to trend slowdowns. Thus quantifies Heikin Ashi to get earlier signals.
I used this indicator on Heiken Ashi charts but, it's possible to choose to calculate Body size based on Heik
FREE

Expert Advisor Description EA TugOfWar will open both buy and sell positions at different times according to the triggered signal, the most positions and in accordance with the market direction that will win and profit. Profit target per war is 1% to 5%. Warmode normal = Longterm strategy Warmode extreme = Shortterm strategy
Parameter Description StartTrade = Time to start trading / open position EndTrade = Time to end trading / open position WarMode = 1 -> Normal, 2 -> Extreme (lots of tr
FREE

If you like this project, leave a 5 star review. As institutionals trade large volumes, it is not uncommon for them to try to
defend their position at specific percentage levels. These levels will serve as a natural support and resistance which you can use
either to enter a trade or be aware of possible dangers against your position. An example of a common used percentages are 0.25% and 0.50% on EURUSD for the
week, you can see this example on the screenshots. With this indicator you will be abl
FREE
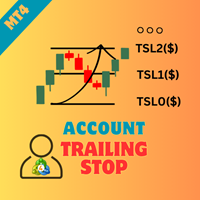
Enhance your portfolio risk management with the Account Trailing Stop Manager MT4, a powerful Expert Advisor (EA) designed to automatically track and trail the total profit of your account or specific magic number trades on MetaTrader 4, closing all trades when the current profit falls below the last peak profit. Praised on MQL5, Forex Factory, and Reddit’s r/Forex for its dynamic profit-locking mechanism, this EA is a favorite among scalpers, day traders, and swing traders in volatile markets
FREE

Second Timeframe - Professional Multi-Timeframe Analysis for MetaTrader
See More, Trade Better - enhance your MetaTrader experience with this essential multi-timeframe analysis tool, extracted from the powerful Meta Extender suite. What It Offers: View higher timeframe data overlaid directly on your active chart without switching between windows. This standalone widget displays a second timeframe simultaneously with your native chart, providing complete market context at a glance. Key Benefi
FREE

I present you the Abella Expert Advisor. The "London breakout" occurs in the European session. During this time, Abella follows the market and enters in one of the direction according to the identified Price Action patterns. The EA works both during a flat and trend. This EA has been created for multicurrency trading. Do not Abella on one pair. For optimal performance, use 4 pairs: AUDUSD, USDJPY, EURJPY, GBPUSD (the H1 timeframe) and create a portfolio.
Parameters Lot - fixed lot; Risk - dynam
FREE

The implementation of the impulse system described by Dr. Alexander Elder. The indicator generates signals according to the following pattern: Moving average and MACD histogram increase - green bar, it is forbidden to sell; Moving average and MACD histogram have different directions - gray (or empty) bar, the ban is removed; Moving average and MACD histogram decrease - red bar, it is forbidden to buy.
Indicator Parameters EMA - period of the indicator's moving average MACD Fast - period of the
FREE

Ready to turbocharge your trading game? Bullish Wave is the fully automated trading software that gives you the edge you need to become a profitable trader. With powerful analytics, real-time market data, and intuitive tools. With Bullish Wave , you'll be able to effortlessly trade in the forex market like a professional. Our fully automated EA works with two industry-leading indicators: Bears Power indicator and ADX indicator. Open positions faster and safer than ever before with our integrat
FREE

The Investment Castle Chances indicator will show signals on the chart for entering a buy or sell trade. There are 2 types of signals for each direction as follows: Buy / Sell (Orange colored candlesticks) Strong Buy (Green colored candlesticks) / Strong Sell (Red colored candlesticks) You may place a buy trade once you see the Buy arrow or vise versa, or you might prefer to wait for a further confirmation “Strong Buy” / “Strong Sell”. This indicator works best with the high time frames H1, H
FREE

A simple expert Advisor based on the signals of the Stochastic indicator in the overbought zone - sell, in the oversold zone - buy. Add friends, send your interesting strategies. Perhaps after discussing all the nuances, I will write an adviser for free .
Parameters:
"_Slippage" - Slippage;
"_Magic " - Order ID;
"_ Lot " - Volume;
"_ StopLoss" - Stop;
"_CloseBalanse" - Closing by balance;
"_CloseBalanseLose " - Loss in the account currency;
"_ClosePercentBalanse" - Closing
FREE
Ultimate Volatility Insight is a highly professional tool for analyzing and fully understanding market activity based on an advanced ATR with improved algorithms and calculation formulas. The indicator helps traders accurately assess market dynamics, identify key support and resistance levels, and effectively manage risks. Ultimate Volatility Insight works only with real data using live statistics. The indicator has been developed for over two years, and its effectiveness has been proven through

Индикатор отображает различными цветами на фоне графика три торговые сессии. Открытие - закрытие Лондон, Нью Йорк, Токио по умолчанию. Применение Для успешной торговли важно знать начало и конец торговых сессий с наибольшей ликвидностью, так как именно в это время цена делает самые большие движения.
Особенности Настройки по умолчанию - торговые сессии по Лондону, Нью Йорку, Токио. Возможность выставить свои рамки тоговых сессий Алерт при открытии сессии Показ открытия дня по GMT Настройки для
FREE
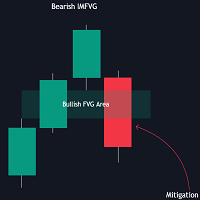
The FVG Instantaneous Mitigation Signals indicator detects and highlights "instantaneously" mitigated fair value gaps (FVG), that is FVGs that get mitigated one bar after their creation, returning signals upon mitigation.
Take profit/stop loss areas, as well as a trailing stop loss are also included to complement the signals.
USAGE Figure 1 Instantaneous Fair Value Gap mitigation is a new concept introduced in this script and refers to the event of price mitigating a fair value gap one

Bollinger Bands Tunnel EA is a free expert advisor developed with the idea to be useful for traders who love to trade using the popular indicator Bollinger Bands. Bollinger Bands Tunnel EA has very simple trading logic. It trades inside of the Bollinger Bands indicator. When the price crosses the Bollinger Bands upper line and reverses, the EA opens a SELL position. When the price crosses the Bollinger Bands lower line and reverses then the EA opens a BUY position. The algorithm of closing the
FREE

Precision Pulse: High-Conviction Trend-Following Indicator Product Overview Precision Pulse is an advanced, multi-factor trend-following indicator engineered to deliver high-probability trade signals by rigorously aligning the long-term trend, short-term momentum, and overbought/oversold conditions. It minimizes market noise and whipsaws by requiring all foundational components to converge before generating an entry signal. Signal Mechanics: The Core of Precision Precision Pulse ensures trade q
FREE
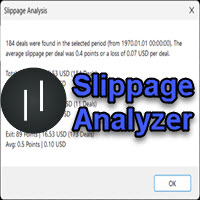
If you are using scalping strategies (or any strategy that uses stop loss orders for position closing) you need to know your slippage. Slippage is the difference between your order price and the price that your brokers uses to execute your order. This can be really different and depends on the broker as well as on the market conditions (news, trading hours, etc..) With this small script you can calculate the slippage you "paid" in points and also in your account currency. You also get average va
FREE

MT5 Version OVERVIEW
This indicator integrates a refined trend-following model with dynamic price rejection detection, dynamic candle coloring, and ATR-based target projection, offering traders a complete visual system for identifying and managing trend continuation setups. It overlays directly on the chart, automatically spots potential trend changes, confirms rejections near adaptive support/resistance, and shows calculated stop-loss and take-profit levels to support structured risk-reward d
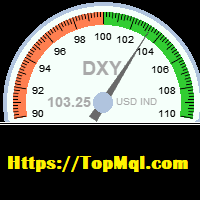
This indicator is used to calculate the dollar index according to the formula of currency pairs(EURUSD ,GBPUSD,USDJPY,USDSEK,USDCHF,USDCAD)Even if the broker does not have the dollar symbol. this Indicator displays the dollar index chart in a separate window at the bottom of the chart. It also displays the current dollar index graphically. In this indicator, it is possible to set the minimum and maximum value of the indicator as well as its size scale on the chart as an input parameter, and it
FREE

This is a simple Expert Advisor that uses the RSI indicator to enter a trade and several patterns. the advisor trades one deal and each deal has a stop loss and take profit (set in the settings) in case of failure (the deal is closed by stop loss), it is possible to increase the lot of the next deal. The telegram group: https://t.me/FXAdvisorsMy Start_trade - time to start trading End_trade - trade end time Lot - size of the lot for opening the first order (this is a fixed lot
FREE

CCI Trend Finder indicator with different colors at levels 0, 100 and -100. The cross is a signal for "123 Exit" as presented by MPlay and used in Woodies CCI system. This exit signal is effective especially in short-term breakout trades, because it prevents early exiting at small corrections. This indicator is great for having it as an extra tool for your analysis.
FREE

Key Price Levels Indicator Indicator that shows the highs and lows for the significant price levels for past periods that could be potentially considered as reaction levels. The indicator displays the following price levels: Yesterday high and low The day before yesterday high and low Two days back high and low Last week high and low Last month high and low Last three month high and low (Quarter) Last year high and low
FREE

GTAS FidTdi is a trend indicator using combination of volatility and potential retracement levels. This indicator was created by Bernard Prats Desclaux, proprietary trader and ex-hedge fund manager, founder of E-Winvest.
Description The indicator is represented as a red or green envelope above or under prices.
How to use Trend detecting When the envelope is green, the trend is bullish. When it is red, the trend is bearish.
Trading Once a trade is opened, GTAS FibTdi shows retracement zones wh
FREE

The StrikePin indicator is a technical, analytical tool designed to identify trend reversals and find optimal market entries. The StrikePin indicator is based on the pin bar pattern, which is the Price Action reversal pattern.
An entry signal, in a trending market, can offer a very high-probability entry and a good risk to reward scenario.
Be careful: the indicator is repainting since it is looking for highest high and lowest lows. You should avoid to use it in experts but you can use it in
FREE

Display rectangles and trendlines list from Trading box Technical analysis tool. Objects are ordered in the list by pip distance that is difference between object price and Bid price. With this tool you will know which chart to look for next trading opportunity. No more switching between charts and searching for trades where price is close to rectangle zone or trendline support resistance level. Sorted Rectangles and Trendlines by pip distance - If you are trading on multiple charts, then th
FREE
Multi-Order Breakeven Manager – Utility for MT4 Overview The Multi-Order Breakeven Manager is a utility for MetaTrader 4 designed primarily for managing XAUUSD (Gold) trades.
It automatically moves stop-loss levels to breakeven when open trades reach a predefined profit target.
The tool supports multiple positions and includes a grouping system that manages clustered orders within a user-defined pip distance.
It is suitable for both manual and automated trading setups. Features Multi-order manag
FREE

The Elsna ATR is a custom MetaTrader 4 indicator that combines two key features into one clean chart overlay: Average True Range (ATR) Display Calculates the current ATR value for the selected period (default = 14). Can show the value in pips or price units . Candle Countdown Timer Displays a live countdown showing how much time remains until the current candle closes. Updates every second, even when the market is quiet. This indicator helps traders quickly gauge market volatility
FREE

The Tmcd is a very smooth oscillator and a good indicator of trend. It has a noise filter built in which shows sideways markets and it can also show the beginning of a trend. It works on any symbol from Forex to commodities as well as crypto currencies. It does not require a change of settings. The default settings are fine. The use of it can be varied and I recommend it is be used in conjunction with other indicators. The indicator is free for use and your review will be appreciated.
Join my T
FREE

is a user-friendly MetaTrader 4 indicator that creates a centralized dashboard for traders to oversee several cryptocurrency pairs simultaneously across different timeframes, presenting price movements through simple dots or miniature candlestick charts, complemented by volume indicators to facilitate quick assessments of market trends and fluctuations. It automatically resizes grid cells according to the number of bars shown per timeframe for better use of screen space, features adjustable co
FREE
DO NOT TRY THIS, IT IS NOT WORKING. SOON I WILL PUBLISH NEW VERSION ONCE IT IS UPDATED
RahimSwingEA - A Powerful and Intelligent Trading Solution for MetaTrader 4 Unlock the potential of your trading with RahimSwingEA , a state-of-the-art Expert Advisor (EA) designed to bring advanced swing trading strategies directly to your MetaTrader 4 platform. Built with precision and optimized for high performance, RahimSwingEA provides a seamless, automated trading experience for both novice and seasone
FREE
Kali Layers Toolbox – Smart Zone & Layered Trade Management Utility Layers Toolbox is a very useful and smart MT4 utility EA designed for traders who want precision control over zone-based pending orders and break-even (BE) management .
Simply draw your trade zone on the chart, and the EA will automatically place multiple pending orders within that zone according to your settings. It works for both single trades and grouped positions , giving you maximum flexibility and accuracy in trade manage
FREE

This EA is designed to extract super profits. So he needs to be allowed big risks. It is better to start with a small account.
It is installed on the D1 chart and can wait a long time for the right moment. After that, it opens many orders in one direction.
The EA is designed for THE highly volatile USDZAR pair and is unlikely to be useful on other pairs.
Change the top three parameters to be like this:
Pair USDZAR
Currency USD,ZAR (between currencies comma without space)
sPair USDZAR
FREE

RRS Impulse Plus EA is an advanced version of RRS Impulse EA . This upgraded version provides more flexibility with several new options. The EA scalps using the Relative Strength Index (RSI), Stochastic Oscillator, Moving Average (MA), and Bollinger Bands indicators to identify trend and counter-trend opportunities. As a multi-pair EA , it scans multiple currency pairs for signals. This EA includes various features such as Trailing, Risk Management, Money Management, Restriction Mode, and more.
FREE

The indicator shows entry points with Risk-Reward-Ratio 1 to 5. Main timeframe H1. Works on every pair. The main logic - is to find a reversal level, and then track the price reaction to this level. Doesn't need any settings. As a standard, it paint 5 levels of the same take-profit (red / blue for sellers and buys) and 1 stop-loss level - orange. ATTENTION! Test version of the indicator. Works only on the USDCAD pair! The full version can be bought here https://www.mql5.com/en/market/product/61
FREE

Night Express — is a professional trading advisor for automated trading on the Forex market, specializing in short-term transactions at night. The robot is designed to work on your trading account around the clock, making a profit from small price fluctuations. Monitoring
All signals are managed by our advisors, details are disclosed only to existing clients - after purchasing/renting any product. https://www.mql5.com/en/users/robotstroi/seller Key Features Night mode : active trading from 20
FREE

This is an example of how the MetaTrader terminals's Strategy Tester can help to find good input parameters for an old and widely known MACD Sample Expert Advisor, which is available in the Navigator window (tab: Expert Advisors).
Input parameters Indicator MACD: fast - fast Period; slow - Slow Period; sign - Signal Period; appPrice - PRICE_CLOSE=0; PRICE_OPEN=1; PRICE_HIGH=2; PRICE_LOW=3; PRICE_MEDIAN=4; PRICE_TYPICAL=5; PRICE_WEIGHTED=6; MACDOpenLevel ; MACDCloseLevel ; Indicator Moving Avera
FREE

Crystal CopyCat Ultimate Ultra-Fast Master–Slave Copier with Zero-Delay Execution and Cross-Platform MT5 Compatibility
Architecture: MT4 → MT4 and MT4 → MT5 Full Compatibility
MT5 Version: https://www.mql5.com/en/market/product/144569
Complete User Setup Guide:- https://www.mql5.com/en/blogs/post/764222
1. Overview
Crystal CopyCat Ultimate 5.0 is a next-generation trade copy engine engineered for professional traders, portfolio managers, prop-firm operators, and signal distributors. Unlik
FREE

ITS FREE I Recommend www.CoinexxBroker.com as a great broker and the one I personally use Asia session 1:00 to 9:00 (6pm est to 2 am est) Eur means London Session 10:00 to 18:00 (3 am est to 11 am est) USA means New York Session 15:00 to 23:00 (8 am est to 4 pm est) Session indicator highlights the start of each trading session. You can show all sessions or edit the settings to only show the hours you want highlighted (Asia) means Asian Session ,(Eur) means London Session , (USA) means New
FREE
The Quad-Filter Pro: Unlock Precision Trading & Filter Out the Noise Tired of complex charts and missing out on profitable opportunities? In today's volatile markets, relying on a single indicator is risky. You need rock-solid confirmation to separate high-probability trades from market noise. Introducing The Quad-Filter Pro —your ultimate MetaTrader 4 indicator engineered for unparalleled trade precision. It’s like having an expert analyst constantly screening the market, giving you a crystal-
FREE
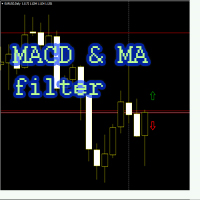
The MACD and MA filter EA trades on the MACD indicator, uses the filter as two moving averages (fast MA is higher than slow MA - buy, sell - contrary), the Martingale is applied at the request of the User (the amount of lot multiplication for a series of losses is limited), breakeven, trailing stop, inverting the signal. In EA version 1.4. added closing an order by a reverse signal, separately by the MACD indicator (parameter Close_By_Reverse_MACD_Signal), separately by moving averages (paramete
FREE

Hello trader,
I'm a fan of Price Action and i coded my indicator named Price Action Candle. May be future it is a paid version that can be get alert by mobile phone or telegram. This indicator can show you three type candles as: PinBar, Inside Bar and Fakey. You can setup more option for other candle: Engulfing
Feel free to contact me in a private message or via telegram @spotXXX
Thanks and happy trading!
FREE

RSI Bands is a powerful indicator which displays an upper and lower band corresponding to the RSI overbought and oversold levels. The band shows what price must be reached during that specific candle in order for the RSI overbought/oversold level to be reached. This is an extremely useful tool for spotting when a trend has begun and when a trend is about to end. The indicator provides buffers, allowing you to use it in your own Expert Advisor. Please message me if you have any questions.
CURREN
FREE

This Expert is using free indicator, please BBMA.ex4.zip . This indicator use for exit strategy. Download and extract to folder mql4/Indicators. Expert is using Nick Shawn Dollar Cost Averaging and Random Buy or Sell at new High or new Low of the trend. Very simple and effective, please remember to use lot size as small as possible. Example AutoLotDivide = 2000, you will have lot 0.01 each 1k of your balance. Or Just set manually at fixlot.
Backtest only for EU pair for now, please use defaul
FREE

With the MACD Multi Time Frame indicator, you can spot divergences of higher timeframes while you are searching for pinpointed entries on lower timeframes. This FREE version of the indicator works only on EURUSD and GBPUSD. The full version of the indicator can be found here: MACD Multi Time Frame This blog post gives you REAL-TIME MACD Divergence Analysis for FREE and tips how to trade the divergences: REAL-TIME MACD Divergence Analysis The MACD Multi Time Frame gives you a very good overview o
FREE

Usual martingale grid. The decision-making logic is based on 3 lines of the Moving Average indicator. In the settings, the period of only the first line is set, the periods of the remaining two are calculated based on the first (the period of the second line = the period of the first line multiplied by 2, the period of the third line = the period of the first line multiplied by four and + the period of the first line)
Buy signal: The first line is directed upwards and is above the second and t
FREE
Ultimate Signal Generator: Your Edge in the Market Are you tired of guessing your next move in the market? The Ultimate Signal Generator is here to change that. This powerful MQL4 indicator is designed to give you a clear trading advantage by providing reliable buy and sell signals. It's a smart, effective tool that helps you make confident decisions, so you can focus on your strategy, not on uncertainty. Key Advantages and Features Pinpoint Accuracy: Our indicator uses a unique blend of Bollin
FREE

Arrow Indicator (Buy/Sell Alerts) – Simple Yet Powerful Tool! Product Version: 1.01 Indicator Type: Trend Reversal Signals Timeframes Supported: All (Recommended: H1, H4, D1) Key Features: Buy Signal: Green upward arrow () appears below the candle Sell Signal : Red downward arrow () appears above the candle Accurate Trend Reversal Detection – Based on tried and tested SMA strategy. ️ Clean Chart View – Minimalist, non-i
FREE

This robot is equipped with trend-following logic. Specifically, it detects trends using the Parabolic Indicator and identifies when prices move significantly compared to normal fluctuations. You can input a desired number of pips (Price GAP pips) to determine at what price fluctuation the entry should occur. In case the trend reverses, all open orders will be closed. The number of simultaneous orders you can hold is customizable. Additionally, if you have multiple orders, they will all close o
FREE

This utility is designed to receive volumes from order books from larger crypto exchanges and transfer information to the indicator RealCryptoLevels . The RealCryptoLevels indicator by downloading the order book of crypt exchanges with maximum depth shows horizontal volumes of popular crypto currencies on the chart, so you can see not only the volumes, but also the levels and them strength (see screenshots), which is very important for successful trading in all strategies from scalping to m
FREE
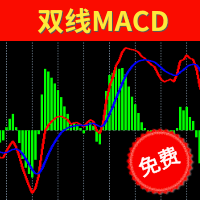
Two Lines MACD Many people who conduct technical transactions on MT4 like to use MACD to judge the turning or continuation of the market. When everyone uses the MACD indicator that comes with MT4, they find that the indicator is a single-line MACD, and the histogram seems to be similar to the past. The MACD that I understand does not match. In order to provide traders with a perfect trading experience, we especially provides free two-line MACD indicators for all traders! The single line in the
FREE

APP System Signals is a technical indicator designed for active users in the financial markets. It provides buy and sell signals based on a combination of tools such as Exponential Moving Averages (EMA), Simple Moving Averages (SMA), and trend analysis. The indicator features fully customizable settings, allowing users to tailor it to their individual preferences and trading approach. It is built with user-friendliness in mind, making it accessible to both beginners and experienced users.
FREE

Expert advisor based on your own personal moving average strategy. Whatever your strategy is, it's him. You can use it on all parities. No restrictions. Settings : Buy Settings 1.Moving Average Period 1.Moving Average Method 2.Moving Average Period 2.Moving Average Period Buy Lot Size Buy Stop Loss Level Buy Take Profit Level
Sell Settings 3.Moving Average Period 3.Moving Average Method 4.Moving Average Period 4.Moving Average Period Sell Lot Size Sell Stop Loss Level Sell Take Profit Level
Ve
FREE

Key Level Key Level is a MetaTrader 4 Indicator that uses a proprietary algorithm based on Price Retracement/Breakout Method to show the Entry-Line on your trading.
Instead, it analyzes data of market and identify entry points and opportunities. (Price Retracement / Price Breakout)
It's also a trading tool that be used to practice and enhance your manual trading skills.
Key Level is an amazing tool for Scalping Trader. It also a trading tool that be used to practice and enhance your manual trad
FREE

Introducing HammerMaster EA , your ultimate trading assistant designed for the MQL5 market. Harness the power of technical analysis with our expert advisor that identifies and capitalizes on hammer candlestick patterns. Whether you’re a novice or an experienced trader, HammerMaster EA offers robust features to enhance your trading strategy and maximize your potential profits. Strategy Overview HammerMaster EA is based on the identification of hammer candlestick patterns, specifically the bulli
FREE

Description: Automatic Equity Manager EA manages the whole account equity. You need to set it up on its own chart. -----------------------------------------------------------------------------------------------------------------------------------------
Parameters: EquityGainPercent = 3 (This automatically closes all trades when your equity shows a gain of X percent.) ---------------------------------------------------------------------------------------------------------------------------------
FREE
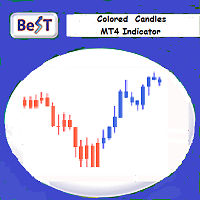
BeST_Colored Candles is an MT4 FREE indicator that can change the color of the Candlesticks based on the MACD, SAR or RSI values and levels. It is a Composite indicator that by selection uses the values each one of these 3 indicators and their critical levels in order to create numerical relationships that when satisfied cause their corresponding candlesticks coloration.
Input parameters
== Basic Settings
-- Please Select Indicator - for selecting which one of the above 3 indicators
FREE

This application is now replaced by Ofir Notify Light Edition (Free) or Ofir Notify (paid).
Thank all for your positive feedbacks.
Ofir Notify is a tool which send alerts on trades to Telegram Alert on any event concerning a position : Opening, Closing, modification (SL, TP) Send alerts to Chats, Groups and Channel Alert on Equity change Display Risk, Reward and progress of profit/lost for each position Customization of alerts ( only in full edition ) Sending charts screenshots with alerts
FREE
Stop Loss and Take Profit Manager The EA allows you to set a Stop Loss (SL) for your orders or positions within milliseconds, regardless of the number of orders. How to Use: Attach the EA to the chart where you want to modify the SL for your orders. Configure the following input settings : Order_Type: Select the order or position types. SetStopLoss: Enable this if you want to set a Stop Loss. StopLoss: Enter the SL price. SetTakeProfit: Enable this if you want to set a Take Profit. TakeProfit:
FREE

Never miss a trend change again! This indicator uses various calculation methods based on price action to detect changes in the direction of the trend. It can be used on high timeframes (from H1 to D1) and is most suitable for H4 and Daily timeframe. This indicator is compatible with all broker symbols (forex, indices, CFD, commodities, crypto…). It is also possible to open the indicator on several charts to follow several symbols at the same time. In addition, you don't have to stand by your P
FREE
Indicator Settings for SignalAlert The SignalAlert indicator is designed to track buy and sell signals from another indicator and send sound alerts when signals appear. SignalAlert is useful for working with indicators like Binary Sixty Scalping , where a quick reaction to signals is required. Indicator Settings IndicatorName – The name of the indicator from which SignalAlert will read signals. Specify the exact name, for example, "Binary Sixty Scalping," to ensure SignalAlert tracks its signals
FREE

SwingTradeMaster – a fully automated Expert Advisor based on classic Price Action and adaptive risk management.
The EA combines candlestick patterns (Pin Bar, Engulfing, Morning/Evening Star, Hammer) with RSI trend filters and ATR-based dynamic stop levels.
Transparent logic
Breakeven protection
Works on any pair and timeframe
Recommended for traders who want a professional, reliable and easy-to-use trading system. SwingTradeMaster is a fully automated Expert Advisor designed for swing and
FREE

Smart Scalper's Edge: The Triple-Filter Signal Tired of chasing false signals? The "Smart Scalper's Edge" is your unfair advantage in the market, designed for traders who demand precision and confirmation. This indicator doesn't just rely on a simple crossover; it uses a powerful triple-confirmation system to filter out the noise and pinpoint high-probability trading opportunities. Get the clarity you need to enter the market with confidence! Key Advantages: Trade Smarter, Not Harder Filter Out
FREE
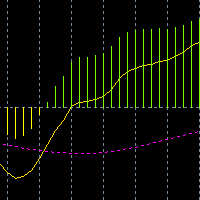
This is a user-defined algorithm based on MACD, which adds a signal line to make this indicator look like the MACD style popular in mainland China. At the same time, a pop-up box is added to indicate the buying or selling signal when two signal lines cross.
The yellow signal line shall wear the pink signal line, the pink signal line below, and the yellow signal line above, indicating long.
Under the yellow signal line, wear the pink signal line, under the yellow signal line, and above the p
FREE

MT5 Version Most indicators draw lines.
This one draws the battlefield. If you ever bought an EA or indicator based on a perfect equity curve — and then watched it bleed out live — you’re not alone.
The problem? Static logic in a dynamic market. Fibonacci Bollinger Bands adapts.
It combines Bollinger structure with customizable Fibonacci levels to mark zones of control — where price reacts, pauses, or reverses. No magic. Just logic that follows volatility. Why this tool matters It shows yo
FREE

EA Protrader Pivot is a automate and semi-automate Expert Advisor based on candlestick charts. Each order set stop loss with 200points and take profit 250 points. If one of two orders reach stop loss the new order open with new lot size (start lot is 0.01 and max lot is 0.08 ). This EA was backtested with XAUUSD in time frame M15 and spread 20 point. Automate - EA open buy and sell orders based on levels of candlestick chart with the first volume is 0.01 if this order touch stop loss EA cont
FREE

Other profitable programs https://www.mql5.com/en/users/ifyjava/seller The Solarwind No Repaint is a technical oscillator that applies the Fisher Transform to normalized price data, creating a histogram-based indicator that identifies potential market turning points. This indicator converts price movements into a Gaussian normal distribution, making cyclical patterns and momentum shifts more visible to traders. How It Works The indicator processes price data through several computational step
FREE

This indicator is based on the ADX indicator and indicates the trend very easily.
You can customize the indicator to your needs: ADXPeriod ADXSignal_Level BarWidth CandleWith HeikenAshi
The Adx color candles indicator is fully FREE and compatible with the other part of the system; the Acc arrow >>>> https://www.mql5.com/en/market/product/33770 ENJOY and check out my other indicator: https://www.mql5.com/en/market/product/32111
FREE
Description
The base of this indicator is an ZigZag algorithm based on ATR and Fibo retracement. This indicator is not redrawing in sense that the ZigZag's last shoulder is formed right after the appropriate conditions occur on the market. The shoulder doesn't change its direction afterwards (can only continue). Note: An indicator with advanced possibilities is also available.
Indicator input parameters
The input parameters allow to change the sensitivity of the ZigZag. ATR period ATR multip
FREE

It's a multi-currency grid and martingale system that can trade all input pairs from one chart. The expert will close all orders for each pair using a profit level. The expert has the possibility to trade up to 100 pairs.
Information
Chose a broker with fast execution and low spreads for effective results. Please make some tests on a demo account to see how the expert works before using it on a real account. For 0.01 lot size and leverage 1:500, you need an initial balance of at least 10,000 f
FREE

It uses three moving averages to analyze the market and generate buy and sell signals. The first and second moving averages are of the simple type with respective periods of 20 and 50. They are used to determine entry and exit points.
The third moving average is of the simple type with a period of 200. It is used to indicate the trend direction based on its position relative to the price. The robot only takes signals that are consistent with the trend, allowing it to reduce the number of false
FREE
Hello everyone!
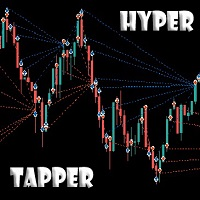
This Expert Advisor is developed based on hypertaping. Tick strategy, you won't be bored! The telegram group: https://t.me/FXAdvisorsMy Attention! Amazing results in a short trading period. Please pay attention to the increased risk, in order to trade it you need to have experience in trading with high leverage. The recommended minimum deposit is 2000 USD on a dollar account or 20 USD on a cent account. If you have any questions, do not hesitate to write to me.
FREE
Do you know why the MetaTrader Market is the best place to sell trading strategies and technical indicators? No need for advertising or software protection, no payment troubles. Everything is provided in the MetaTrader Market.
You are missing trading opportunities:
- Free trading apps
- Over 8,000 signals for copying
- Economic news for exploring financial markets
Registration
Log in
If you do not have an account, please register
Allow the use of cookies to log in to the MQL5.com website.
Please enable the necessary setting in your browser, otherwise you will not be able to log in.