 MetaTrader 5
 Uzmanlar
 Göstergeler
 Kütüphaneler
 Yardımcı programlar
 Widget'lar
 Kurallar
YouTube'dan Mağaza ile ilgili öğretici videoları izleyin
Bir alım-satım robotu veya gösterge nasıl satın alınır?
Uzman Danışmanınızı
sanal sunucuda çalıştırın
sanal sunucuda çalıştırın
Satın almadan önce göstergeyi/alım-satım robotunu test edin
Mağazada kazanç sağlamak ister misiniz?
Satış için bir ürün nasıl sunulur?
MetaTrader 4 için Uzman Danışmanlar ve Göstergeler - 51
 Alım-satım robotları piyasalarda otomatik olarak işlem yapar, göstergeler ise fiyatları analiz etmek ve fiyat değişikliklerindeki kalıpları belirlemek için kullanılır.
Bu alım-satım uygulamalarıyla, MetaTrader 4'te daha bilinçli alım-satım işlemleri gerçekleştirecek ve daha fazla alım-satım fırsatı yakalayacaksınız.
ATR on Prices is simply an ATR indicator that plot a line for Resistance and Support using the Average True Range calculation. You can set the ATR daily periods, to be calculated. As well you can set the reference price to add and subtract the ATR measure to obtain the ATR Top and ATR Bottom lines, using the Open Price (that is fixed) or the Middle (HL/2) price (that will vary on the day) Or adding the ATR to the daily low and subtracting it from the daily high . You can use full ATR measure or
FREE

RQL Trend Board – Description RQL Trend Board is a simple but powerful multi-timeframe trend dashboard.
It shows the current market bias across several timeframes at the same time, using an internal trend-classification method. Each timeframe is displayed as a colored box: Green – bullish bias → look for long setups
Yellow – ranging / unclear → no trade zone
Red – bearish bias → look for short setups The indicator gives a clear overall picture of where the
FREE

Account History Collector Panel The Advanced History Collector Panel is a professional-grade account analysis and visualization indicator for MetaTrader. It bridges the gap between raw trading logs and actionable insights by transforming execution data into interactive charts and comprehensive tables. Key Features: Comprehensive Data Metrics : Track daily/weekly profit and loss, long/short ratios, total volume, and deposit/withdrawal history. Dynamic Visualizations : Toggle between various char
FREE
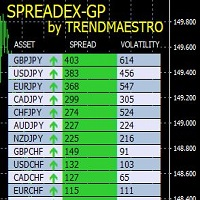
SPREADEX is an indicator for MT4 and MT5 that indicates the distance of an asset from the GP. The GP is the price of the true value of the underlying asset, obtained by estimation. The GP is like a magnet; it attracts the asset's price with a high probability and within the same trading day. Therefore, SPREADEX indicates which assets are currently furthest from the GP in real time. This provides traders with a point of view on which assets to focus on and look for price reversal signals to obtai
FREE
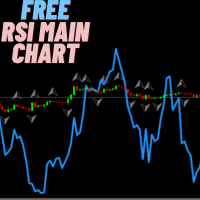
This indicator functions similarly to the traditional Relative Strength Index (RSI), but it's integrated directly onto the main price chart. This setup allows traders to more easily identify price fluctuations and recognize conditions of overbought or oversold markets. By observing the indicator in conjunction with price movements, you can gain valuable insights into potential trend reversals or continued momentum. Keep an eye on these signals to enhance your trading strategy. Happy trading, eve
FREE

input int hlength=85; input int vlength=25; input int DX=-340; input int DY=-80; input string InpDirectoryName="Data"; // directory name
input double lots_default=1; input int pc_times_default=2;
input double deposit_minimal=200; input double floating_loss_percent=10; input double margin_occupied=0.2; input int trade_allowed=1;//0代表测试模式 bool showbutton=TRUE; int tradingnumber=3;//控制买卖交易数量
struct edit_update { string symbol; int type; //0代表buy,1代表sell int magic;//代表magic double
FREE
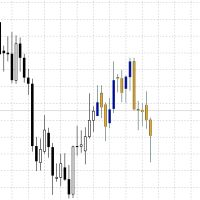
Future prediction is something any trader would love to know, through this simple prediction algorithm can give a picture of the future. This algorithm is based on past data and the average prices of the data to simulate future candles. This is an indicator that will be redrawn. This indicator is completely free, can be used as a trend reference but absolutely do not use for trading.
FREE
Velvet RVI is intended for use with the Velvet advanced ordering layer. It is based on the algorithm for the Relative Vigor Index, provided by Investopedia here . All of the data it displays is accurate and verified against the internal API function iRVI, when it is detected by the ordering layer. In order to place orders with the Velvet RVI indicator, the ordering layer must be installed and running. Ordering from the Velvet RVI indicator requires that "Velvet Ordering Layer" ( found here ),
FREE

Asesor Experto creado a base de una estrategia de 3 medias móviles. Puedes configurar los parámetros de cada una para lograr cruces de medias a medida. Puedes establecer los valores de TP y SL Cuenta con sistema de SL dinámico para proteger tus ganancias. Este asesor permite realizar Backtesting muy completo para crear estrategias solidas a tu gusto. Si conoces alguna confirmación basada en otro indicador para validar el cruce de la media y hacer este asesor aún más ´preciso, házmelo saber para
FREE
The Multi Trendlines indicator automatically draws the dominant trendlines on the current chart. The indicator looks for the 5 best Up trends and the 5 best Down trends as at the current price, drawing each trendline if filter conditions are met. The trendlines are named "Trendline"+[Direction]+Symbol()+TrendlineSequenceNumber For example: The second Up trendline on a EURUSD chart would be named "TrendlineUpEURUSD2". To get its current value would be: ObjectGet("TrendlineUpEURUSD2",OBJPROP_PRI
FREE
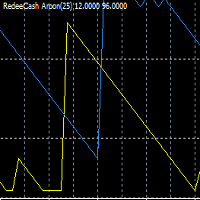
Version History Date Version Changes 07/08/2022 1.00 Initial Release Description The Aroon indicator is a technical indicator that is used to identify trend changes in the price of an asset, as well as the strength of that trend. In essence, the indicator measures the time between highs and the time between lows over a time period. The idea is that strong uptrends will regularly see new highs, and strong downtrends will regularly see new lows. The indicator signals when this is happening, and
FREE
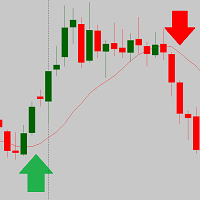
The script is based on the indicator Stochastic Oscillator.
The script draws up arrows or down arrows.
The tooltip arrows indicate the recommended price level.
The script can signal an alert, which also indicates the price level.
The script draws an up arrow when the Stochastic Oscillator lines go out of the oversold zone.
The script draws a down arrow when the Stochastic Oscillator lines out of the overbought zone.
Indicator signals are not filtered in any way - this is the classic Stocha
FREE
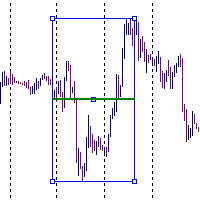
It is just an alternative fibo lines, because mt4 have is a very strange drawing of fibo lines A simple Box (Rectangle) graphic element with adjustable levels binding: it is possible to specify up to 17 custom levels, all rectangles on the chart with the given prefix in their name are processed. Levels are specified in % of the height of the rectangle. A convenient graphical element for analyzing charts by growth-correction levels. Enjoy your work!
FREE

The indicator's source code is for sale; those interested can contact me via PM. Swing Counter MT4 is a free and powerful trading indicator designed to help traders identify and count market swings with precision. It automatically detects swing highs and swing lows, making market structure easier to read and helping traders spot potential trend continuation and reversal opportunities. Built for simplicity and efficiency, Swing Counter MT4 can be used on Gold (XAUUSD) and is fully adaptable to al
FREE

This indicator is based on the Channel . Input Parameters channel_One- show trend line One on or off. timeFrame_One - time Frame of channel One . ColorChannel_One - color of trend line One. channel_Two- show trend line Two on or off. timeFrame_Two - time Frame of channel Two . ColorChannel_Two - color of trend line Two. channel_Three- show trend line Three on or off. timeFrame_Three - time Frame of channel Three . ColorChannel_Three - color of trend line three. channel_Four- show trend line F
FREE

Action Scanner is a market scanner. It’s yet another product in my "Can’t trade with out it" series. Do you want to know what is moving right now? Action Scanner scans your watchlist and opens the 10 currently most moving charts. You can chose between, most moving in points, most moving in your account currency(if you were to trade it with a standard lot size 1.00) and most moving in percentage. The standard version is a complete tool with no limitations. However the pro version has additiona
FREE
The Parabolic SAR Trailing Stop will trail the Stop Loss price of your selected orders following the PSAR indicator, so you don't have to worry about having to change it manually.
How does it work? The Expert Advisor sets and moves the Stop Loss price of the selected orders following the value of the PSAR Indicator. You can filter the Orders by Symbol Comment Magic Number Buy/Sell
Parameters PSAR Step - The Step of the PSAR PSAR Max Step - The Max Step of the PSAR PSAR Shift - The Shift of the
FREE
Indicator of vertical lines on the timeframes М5 and М1. It draws the lines for the period of the current day and the previous day. This indicator visualizes visually shows the trader the beginning and end of the chart hour, as well as the past hourly periods, 30-minute and 5-minute chart intervals. The advantage provided by this indicator is that the trader using this indicator on a chart of a currency pair with the smaller timeframe will always be aware of when the new hour begins.
On the con
FREE

Market Session PRO MT4 – Smart Session Visualization Boxes
Market Session PRO MT4 is a powerful and lightweight indicator designed to help traders clearly visualize the major forex trading sessions directly on your charts. This tool automatically highlights the Tokyo, London, and New York sessions, allowing you to better understand market behavior, volatility, and key trading opportunities. Key Features: Automatic Session Detection
Accurately plots Tokyo, London, and New York sessions using au
FREE
The SDX Chart is a free additional indicator which can be used in combination with SDX Dashboard .
Features Ability to review the history of each symbol and time frame. Ability to change symbols and time frames with one click. Works perfectly in combination with SDX Dashboard and helps you to understand the system better. Settings
MA Period - number of periods for the calculation of the moving average and the standard deviation. Number of Bars - how far back to draw the indicator. Buttons Size
FREE
Real-time spread tracking and monitoring software
Displays spread values in form of histograms on current timeframe of chart Convenient for analyzing spread changes, as well as for comparing trading conditions of different brokers By placing on desired chart, the spread changes at different trading times are displayed
Additionally Fully customizable Works on any instrument Works with any broker
FREE

Key Features & Core Logic ATR Rope Indicator Logic (Pine Script Replication) Utilizes a custom-calculated Average True Range (ATR) "Rope" mechanism that adapts dynamically to market volatility . Functions as a trailing baseline and trend-direction filter, helping the EA stay on the right side of market momentum Scoring System & Risk Filtering Evaluates market conditions through a comprehensive scoring algorithm (out of 14 points for both Buy and Sell sides) . Trades are only executed or alerted
FREE

The OHLC indicator shows the current and historical values of High, Low, Open, Close and Mid for a specific time period. It can plot the current values or the values from the previous session. The indicator's range can be calculated from a daily, weekly, monthly, or user-specified session.
Levels High of the current or previous session. Low of the current or previous session. Open of current or previous session. Close of the current or previous session. Midpoint of the current or prev
FREE
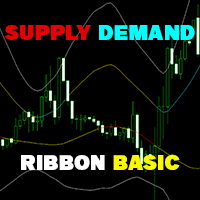
Supply Demand Ribbon is an indicator with moving supply and demand lines that help you identify price zones more easily. The indicator helps you determine flexible entry, stop loss, and take profit areas. There are also strategies for algorithmically changing ribbon colors. From there you can come up with many trading strategies for yourself! MT5 Version: Click here!
You can explore many feature in Advanced version here ! You can combine it with our indicators below to make your tradin
FREE
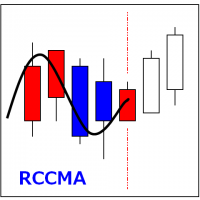
RCCMA is a general moving average indicator that works with ReviewCandleChart. Original is "Custom Moving Average" provided by MetaQuotes Software Corp. Based on that source code, I corresponded to ReviewCandleChart .
Advantages When ReviewCandleChart is ON, no line will be displayed on the right side from the vertical reference line. When ReviewCandleChart is ON and you press a key such as "Z" or "X" Following that, the MA is drawn. When ReviewCandleChart is OFF, the same drawing as the origin
FREE

Power Trend Free - the indicator shows the trend strength in the selected period.
Input Parameters The indicator has three input parameters: Period - a positive number greater than one, it shows the number of candlesticks used for calculations. If you enter one or zero, there will be no error, but the indicator will not be drawn. Applied Price - the standard "Apply to:" set meaning data used for the indicator calculation: Close - Close prices; Open - Open prices; High - High prices; Low - Low p
FREE
Designed especially for GBPUSD 30m market. Minimum trading account 1000 $. The EA trading engulfing candle formations combined with adx indicator. There are 3 main methods of orders placement and management, all three methods are profitable with different results for user to chose. tested on a specific market and timeframe but can operate on other markets ass well.
developed, tested and optimized on " VantageMarkets " platform.
FREE
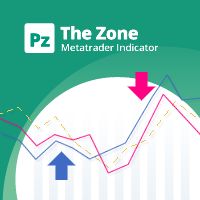
This indicator displays buy or sell signals according to Bill Williams' definition of the Trading Zone. [ Installation Guide | Update Guide | Troubleshooting | FAQ | All Products | Get Help ] Easy to use and understand Avoid trading flat markets Deterministic indicator with clear rules The indicator is non-repainting It implements alerts of all kinds It has straightforward trading implications. A blue arrow is a buy signal A red arrow is a sell signal According to Bill Williams trading in t
FREE

OHLC Magnet adds the missing magnet points for Horizontal Lines, Rectangles, and Price Labels. Instructions:
Simply drag one of the aforementioned objects to the desired Open, High, Low, or Close , within the Pixel Proximity, and OHLC Magnet will automatically attach the object to the exact price point you chose. Parameters:
Proximity (Pixels): The proximity, in pixels, to how close your mouse cursor must be to the Open/High/Low/Close for the utility to attach to that specific price point. Defau
FREE

Market Power Index (MPI): The Trader's Battlefield Intelligence When bulls and bears clash, MPI shows you who's winning. It measures the real-time balance of power between bulls (buyers) and bears (sellers) in any given market.
Now you can make informed decisions with the only indicator that measures both sides of the market simultaneously!
Professional-grade market analysis, simplified for every trader.
Available on both mt4 and mt5 platforms Free! Who Needs This? Forex traders (all exper
FREE

Risk Panel Pro (MT4) Risk Panel Pro is a Tool for MetaTrader 4 that automates placing Stop Loss and Take Profit based on a percentage of the account balance. It is a trade management utility; it does not provide trading signals and does not guarantee any profit. Main functions Auto-apply SL/TP on new orders using balance-based risk (default: SL 2%, TP 4%). Switch Automatic mode off to manage SL/TP manually. One-click buttons to apply SL or TP to existing positions at any time. Close Chart : clo
FREE
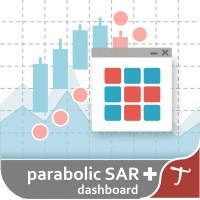
Tipu Parabolic SAR Dashboard is based on the Tipu Parabolic SAR indicator. Please contact me here at MQL5 if you would like to use this panel for your custom signals. Tipu Parabolic SAR Dashboard is a multi-currency, multi-timeframe panel created to help traders in analyzing the markets quickly using the Parabolic SAR indicator signal. The dashboard panel is designed to help traders quickly change symbols and periods. If you are constantly missing trade opportunities while browsing through the

The technical indicator, in real time, searches for candlesticks that exceed the size set in the settings and gives signals about them. As a rule, such abnormally large candles appear either at the beginning of strong impulses or at the end of a directional price movement. At the beginning of the pulse, the signal can serve as a basis for searching for an entry point, at the end of the movement, it is a sign of a climax and may indicate the near end of the trend. The reference size for filtering
FREE

Hello, I need reviews from you guys. Thank you Fractal Swing Detector Pro Indicator is designed to help traders identify key swing points in the market . By combining fractal an d pivot analysis, this indicator provides deeper insights into price movements an d potential reversals. Key Features: Fractal Analysis: Identify high and low fractals with the option to use either 3 or 5 bar fractals . Fractals help detect minor reversal points within trends. Pivot Points: Advance d pivot
FREE
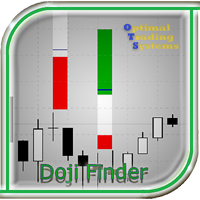
The indicator searches for and displays Doji candlesticks on the chart and signals the appearance of such a candle. The direction of the signal depends on the direction of the previous candles, as the Doji signals a reversal or correction. In addition to the possibility of signaling, the power of the reversal is graphically shown (the more green, the more likely growth, the more red, the price will fall). In the indicator settings, you can change the parameters of the Doji candlestick, the closu
FREE

Bu Uzman Danışman (EA), yüksek getirili bir tasarruf hesabı gibidir, çünkü gecelik faiz ödeyen (kazanan) döviz çiftlerinde bir ticaret gerçekleşir. Giriş ve çıkış pozisyonları, alış ve satış emirleri için sırasıyla En Düşük/En Yüksek ve En Yüksek/En Düşük fiyatlara ilişkin yeniden inceleme dönemine dayalıdır.
Ortak Girişler,
SINGLE_CURRENCY = true, tek bir para biriminde işlemlere izin verir, devre dışı bırakıldığında (FALSE), metatrader'da piyasa izleme penceresinde seçilen para birimlerinin
FREE

One Click Close All is a script that when thrown on any chart will automatically close all orders regardless of the asset or what type of orders they are, it will close everything much faster than a human could. You will find paid versions of the same style of this script, but read carefully and you will see that it performs the same function ... here you have it for free, enjoy it.
FREE

I present an effective tool for determining the reversal on the H4 timeframe. The indicator is installed on the M30 chart. All parameters are already set. Proper use of the indicator: Unfortunately, the test in the tester will not give a correct idea about the indicator, so the rent for one month is as affordable as possible. You do not need to install the file on a remote server. Install it
FREE
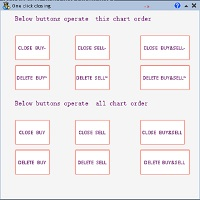
一键平仓小工具,可以针对买单、卖单和挂单进行批量操作,可以操作当前图表订单和所有订单,简单高效。 第一行第一个按钮是关闭当前图表 品种 所有买单,第二个按钮是关闭当前图表品种的所有卖单,第三个按钮是关闭当前图表 品种 的所有订单; 第二行 第一个按钮是删除当前图表 品种 所有买单挂单,第二个按钮是 删除 当前图表品种的所有卖单 挂单 ,第三个按钮是 删除 当前图表 品种 的所有 挂单 ; 第三行第一个按钮是关闭所有 品种的全部买单,第二个按钮是关闭所有 品种的全 卖单,第三个按钮是关闭所有 品种的全部订单; 第四行第一个按钮是删除所有 品种全部买单挂单 ,第二个按钮是 删除 全部品种 的全部卖单挂单 ,第三个按钮是删除 全部品种 的全部挂单 。 希望此程序能对您有用
FREE

Check out other great products from https://www.mql5.com/en/users/augustinekamatu/seller
This indicator is the best so far at determining the currency strength of each pair. It provides stable values and is highly adaptive to market changes. It is a great tool to add to your arsenal to make sure you are on the right side of the trend at all times. No inputs required, it is simple plug and play. A Winning Trading Strategy This article describes the components and logic needed to develop a tra
FREE
High, Low, Open, Close — isn't this too much? Sometimes you need a unique history of prices. But if choose one thing, you lose the rest. Smoothing also leads to data loss. Often you lose one of the most important market details: information about extremes. It is due to the preservation of information about the highs and lows, the correct "smoothing" for the history of price is a zigzag. But zigzags also have drawbacks — they do not provide intermediate values. The Price Line indicator solves thi
FREE
Color Levels - удобный инструмент для тех, кто использует технический анализ с использованием таких инструментов, как Трендовая линия и Прямоугольник. Имеется возможность настройки двух пустых прямоугольников, трех закрашенных и двух трендовых линий. Настройки индикатора крайне просты и делятся на пронумерованные блоки: С цифрами 1 и 2 вначале - настройки пустых прямоугольников (рамок); С цифрами 3, 4 и 5 - настройки закрашенных прямоугольников; С цифрами 6 и 7 - настройки трендовых линий. Объе
FREE
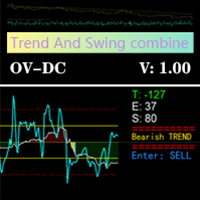
Based on the trend-following principle of CCI, it has been improved to become an indicator that can identify the reversal of the trend and its development direction, that is, it can identify the top and bottom attenuation of the oscillating trend in the trend market. feature The red and green columns represent the trend of bullish or bearish development under the current cycle. The blue line shows the position and attenuation of the current price trend in the current cycle. The upper and lower r
FREE

This is a free version of our Great tool with limited functions. The ChartChanger is a great utility tool to reduce the number of open charts on your terminal. There is three section to it: Symbols, Time frames and Templates. You need only one chart to be open and still you can scroll up to multiple ones. Symbols: With the push of a button you can change from one symbol to another, and your applied indicators will stay on the next chart. For the symbols there is an auto detection mode, or you ca
FREE
This indicator uses Bollinger Bands lines to detect markets trend. It's a very useful tool for manual trading. Furthermore it is possible to use the indicator with ATR as a filter , as well as the option to pop up an alert when a reverse trend occurs. The readings are very simple to use and understand. Indicator works best on H1 timeframe.
You can to get source code from here .
Parameters BarsCount - How many bars used to show the line. BBperiod - Period of Bollinger Bands. BBdeviations - Devi
FREE

The indicator is designed to determine the pivot level for a group of candlesticks and the trend direction. no repainting calculation is done on an active candle if candlesticks are above the main line, the trend is upward if candlesticks are below the main line, the trend is downward breakdown of the main line signals a trend change or a price rebound two display modes, normal and with acceleration (ModeLite) an auxiliary line displays the resistance line
Configurations BarsHistory - how many
FREE

[ Introduction ] . [ Installation ] Introduction
Python is a high level programing language with a nice package management giving user different libraries in the range from TA to ML/AI. Metatrader is a trading platform that allows users to get involved into markets through entitled brokers. Combining python with MT4 would give user an unprecedented convienance over the connection of brokers and the freedom of library utilization. The potential of your EA now becomes unlimited as you can create
FREE
Простая утилита MQLTA Draw Grid поможет вам нарисовать сетку на вашем графике. Она полезна при изучении графика и моделирования сетки.
Как она работает? Утилита будет создавать горизонтальные линии в зависимости от заданных параметров
Как использовать этот инструмент Установите индикатор на график, выбрав параметры по умолчанию. Выберите начальную точку, значения минимума и максимума диапазона и стиль. В появившейся графической панели вы сможете создавать и удалять сетку, а также изменять неко
FREE
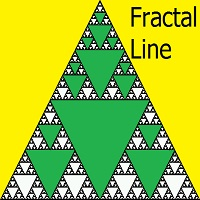
This indicator draws lines based on the standard Fractals indicator. Once a fractal is broken up or down, the indicator generates an alert, sends an email notification and a push message to your mobile phone.
User Inputs History - the number of bars in history for calculation. Color Up Fractal - the color of the upper fractal line. Color Down Fractal - the color of the lower fractal line. Width - the line width. Alerts - alert. EmailAlerts - email notification. NotificationAlert - push notifica
FREE

Alerts utility issues notifications when orders are opened, closed and removed, as well as when the price touches the selected graphical objects on the chart. The utility supports all graphical objects used in graphical analysis and features a simple graphical interface. Once launched, the indicator works in the background, does not take up space on the chart and does not consume system resources. Tracking order status.
If tracking order status is enabled, the utility automatically checks order
FREE

Perseus is a free Expert Advisor for GBPJPY . It based on MACD and Bollinger Bands . It has been tested for 10 years of history (from year 2011). Tested by Monte Carlo with 200 simulations too. All trades are cover by StopLoss . Doesn't use Martingale or other dangerous startegies. Perseus using fixed lot size, which you can set in settings. Perseus settings are optimized for the best results . There is no need to change it.
Recommendations Symbol: GBPJPY Timeframe: H1 Deposit: 300 USD Br
FREE
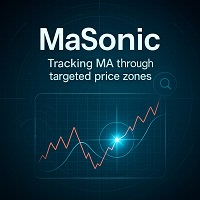
Quickly search for matching Moving Averages (MAs) at any point you click on the chart! Experience the speed and ease of MA Search today.
Features: Easy operation: Click on any point where you want to find the MA. Instant Results: Displays matching MAs if found. Sleep function: Hides buttons when not in use to keep the interface clutter-free. Manual Control: Manually adjust the MA using the on-screen buttons. Fixed MA: Once you find an MA, you can pin it there independently of
FREE

This EA only created for AUDCHF with an Risk Reward 1:2 Download Set Files - CLICK HERE NO GRID, NO MARTINGALE and NO MORE OVERTRADING. Add This to Activate News Filter - https://ec.forexprostools.com/ Features :- Symbol AUDCHF Brokers IC Markets, Tickmill, Pepperstone Account Type Raw Spread, Pro, Razor Leverage Recommended 1:500 Timeframe 15M Settings Download Minimum Deposit $100 Risk Reward 1:2 Strategy Market Movement
Why Should You Use This EA:
Market Movement Strategy. Hard
FREE
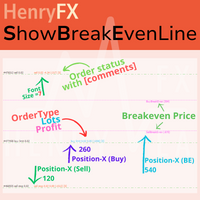
This indicator can help easy to management your order on screen.
FREE Version, included: - " Show Breakeven Price "
Show Breakeven Line Pro : : https://www.mql5.com/en/market/product/58289
Input Parameter: " Label Prefix "
:: [ ] Description; " Position-X-Dis "
:: [ ] Description; " Position-Y-Dis "
:: [ ] Description; " Show Market Price "
:: [ ] Description ; " Price Up Color "
:: [ ] Description; " Price Down Color "
:: [ ] Description ; " Position-Y-D
FREE

Super Ichi İndikatörü Nedir? Super Ichi, Ichimoku Kinko Hyo ve SuperTrend indikatörlerinin gelişmiş bir kombinasyonudur. Bu güçlü teknik analiz aracı, piyasa trendlerini belirlemek ve alım-satım sinyalleri üretmek için tasarlanmıştır. Ne Yapar? Çift Seviyeli Trend Analizi : Tenkan-sen ve Kijun-sen çizgilerinin özelleştirilmiş versiyonlarını kullanır Otomatik Sinyal Üretimi : Kesim noktalarında görsel işaretler (oklar) gösterir Anlık Alarm Sistemi : Yeni sinyaller oluştuğunda sesli ve görsel uyar
FREE

Bir carry trade üç ay boyunca sessizce swap biriktirip, bunun tamamını bir haftalık fiyat hareketinde kaybedebilir.
Önemli olan swapın büyüklüğü değil, o sembolün ne kadar hareket ettiğine göre büyüklüğüdür. Terminaldeki ham sütun bu soruyu yanıtlamaz: değerler farklı birimlerde yayımlanır, sözleşme büyüklükleri farklıdır ve oynaklık büyüklük mertebesi bakımından farklıdır. Bu sayılar zaten birbiriyle karşılaştırılabilir değildi.
Swap Scanner her sembolü mevduat para biriminizde tek bir değer
FREE

**Exit Manager — trail and close your trades by rule**
Exit Manager takes over the exits on trades you already have open. You open positions however you like — by hand, from a signal, or from another EA — and this one manages them out with three rules you can mix: a peak-based Trailing Take-Profit, a Time-in-Trade close, and an ATR-trailing stop.
Exit-only EA: it never OPENS trades; it manages and closes existing ones.
MO işlem araçları serisinin bir parçasıdır — diğer ücretsiz ve ücretli ar
FREE

TradeSnap, bir SATIN AL/SAT emri yürütüldüğünde ekranı otomatik olarak yakalar ve kaydeder.
Basitçe tablo üzerinde ayarlayın ve herhangi bir ekstra çalışma olmadan otomatik olarak kaydedilecektir.
Grafikteki çizgiler, oklar vb. de görüntüde olduğu gibi kaydedilir.
10000x10000 piksel olabilen resim boyutu, böylece fiyat hareket geçmişini gösteren yatay bir resim kaydedebilirsiniz.
Parametre bilgisi
--Olay Parametresi--
Sihirli sayı (0=ALL): Herhangi bir EA'nız varsa, Mugic Number'ı ayarlay
FREE
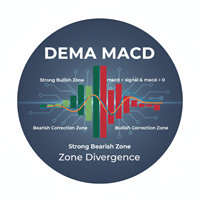
Indicator: The DEMA MACD Zone Divergence This is a powerful, multi-timeframe trend-following indicator based on the Moving Average Convergence Divergence (MACD) , but enhanced using Double Exponential Moving Averages (DEMA) for reduced lag. Its main function is to paint the background of the price chart with color-coded rectangular zones, clearly signaling the current momentum phase and potential shifts in market control (bullish or bearish). Core Purpose To visually map the strength and phas
FREE
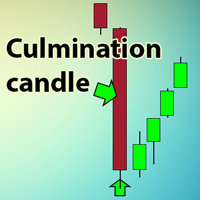
The indicator searches for the largest candles with minimum wicks for the last X candles. Sometimes, such candles mark the presence of a strong buyer, who quickly and strongly pushes the price in the right direction. However, most often, these are culmination candles, especially at the end of a prolonged trend when a single large candle knocks out stop losses of the most persistent traders and the price reverses instantly. The indicator allows you to open a position on the very edge of the marke
FREE

MACD Trend FREE is Expert Advisor for EURJPY based on MACD Indicator . You can completely edit settings of MACD Indicator, TakeProfit, StopLoss and TrailingStop. Default paramters are optimized for best results. But you can test other settings for antoher currency pairs or timeframe. MACD Trend FREE has been tested from year 2003 to 2021 . My test used the real tick data with 99,90% accuracy. Doesn't use Martingale or other dangerous strategies.
Recommendations
Symbol: EURJPY Timeframe:
FREE
This indicator is designed to find the difference in MOMENTUM price and indicator. This indicator shows the price and indicator difference on the screen. The user is alerted with the alert sending feature. Our Popular Products Super Oscillator HC Cross Signal Super Cross Trend Strong Trend Super Signal Parameters divergenceDepth - Depth of 2nd ref. point search Momentum_Period - Second calculation period indAppliedPrice - Applied price of indicator indMAMethod - MA calculation method findEx
FREE
This trend Advisor is conservative in every sense. It is similar to the E79U EA, but has important differences.
First, its algorithm selects signals more flexibly and rigidly. This allows you to increase the lot for trading.
Secondly, the author's settings are initially conservative.
And most importantly, this EA does not accept a small stop loss. Signals are opened not often and very selectively. He will not make a profit if he loses on the stops. I did not completely remove the stop loss,
FREE

Succubus is a universal expert Advisor.
Its main advantage is the highest entry accuracy, 90% of transactions and above.
The expert Advisor parameters are divided into categories according to the function that the user needs. All functions can be disabled.
The expert Advisor is designed to disperse small and medium-sized deposits.
Main:
TakeProfit - number of points to close a trade with a profit
StopLoss - number of points to close a trade with a loss
Slippage - Slippage
Magic-adviser
FREE

Aurora P&L Dashboard — Free
Aurora P&L Dashboard puts your profit and loss right on the chart — so you can close the crowded terminal window and still keep the overview.
Live on your chart:
Today — realized P&L since midnight (server time)
N days — realized P&L over a period you set
Positions — number of open positions and total lot
Floating — current open P&L
Two modes:
Account-wide — all symbols together
Single symbol — type any symbol (e.g. EURUSD, USDJPY), or leave blank for the chart
FREE
Trend Korelasyon Gücü (TCS) Göstergesi: Forex Trend Analizinde Avantajınız Trend Korelasyon Gücü (TCS) Göstergesi , trend gücünü ölçme şeklinizi yeniden tanımlayan, Ortalama Yön Endeksi (ADX) gibi geleneksel göstergelere göre önemli bir avantaj sunan son teknoloji bir araçtır. Yönlü harekete dayanan ADX'in aksine, TCS, kapanış fiyatları ile doğrusal bir zaman serisi arasındaki korelasyonu hesaplayarak trend gücünü benzersiz bir şekilde nicelendirir. Bu yenilikçi yaklaşım, forex yatırımcılarına g
FREE
This indicator uses a formula based on bollinger bands to determine if the market is in Range or not. It can be used to filter entries and not operate in a sideways market.
It has a minimum value of 0.2 from which it could be operated, although you can modify it in the options to adjust it to your trading style or the market you use.
If the histogram below is red, the market is in range, if it is green, volatility is higher.
FREE

The Effective Advisor is your trading assistant.
It can be used in fully automated or semi-automated mode.
You can trade with one order or several, setting specific position averaging.
Trading is based on the MACD indicator.
The indicator settings are standard and built into the Advisor (they can be displayed in the Advisor upon request).
Averaging occurs without a multiplier (you can only manually increase the lot size).
The lot size, distance, and Take Profit can be customized to suit y
FREE

I had this EA produced by an expert. No grid or martingale , just pure trend following. The arrows of the indicator used on the chart indicate trading signals in trend following. You can find the indicator in the comments. My trading signal is generated when the indicated arrow direction changes. A trade is then kept open until the arrow direction changes again. If the arrow then changes in the opposite direction, the previous position must be closed automatically and a new position opened in th
FREE
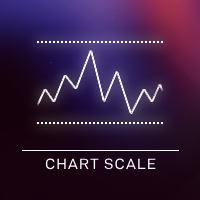
Do you want tidy and attractive charts? Let Hogvid Chart Scale help you! Chart Scale automatically scales the height of the chart to a configurable percentage of the total window height.
This creates space at the top and bottom of the window for additional visual elements and increases clarity without having to manually adjust the vertical scaling which can be annoying, especially if you change the chart symbol frequently.
The function can be activated and deactivated at any time with a simple
FREE
MetaTrader Mağazasının neden alım-satım stratejileri ve teknik göstergeler satmak için en iyi platform olduğunu biliyor musunuz? Reklam veya yazılım korumasına gerek yok, ödeme sorunları yok. Her şey MetaTrader Mağazasında sağlanmaktadır.

Alım-satım fırsatlarını kaçırıyorsunuz:
- Ücretsiz alım-satım uygulamaları
- İşlem kopyalama için 8.000'den fazla sinyal
- Finansal piyasaları keşfetmek için ekonomik haberler
Kayıt
Giriş yap
Web sitesi politikasını ve kullanım şartlarını kabul edersiniz
Hesabınız yoksa, lütfen kaydolun