Watch the Market tutorial videos on YouTube
How to buy а trading robot or an indicator
Run your EA on
virtual hosting
virtual hosting
Test аn indicator/trading robot before buying
Want to earn in the Market?
How to present a product for a sell-through
Expert Advisors and Indicators for MetaTrader 4 - 52

PartialAutoClose EA is a utility EA that enables semi-automatic and flexible management of positions opened by manual or discretionary trading.
[Main Features] - Choose from two exit logic types: Automatically closes positions based on either Heikin Ashi color change or moving average cross. - Automatic break-even stop When a specified profit is reached, the stop loss is automatically moved to break-even (or a user-defined level). - Partial or full close selectable On exit signal,
FREE

ProTrade Panel – Speed, Precision, Professionalism Master the markets with the ultimate MT4 assistant. Are you tired of the slow, clumsy default execution in MT4?
Do you struggle to manage multiple orders during high volatility?
ProTrade Panel is designed for serious manual traders. It combines One-Click Execution, Breakout Pending Orders, Bulk Closing, and Visual Risk Management into one sleek, floating interface. Key Features Smart Drag & Drop : Long-press the header to move the
FREE

This EA is a free version of Tiger Grid which is available here: https://www.mql5.com/en/market/product/33835
Tiger Grid EA is an expert advisor using trading strategy which has been developed by using machine learning concepts. It has passed 14 years of backtest of real tick data and real variable spread (with commission) from 2004 to 2018. The entries are usually accurate and in case if the trend signal has a delay the positions will be managed by a smart grid system. This system uses a gr
FREE

Broken Trends is an indicator for scalpers and intraday traders. The indicator selects and displays trend levels on the chart in the real time mode. The indicator reacts to price momentum: it starts searching for the trends as soon as the momentum amplitude exceeds the threshold set in a special parameter. The indicator can also play a sound when the price crosses the current trend line. In normal mode, the indicator shows only one (last found) upward and one downward trend, but there is an adva
FREE

TMA Classic – Overview of the Triangular Moving Average Indicator The TMA Classic is a very simple and lightweight indicator that displays the Triangular Moving Average (TMA) as a single smooth line. It effectively removes excessive noise and captures the central movement of prices, making it useful for identifying trend direction and range-bound market conditions. Since it only displays a single line, it offers high visibility on the chart without interfering with other indicators or candlestic
FREE

В основе индикатора TDI лежат следующие индикаторы: RSI, Moving Average, Bollinger bands, но основным из них нужно выделить RSI, весь расчет индикатора завязан от его значений.
Зеленая линия (линия RSI) – сглаженные простой (по умолчанию) скользящей средней значения индикатора RSI, период сглаживания 2.
Красная линия (сигнальная линия) – сглаженные простой (по умолчанию) скользящей средней значения индикатора RSI, период сглаживания 7.
Синие линии – индикатор Bollinger bands по умолчанию пери
FREE

Supp & Resist Every Trader Need that an Indicator will show you zones for weak, Untested, Verified, Proven and Reversal Support and Resistance with smart calculation. take a look for the Screenshots there some explanations. i don't want to talk a lot :) try it by yourself for FREE because everything is clear in the inputs parameters. If you have any question feel free to ask me.
FREE
Hi Friends, This free indicator displays Tick chart on MetaTrader4 platform. Feel free to use it for Day trading or Scalping. Please give generous reviews and feedbacks for the product. All The Best!
Note: When this indicator is initially applied to a chart, it will not show any output. Once price starts moving then Ticks will start getting displayed. Thus when markets are closed, it won't have fresh ticks to display.
About us We are a small team of professional traders with experience in fore
FREE

EA Protrader Pivot is a automate and semi-automate Expert Advisor based on candlestick charts. Each order set stop loss with 200points and take profit 250 points. If one of two orders reach stop loss the new order open with new lot size (start lot is 0.01 and max lot is 0.08 ). This EA was backtested with XAUUSD in time frame M15 and spread 20 point. Automate - EA open buy and sell orders based on levels of candlestick chart with the first volume is 0.01 if this order touch stop loss EA cont
FREE
Highly configurable Osma indicator.
Features: Highly customizable alert functions (at levels, crosses, direction changes via email, push, sound, popup) Multi timeframe ability Color customization (at levels, crosses, direction changes) Linear interpolation and histogram mode options Works on strategy tester in multi timeframe mode (at weekend without ticks also) Adjustable Levels Parameters:
Osma Timeframe: You can set the lower/higher timeframes for Osma. Osma Bar Shift: Y ou can set th
FREE

Use GANN 369 to use a combination of 30's,60's,90's time to cross 3's,6's,9's. Any larger combination of these cross smaller combinations of these
Using GANN 369 Method for Trading Reversals The GANN 369 method, inspired by the works of W.D. Gann and Nikola Tesla's 3, 6, 9 numerical patterns, can be employed to identify potential reversals in financial markets. By combining specific periods (30, 60, and 90) with the numbers 3, 6, and 9, traders can seek opportunities for trend changes.
FREE

Bamboo expert 4 is based on the custom indicator Bamboo 4 . Entry points are determined using Bamboo 4 values. Positions are closed when reaching specified profit and loss levels or when opposite signal appears if Stop Loss and Take Profit values are zero. Input Parameters Period - Period parameter of the indicator Bamboo 4; Mode - operation mode of the Expert Advisor (0-7); Stop Loss - loss fixing level in points; Take Profit - profit fixing levels in points; Lot - lot size; Magic Number - "mag
FREE

Индикатор отображает скользящие средние на заданном количестве баров ( Count bar for show MA ). Данный способ отображения упрощает анализ, так как график не загромождён лишними линиями. Так же имеется текстовая метка с отображением текущей цены скользящей средней и периода графика. Горячие клавиши служат для упрощения использования индикатора.
Настройки индикатора: Moving average #1 - скользящая средняя #1 Period - период усреднения Mode - метод сглаживания Price - используемая цена для расчё
FREE

Use my recommended broker: https://icmarkets.com/?camp=61478 You have most likely heard about the term "Less is more". I can tell you one thing that's also the case with the Monkey CCI on Bollinger indicator! One indicator will give you the best of both worlds, easy to determine trend, the strength of the trend and overbought and oversold levels. This indicator is very simple to follow: Green line uptrend Red line downtrend Above band overbought Below band oversold With this indicator you cou
FREE

NEW VERSION of Gemini: Changes with signal combinations, SL/TP values and amount of pairs and TF’s available. Please make sure you download V 1.1 and ONLY use set files for each pair and TF given! Signal has been updated with this new version. Gemini is a complex Expert Advisor that uses Awesome Oscillator closing bar price, ATR Ranges and Bar Pattern combinations for opening trades with managing and closing trades based on Bollinger Band Width Ratio’s. Though the algorithms are consta
FREE

Summary This indicator is based on the MA applied to the Momentum indicator. It draws arrows at the confirmed crosses of the MA over the Momentum line. When the MA crosses upwards, then a buy arrow is displayed and vice versa. The arrows do not repaint since the indicator only uses confirmed values and waits for the candle to close before painting an arrow. The indicator is also able to alert when arrows appear. There are 3 types of alerts - Popup, Email and Mobile Push Notifications.
Inputs Al
FREE
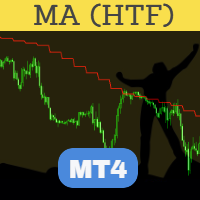
Perfected MA (Moving Average) HTF (Higher Time Frame) is perhaps the most advanced and reliable HTF indicator. Highly optimized in terms of execution, the indicator comes with standard settings of the MA indicator which is supplied with the MT4 platform. Place the indicator on the chart, any timeframe. You may select a higher time frame in indicator inputs. The same indicator can be used on a chart multiple times to draw MA from multiple timeframes or for different MA values. A must-have tool t
FREE

Prop Trader's Guardian: The Ultimate Risk Manager
(Product for MetaTrader 4)
Protect your capital and secure your funded account with the Prop Trader's Guardian. This is not just another drawdown checker; it's an account-level circuit breaker designed specifically for the strict rules of proprietary trading firms. When your daily limit is hit, it doesn't just close trades—it locks down your entire terminal to prevent any further activity until the next trading day.
The Prop Firm Trader's Dil

SimpleCandleTrader MT4 EA SimpleCandleTrader MT4 EA is an Expert Advisor for the MetaTrader 4 platform that opens trades on each new candle based on the direction of the previous one. Trading logic: If the previous candle was bullish (close > open), the EA opens a Buy order. If the previous candle was bearish (close < open), it opens a Sell order. Each new position automatically closes the previous one, ensuring that only one trade is active at any time. ️ Input Parameters: LotSize — fixed l
FREE
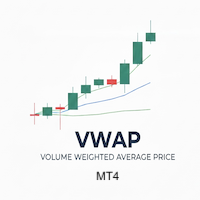
Buy 1 Get 1 Free Key Features and Advantages of VWAP 1. It Shows the "True Price" or "Consensus Price" This is its most important feature. While a Simple Moving Average (MA) gives equal weight to every price, VWAP tells us what the average price really is, based on where the majority of money (volume) agreed to trade. Example: If the price of 100 had 1,000,000 shares traded, but the price of 101 only had 100 shares traded... VWAP will give significantly more weight to the 100 price. 2. It

This trend scanner indicator is using two main indicators to identify trends. Frist the EMAs to provide a view on Bullish / Bearish momentum. When the shorter EMA (calculated off more recent price action) crosses, or is above, the slower moving EMA (calculated off a longer period of price action), it suggests that the market is in an uptrend. Second the Stochastic RSI, When RSI is < 20 it is considered oversold, and when > 80 it is overbought. These conditions suggests that momentum is very str
FREE

After purchasing Dash Supply Demand, download "Connect Supply Demand" for free, which will be the information link that will fuel your Dash. "Connect Supply Demand" will be the information fuel that will carry data to your Dash. Don't forget that it must be in the same folder as your Dash! You can confirm the path to it through the indicator window! If you have any questions, we'll be happy to assist you!
FREE

The indicator is specially designed for the trading utility Trade Shell (included Trade Shell SMC ) to get it working on visual strategy tester.
Backtest your trading ideas and indicators. Run Trade Shell on visual tester and then put this indicator on the chart. After that you will be able to control all functions of the Trade Shell as well as with live using! It does not work live! Use it with visual tester only. It does not require to set any setting on input parameters.
Have a good luck
FREE

I present an effective tool for determining the reversal on the H4 timeframe. The indicator is installed on the M30 chart. All parameters are already set. Proper use of the indicator: Unfortunately, the test in the tester will not give a correct idea about the indicator, so the rent for one month is as affordable as possible. You do not need to install the file on a remote server. Install it
FREE
FastTMALine_mth_PRT is non-redrawn channel indicator and can be used to identify trend and support and resistance levels.
Indicator settings allow you to assign a specific coefficient to each price channel, which makes it possible to narrow or expand each channel separately. The FastTMALine_mth_PRT indicator is a multicurrency instrument, so the choice of a timeframe depends solely on the trader’s preference. FastTMALine_mth_PRT indicator can be used on any time frame, so you can eas
FREE

Certainly! A candlestick pattern EA is an Expert Advisor that automates the process of identifying specific candlestick patterns on a price chart and making trading decisions based on those patterns. Candlestick patterns are formed by one or more candles on a chart and are used by traders to analyze price movements and make trading decisions. EA likely scans the price chart for predefined candlestick patterns such as the Hammer, Inverted Hammer, Three White Soldiers, and Evening Star. When it
FREE

Quante volte ti è capitato di aver bisogno di avere a grafico i livelli chiave di una candela chiusa del time frame precedente? Con PastProjection potrai far disegnare i livelli di Apertura, Chiusura, Massimo e Minimo della candela chiusa al time frame superiore scelto. I livelli sono spesso importanti e diventano supporti o resistenze, o entrambi. La prima volta che vengono raggiunti spesso fanno reagire la quotazione. I pattern su questi livelli sono spesso più efficaci. Tali livelli sono sign
FREE
TriadStrategiesFx-полностью автоматический эксперт с тремя стратегиями. Каждая стратегия работает отдельно.Для переключения стратегий необходимо изменить параметры советника в окне настроек. По умолчанию TriadStrategiesFx работает по классическому мартингейлу, локированием убыточного ордера.Как правило, закрытие всех ордеров происходит по совокупной прибыли после выхода из флетового коридора, после чего начинается новый цикл.
Вторая стратегия, предусмотренная в эксперте, также является кла
FREE

Uses of EA - Trailingstop: Move stoploss continuously. - Breakeven: Move the stoploss once. Custom parameters: All OrderOpenTime: + true: acts on all order + false: only affect the order opened since EA run All OrderType: + true: acts on all order. + false: only the order is running (Buy, Sell) TraillingStop: true (Use), false (do not use) TrailingStop Save (Point) TraililngStop Distance (Point) BreakEven: true (Use), false (do not use) BreakEven Save (Point) Brea
FREE
This tool will allow you to export candles data (Open, High, Low, Close, Volume) for any financial instrument present in your MetaTrader 4. You can download the data of multiple Symbols and TimeFrames in the same csv file at once. You can schedule the frequency, simply choose the refresh interval (1 minute minimum, if 0 then the extraction will be done once) and the tool will do the work. No need to open a lot of charts in order to get the last sync, the tool will download the data directly. The
FREE

The indicator calculates the average price velocity over the specified time period. It is known that the trading time flows unevenly, in bursts. It either goes faster, or slows down. This indicator will tell if the trading time has accelerated and it is necessary to go to the smaller timeframes to search for trade signals.
Usage Alert is generated when the price velocity exceeds the specified threshold. The threshold value can be modified using the buttons on the information panel. A .wav file
FREE

TimeBar TimeBar is a simple information indicator that shows the remaining time until the bar closes, as well as the time elapsed since the bar opened and the current time. For ease of perception, two types of display modes have been added: in the form of a comment in the upper left corner of the graph, or in the form of a graphic object.
Advantages Font selection Font size. You can set any one. When commenting it is too small You can move objects. Any time can be selected by double clicking t
FREE
Dominate the Market with the Laguerre Edge Signal Indicator! Stop guessing and start trading with confidence! Our Laguerre Edge Indicator is your ultimate tool for spotting high-probability entry points. This indicator combines the power of two classic analysis methods— moving averages for trend direction and the Laguerre RSI for pinpointing reversals —all filtered by the solid EMA 200 trend line . It's designed to give you clear, objective signals directly on your chart. Key Features and Adva
FREE
Do not use Windows 7 with this EA MT4toTLGRM EA only sends text messages from Metatrader4 to a Telegram group or channel of your choice. From version 4.23 it sends messages to Discord, Twitter and Facebook. The messages are customizable to show information about any trading activity in the account. Also it shows a daily PnL report. Several instances of this EA can be used simultaneously in the same MT4 terminal for sending messages to different Telegram group/channel but ensure that each one ha
FREE

This versions is free because a dangerous strategy is used.
If you want to see my full and best product (not dangerous), check it out : https://www.mql5.com/en/market/product/82662
I'm sharing with you a scalping strategy who is designed especially on GBPNZD timeframe M5 . Scalping GBPNZD is a scalper who is not spread sensitive. Scalping GBPNZD 's backtest is around 70% of winrate. Scalping GBPNZD is very easy to use. Scalping GBPNZD is using a dangerous strategy. Scalping GBPNZD is a
FREE
Introducing IT Divergence EA, your ultimate ally in maximizing profits across financial markets. Our Expert Advisor (EA) leverages the potent MACD and RSI indicators to automate trading with unparalleled accuracy.
Key Features :
Divergence Detection Strategy : IT Divergence EA is built on a robust strategy that harnesses the power of MACD and RSI indicators to spot divergences in the markets. Divergences serve as powerful signals for identifying potential buy or sell opportunities. Intellig
FREE

Panda Oscillator is a new author's indicator designed for scalping.
An indicator that gives signals based on the readings of a whole range of standard and proprietary tools.
Main Features of Panda Oscillator: Analytical functions It can be used on any currency pairs and time frames; The indicator does not redraw; It is a great addition to other indicators; Graphical capabilities Occupies the minimum number of places on the chart; Flexible tinctures; Easy to learn; Panda Oscillator consists
FREE

It is the main indicator of Turtle Trading Strategy. It provides an excellent advantage for following the trend. It gives a signal to enter the transaction in channel breaks. A sell position is opened when the 20-period lower channel breaks, and a buy position is opened when the upper channel breaks. 2 ATR should be used as the stoploss level. The R-R ratio should be at least 1/2. You can reach the maximum profit opportunity by following the 10-period middle level. Recommended INPUT: 20 Period
FREE

Rua TrailingStop BreakEven Little
The EA not for Real Account. You can EA for Real Account with link: https://www.mql5.com/en/market/product/47635 Uses of EA - Trailingstop: Move stoploss continuously. - Breakeven: Move the stoploss once. Custom parameters: All OrderOpenTime: + true: acts on all order + false: only affect the order opened since EA run All OrderType: + true: acts on all order. + false: only the order is running (Buy, Sell) TraillingStop: true (Use), false (do n
FREE

Developed by Etienne Botes and Douglas Siepman, the Vortex Indicator consists of two oscillators that capture positive and negative trend movement. In creating this indicator, Botes and Seipman drew on the work of Welles Wilder and Viktor Schauberger, who is considered the father of implosion technology. Despite a rather involved formula, the indicator is quite straightforward to understand and easy to interpret. A bullish signal triggers when the positive trend indicator (VI+ green line) crosse
FREE

This semaphore indicator is based in the standard RSI, which is applied over the Envelopes indicator that shows an envelope or envelope fluctuation borders. This is a version of RSI vs Envelopes drawn in the symbol window . A sell signal emerges when the upper envelope/border is broken by the RSI indicator from top to bottom. A buy signal emerges when the lower envelope/border is broken by the RSI indicator from bottom upwards. The indicator can draw arrows on the indicator, draw vertical lines
FREE

The TMA Centered Bands indicator for MT4 draws bands on the chart and reports the overall price trend, as well as gives arrows signals to buy and sell when the bar closes outside the channel.
Unlike many TMAs, our version uses the calculation part of the algorithm without redrawing, and also adds the ability to select a symbol. The bands are made up of moving averages, and each of them has an MA period. The name TMA comes from triangular moving averages, as the indicator draws triangular bands
FREE

QuantumAlert RSI Navigator is a free indicator available for MT4/MT5 platforms, its work is to provide "alerts" when the market is inside "overbought and oversold" regions in the form of "buy or sell" signals. This indicator comes with many customization options mentioned in the parameter section below, user can customise these parameters as needful. Join our MQL5 group , where we share important news and updates. You are also welcome to join our private channel as well, contact me for the pri
FREE

TrendExpert Indicator Overview
The TrendExpert indicator is designed to identify and visualize trend zones in financial markets. It utilizes zigzag high and low points to determine support and resistance levels, providing insights into potential market reversals and continuation patterns.
Features - Detection of support and resistance zones based on price action. - Strength categorization (Proven, Verified, Untested, Turncoat, Weak) based on historical testing. - Adjustable parameters for z
FREE

HM (Horizontal Markup) is designed for manual marking of horizontal levels. The markup contains the level and its price value. The thickness and color of the line and the price value are set in the settings. Levels can be placed locally on timeframes, or set publicly for all timeframes.
His job is very simple:
1) – press the key that you set in the settings to mark up the level;
2) – we bring the line to the desired location;
3) – click the right mouse button and the level is linked.
In t
FREE

这是一个交易辅助工具箱,并不是全自动交易的机器人 W10 系统请保持 100%的缩放比,如果超过这个值。按钮内的字体将超出按钮边框 常规: 一键下单、一键挂单、一键反手,自动设置止盈止损。 一键平仓、一键平多单(空单)、一键删除挂单。 一键反手、一键锁单、设置自动追踪止损。 根据画线追踪止损 非农: 消息突破单,可在非农或者其他重大消息时使用,在消息行情爆发前在当前价格上方 挂BUYSTOP,下方挂SELLSTOP。订单自动设置止盈止损。 划线下单: 支持最多四根做多趋势线或者做空趋势线并存。价格到达趋势线自动开单。 支持每根下单趋势线设置不同的仓位。 每根下单趋势线可以设置不同的止损趋势线、止盈趋势线。 支持止损止盈趋势线进行止损止盈追踪移动。 支持趋势线的“时效性”,如果价格运行到开单(止损、止盈)趋势线的右方仍未订单成交,则价格将永远不会接触到趋势线,策略失效。如需要请延长趋势线 杂项: 支持历史订单轨迹显示,可在图表显示历史记录中所有订单的下单轨迹,显示开仓价、平仓价、单量。 支持实时点差显示 支持平台信息显示,杠杆,一个点的价值,一手保证金,仓息,是否支持EA等等
FREE

It's a multi-currency grid and martingale system that can trade all input pairs from one chart. The expert will close all orders for each pair using a profit level. The expert has the possibility to trade up to 100 pairs.
Information
Chose a broker with fast execution and low spreads for effective results. Please make some tests on a demo account to see how the expert works before using it on a real account. For 0.01 lot size and leverage 1:500, you need an initial balance of at least 10,000 f
FREE

Sweeper PRO – Advanced Candle Sweep Detector (3-in-1) For any questions, technical issues, or support requests, feel free to contact us through any of the following channels: WhatsApp Support: Contact1 Contact2 Email:
Money.transporter@gmail.com Overview Sweeper PRO is a powerful and fully customizable indicator designed to detect three unique types of candle sweeps — smart entry and reversal patterns commonly used by professional price action traders.
It automatically identifies po

!!!The free version works only on "EURUSD"!!! WaPreviousCandleLevels MT4 shows the previous candle levels, it shows the previous candle Open High Low Close levels (OHLC Levels) in different time frame. It's designed to help the trader to analyse the market and pay attention to the previous candle levels in different time frame. We all know that the OHLC Levels in Monthly, Weekly and Daily are really strong and must of the time, the price strongly reacts at those levels. In the technical analys
FREE
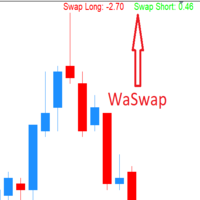
WaSwap MT4 Indicator shows the current Swap Long and current Swap Short with color.
* Set the Swap Threshold and the color to identify when the current swap is below or above the Spread Threshold.
* Set X axis and Y axis and chose the Corner and the Anchor to position the Swap Label on the chart.
* Write the font and the font size for more confort.
* Activate alert if the current Swap Long or the current Swap Short is below the swap threshold.
* The user will never swing with a negative sw
FREE

this indicator Construction on Gann angles and it,s very effective .you can use it as (Support and resistance)
it,s very successful and easy to use.if candle Cross through level thats mean price is going ti next level
but with on condition. The price cames from a previous level
There is a variable of angles for frames the best is 1h frame and stander variable.........
FREE
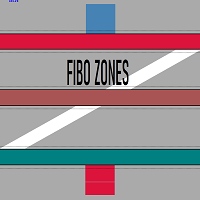
Индикатор предназначен для разметки ,фибо уровней и фибо зон.Также есть возможность удаления и редактирования уровней на текущем графике. При установке нескольких индикаторов (FIBO-ZONES)на график,не забывайте менять имя в поле (NAME).В утилите также есть возможность менять цвет зон, толщину линий и стиль линий уровней фибо. При установке индикатора ,зоны выстраиваются автоматически.
FREE

Purpose: The function of this indicator is to draw 3 moving averages (MA's) lines on the main MT4 price chart. The MA's are from 3 different timeframes specified by the user independent of the chart that is currently displayed. When you toggle your chart view through different time frames, the 3 MA's will continue to display the MA lines for the time frames specified in the properties. Example: The default settings map out three 50 bars MA's for H4, D1 and W1 time frames. During intraday tradi
FREE

AR Canada Standard is a fully automated Expert Advisor optimized for trading USDCAD H1. The Expert Advisor DOES NOT use hedging, martingale, grid strategies, arbitrage, etc. It uses a trading algorithm based on the intersection of two moving averages for analyzing the market conditions. The Take Profit and Stop Loss values are fixed and have a ratio of 1 to 3,6. The EA closes positions when Take Profit or Stop Loss are reached. Risk management is a key concept in Forex trading. This EA allows se
FREE

This indicator determines minimum volumes needed during a candle formed so that it would be higher than current volume's average. Although you can place MAs on your volume indicator, this indicator has non-repaint characteristic so you may not to worry about sudden volume increase. This indiator also draw volume indicator for its own. Input Description: period: Period used for indicator. Must be higher than 1. Output Description: VolumeXover: This indicator's main feature. During the time the vo
FREE

<EA main logic>
1. EA reads candle pattern for most profitable of BUY & SELL.
2. If these pattern matches , then EA places the order.
3. If the order was closed with stoploss, then EA should stop trade on that day.
4. Next day EA will re-start again with increasing lot size to recover the loss.
<INPUT parameters> Slippage 3 pips MaxPosition 1 BaseLots 0,01 takeprofit 10pips stoploss 20pips Martingale True/False Max martingale 2 (times) Multiplier (lot size) 2,5
<Best pair & time frame>
FREE

Network EURUSD - сеточный советник, настроенный для торговли валютной парой EURUSD. Для определения моментов для открытия сделок советник использует несколько индикаторов. Рекомендуемый период графика для торговли с настройками по-умолчанию - M15.
Настройки: Take profit
Размер тейк профита
Volume
Размер лота
Balance
Баланс для расчёта лота. Если ноль, то лот будет фиксированным
Period for indicators Период для индикаторов.
FREE

This indicator is designed for binary options. Based on proprietary divergence of the CCI indicator. A sell signal: A down arrow appears on the chart. A buy signal: An up arrow appears on the chart.
Input parameters History - the number of bars in history for calculation Period CCI - period of the CCI technical indicator Up border - overbought limit for calculation of the divergence Down border - oversold limit for calculation of the divergence Price - price for the indicator calculation Alerts
FREE

The VR Object Delete All script solves the problem of garbage on the chart. it is often necessary to completely clear the chart of everything that is put on it, comments, lines, objects. The script completely deletes everything, even those objects that are not visible. When working, VR Object Delete All writes everything it does in the terminal log, as well as the names of objects to delete. Displays the number of deleted objects as a separate line. in case of any errors, it will display an erro
FREE

The LexusBO indicator is recommended for trading binary options . Signals are generated when the RSI, ADX, CCI indicators cross the customizable levels. The indicator displays signals using "up/down" arrows on the chart. Their values are available in the buffer arrays (buffer with index 0 - "up" arrow, with index 1 - "down" arrow). This makes the indicator easy to use for automated trading through specialized Expert Advisors. The recommended timeframe is M5. The indicator has a built-in counter
FREE
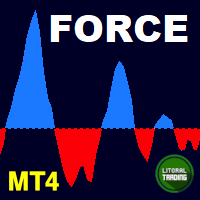
For those who like trend the Force will be a very useful indicator. This is because it is based on the famouse ADX, which measure the strenght of a trend, but without its 3 confusing lines. Force has its very simple interpretation: if the histogram is above zero level the trend is up, otherwise it is down. You can use it to find divergences too, which is very profitable. If you have any doubt or suggestion, please, contact me. Enjoy!
MT5 version: https://www.mql5.com/en/market/product/41928
T
FREE

Profit30 Lite Free
The Profit30 Lite Free Expert Adviser, uses 7 different 'price action style' system on the EURUSD pair, on the M5, M15, M30, H1 timeframes.Best optimized perform in H1 chart
The EURUSD pair offers in general the best performance in the major part of the Profit30 EAs. In this EA, a selection of Profit30 systems has been rewritten and configured explicitly for get the best performance in the EURUSD pair. The EURUSD pair offers in general the best broker execution conditions, wi
FREE

This is a very simple script that will show you the following info about any symbol in your chart: Point, digits, spread, stop level, lot size, tick value, tick size, swap long, swap short, starting date (if future contract), expiration date (if future contract), trade allowed, minimum lot size, lot step, maximum lot size, swap type, profit calculation mode, margin calculation mode, initial margin, margin maintenance, margin when hedged, margin required, freeze level. All this info is extracted
FREE

ATR on Prices is simply an ATR indicator that plot a line for Resistance and Support using the Average True Range calculation. You can set the ATR daily periods, to be calculated. As well you can set the reference price to add and subtract the ATR measure to obtain the ATR Top and ATR Bottom lines, using the Open Price (that is fixed) or the Middle (HL/2) price (that will vary on the day) Or adding the ATR to the daily low and subtracting it from the daily high . You can use full ATR measure or
FREE

Based on my original trading strategy, it appears that this EA is programmed to use technical analysis to identify an inside candle pattern in the current candle and wait for a breakout in either direction. If the price breaks out higher, the EA will place a buy order, and if it breaks out lower, the EA will place a sell order. The take profit and stop loss levels are set at 50 pips each.
Additionally, using a martingale strategy, which involves increasing the lot size after a losing trade, ca
FREE

SPREADEX e' un indicatore per MT4 e MT5 che indica la distanza dell'ASSET dal GP. il GP e' il prezzo del vero valore dell'ASSET sottostante ottenuto per stima. Il GP e' come una calamita, attira il prezzo dell'ASSET con alta probabilita' ed all'interno della stessa giornata di trading. Quindi SPREADEX indica quali sono gli asset piu distanti dal GP al momento in tempo reale. Fornendo un punto di vista al TRADER su quali asset concentrarsi e cercare eventuali segnali di inversione dei prezzi per
FREE
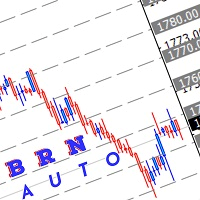
Use this indicator to draw multiple horizontal line to nearest round number Range for round number can be adjust manually depend how user want to use it Selection of colour also can be adjust manually Hope this indicator can help somebody in their trading.
How to use this: Mostly I use this indicator for break, retest and entry. example:- current price XAUUSD :1740.00 which mean the closest level are 1750.00 and 1730.00 Wait for price to break this level. then wait for retracement if price maki
FREE

As the title says, this is an indicator that shows the current open market (session). It has 4 sessions with customizable schedule : 1. London session, 2. New York session, 3. Sydney session, 4. Tokyo session.
Indicator inputs: - The color of each session. - The open time and close time of the sessions. - The line width.
The objective of the indicator, is to follow each sessions, observe at what times are multiple sessions open, and thus take the chance of the high market movements.
FREE

The indicator looks for market Highs and Lows. They are defined by fractals, i.e. the market creates the indicator algorithm and structure, unlike ZigZag having a rigid algorithm that affects the final result. This indicator provides a different view of the price series and detects patterns that are difficult to find on standard charts and timeframes. The indicator does not repaint but works with a small delay. The first fractal level is based on the price, the second fractal level is based on t
FREE

Now there is no need to check volatility on third-party websites in order to determine the average movement rage of a certain currency pair. The Truly Volatility indicator is designed for determining volatility for the specified period and is displayed in a separate window as a histogram and line. If attached to a chart with the Н1 timeframe, the indicator displays the average price movement for each hour (from 0 to 23) based on the history data. On the D1 timeframe it displays the average movem
FREE
The MetaTrader Market is a unique store of trading robots and technical indicators.
Read the MQL5.community User Memo to learn more about the unique services that we offer to traders: copying trading signals, custom applications developed by freelancers, automatic payments via the Payment System and the MQL5 Cloud Network.
You are missing trading opportunities:
- Free trading apps
- Over 8,000 signals for copying
- Economic news for exploring financial markets
Registration
Log in
If you do not have an account, please register
Allow the use of cookies to log in to the MQL5.com website.
Please enable the necessary setting in your browser, otherwise you will not be able to log in.