MTF Non Repaint Arrow Five RSI RTD
- Indikatoren
-
Anon Candra N
 I am a professional trader who has been in the stock market for several years. After making in-depth observations of the stock market, I developed the trading tools that have helped my trading career so far. The good news is, you can have these trading tools on this website.
 - Version: 2.10
- Aktualisiert: 9 Juli 2026
- Aktivierungen: 20
[V 1.00] MTF NRPA 5 RSI RTD wurde veröffentlicht!
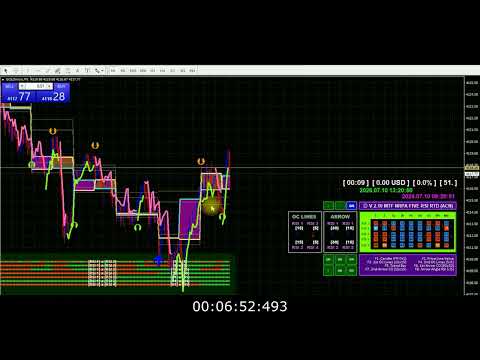
Pfeil-Echtzeit-Dashboard ohne Neulackierung.
Wenn Sie es satt haben, verschiedene RSI-Indikatoren zu verwenden, aber feststellen, dass diese ungenau sind, dann probieren Sie dieses eine Tool aus. Normalerweise installieren Leute nur 1 RSI, um den OBOS-Level in einem bestimmten Zeitraum zu bestimmen. Die schlechte Nachricht ist, dass Sie die OBOS-Werte und -Trends nicht in verschiedenen Zeiträumen gleichzeitig sehen können. Deshalb habe ich dieses Handelstool entwickelt.
So wird es erklärt:
Bei diesem Handelstool verwende ich fünf RSI. Ja, fünf! Standardmäßig stelle ich RSI 1 und RSI 2 auf einen großen Zeitrahmen ein, nämlich M30. Der Schnittpunkt von RSI 1 und RSI 2 bedeutet, dass es eine Trendänderung im M30-Zeitrahmen gibt. Dann stelle ich RSI 3 und RSI 4 auf den aktuellen (kleinen) Zeitrahmen ein, zum Beispiel öffnen Sie einen Chart auf M5. Der Schnittpunkt von RSI 3 und RSI 4 bedeutet, dass im aktuellen Zeitrahmen (M5) eine Trendänderung vorliegt. Um eine Trendbewegung sicherzustellen, habe ich dann RSI 5 auf dem höheren Zeitrahmen (H1) installiert. Wenn RSI 5 das Niveau von 50 überschreitet (Sie können den Zeitrahmen und das OBOS-Niveau festlegen), erscheint ein Pfeil.
Es gibt viele erstaunliche Dinge in diesem Handelstool:
Sie können die fünf RSI-Zeitrahmen nach Ihren Wünschen ändern. Sie können den Linienstil ändern, Sie können den Farbstil ändern, Sie können den Typ des RSI-Schnittpfeils ändern und Sie können die RSI-Parameter nach Ihren Wünschen ändern. Noch besser ist der Echtzeit-9TF-Dashboard-Monitor der fünf RSIs. Es stehen 10 Dashboard-Farbschemata zur Anwendung. Ok, jetzt erkläre ich das Symbol im Dashboard. Es gibt zwei Arten von Symbolen. Rechtecksymbol und Pfeilsymbol (oben und unten). Das grüne Rechtecksymbol zeigt an, dass der RSI-Winkel positiv ist, was bedeutet, dass der Trend nach oben zeigt. Während das rote Rechtecksymbol anzeigt, dass der RSI-Winkel negativ ist, was einen Abwärtstrend bedeutet. Außerdem können Sie beobachten, ob RSI 1 über oder unter RSI 2 liegt und ob RSI 3 über oder unter RSI 4 liegt. Dies ist an dem nach oben bzw. unten zeigenden Pfeilsymbol zu erkennen. Außerdem können Sie den RSI-Wert aller 9TF überwachen. Erstaunlich, nicht wahr? Und es gibt noch mehr. Die Tastenfunktion. Durch Klicken auf die Schaltfläche können Sie diesen Indikator mit nur einem Klick ein- oder ausblenden!
Dies ist wirklich ein Handelstool, das Sie haben müssen.
Beeilen Sie sich und kaufen Sie dieses Handelstool, bevor der Preis steigt!
Machen Sie sichere Eingaben und handeln Sie wie ein Profi.
Danke schön.
#rsiindicator #rsitradingstrategy #tradingindicators #tradingforex #tradingtips #bestindicator #doublersi
It DOES repaint, very disappointed.
I did purchase this because you clearly state on your title and description that your thing does NOT repaint, now you say that it DOES repaint and that it's normal. I call this a scam. By the way, keep your "keep learning" for you, you don't know who i am and if am or not an experienced trader. You refund me please as your claim "non repaint arrow" is wrong, thanks.
Why? Because they set the risk reward ratio inside the algorithm. They can't control what is going on inside the brain of millions of traders. They can't tell you precisely when to buy and when to sell. What I can do as a developer (and also trader) is anticipate whether there's crossover lines or not. This trading indicator is based on technical analysis, i.e crossover of two lines and angle of line. If there is crossover between two lines then the arrows appear and NON REPAINT. But because of price action (market volatility), after several seconds or minutes, if the two lines failed to cross (it's just a test and won't last long) then the arrows disappear. And it must be disappear. Otherwise, the algorithm is wrong. Same logic applied to angle of line. If the angle of line is positive then up arrow appear. Likewise, if the angle of line is negative then down arrow appear. So if you see why arrow M1 repaint? Because of price action (I can't control people mind).
Why arrow M5 repaint? Because of price action. Why arrow M15 repaint? Because of price action. Why arrow M30 repaint? Because of price action. etc. To help you make better decision, this indicator is also equipped with REAL TIME 9TF dashboard monitor. Please monitor patiently such as buy when RSI from M1 to H4 all UP.
And sell when RSI from M1 to H4 all Down. Thank you for your purchase. And keep learning.