MTF Non Repaint Arrow Five RSI RTD
- Indicatori
-
Anon Candra N
 I am a professional trader who has been in the stock market for several years. After making in-depth observations of the stock market, I developed the trading tools that have helped my trading career so far. The good news is, you can have these trading tools on this website.
 - Versione: 2.10
- Aggiornato: 9 luglio 2026
- Attivazioni: 20
[V 1.00] MTF NRPA 5 RSI RTD è stato rilasciato!
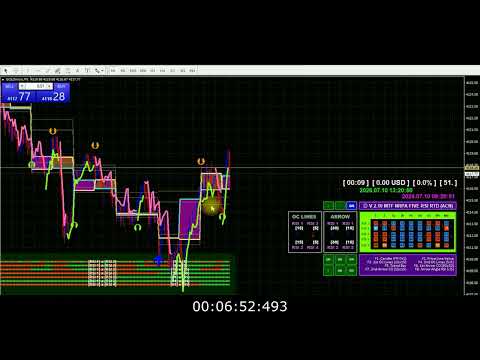
Dashboard in tempo reale con freccia non riverniciata.
Se sei stanco di utilizzare vari indicatori RSI ma scopri che sono imprecisi, prova questo strumento. Di solito le persone installano solo 1 RSI per determinare il livello OBOS in un lasso di tempo. La cattiva notizia è che non puoi vedere i livelli e le tendenze OBOS in vari intervalli di tempo contemporaneamente. Ecco perché ho sviluppato questo strumento di trading.
Ecco come viene spiegato:
Su questo strumento di trading, utilizzo cinque RSI. Sì, cinque! Per impostazione predefinita, ho impostato RSI 1 e RSI 2 su un intervallo di tempo ampio, vale a dire M30. L'intersezione di RSI 1 e RSI 2 significa che c'è un cambio di tendenza sul timeframe M30. Quindi imposto RSI 3 e RSI 4 sull'intervallo di tempo corrente (piccolo), ad esempio apri un grafico su M5. L'intersezione di RSI 3 e RSI 4 significa che c'è un cambio di tendenza sul timeframe corrente (M5). Quindi, per garantire il movimento del trend, ho installato RSI 5 sul timeframe più alto (H1). Quando RSI 5 supera il livello di 50 (è possibile impostare l'intervallo di tempo e il livello OBOS), verrà visualizzata la freccia.
Ci sono molte cose sorprendenti in questo strumento di trading:
Puoi modificare i cinque intervalli di tempo RSI secondo i tuoi desideri. Puoi cambiare lo stile della linea, puoi cambiare lo stile del colore, puoi cambiare il tipo di freccia di intersezione RSI e puoi cambiare i parametri RSI come preferisci. Ancora meglio è il monitor del cruscotto 9TF in tempo reale dei cinque RSI. Ci sono 10 combinazioni di colori del cruscotto da applicare. Ok, ora lascia che ti spieghi il simbolo all'interno del cruscotto. Ci sono due tipi di simbolo. Simbolo del rettangolo e simbolo della freccia (su e giù). Il simbolo del rettangolo di colore verde indica che l'angolo RSI è positivo, il che significa che la tendenza è al rialzo. Mentre il simbolo del rettangolo di colore rosso indica che l'angolo RSI è negativo, il che significa una tendenza al ribasso. Inoltre, puoi osservare se RSI 1 è sopra o sotto RSI 2 e se RSI 3 è sopra o sotto RSI 4. Questo può essere visto dal simbolo della freccia che punta verso l'alto o verso il basso. Inoltre, puoi monitorare il valore RSI di tutti i 9TF. Incredibile non è vero? E c'è di più. La caratteristica del pulsante. Facendo clic sul pulsante, puoi nascondere o mostrare questo indicatore con un solo clic!
Questo è davvero uno strumento di trading che devi avere.
Sbrigati ad acquistare questo strumento di trading prima che il prezzo salga!
Effettua entrate sicure e fai trading come un professionista.
Grazie.
#rsiindicator #rsitradingstrategy #tradingindicators #tradingforex #tradingtips #bestindicator #doublersi
It DOES repaint, very disappointed.
I did purchase this because you clearly state on your title and description that your thing does NOT repaint, now you say that it DOES repaint and that it's normal. I call this a scam. By the way, keep your "keep learning" for you, you don't know who i am and if am or not an experienced trader. You refund me please as your claim "non repaint arrow" is wrong, thanks.
Why? Because they set the risk reward ratio inside the algorithm. They can't control what is going on inside the brain of millions of traders. They can't tell you precisely when to buy and when to sell. What I can do as a developer (and also trader) is anticipate whether there's crossover lines or not. This trading indicator is based on technical analysis, i.e crossover of two lines and angle of line. If there is crossover between two lines then the arrows appear and NON REPAINT. But because of price action (market volatility), after several seconds or minutes, if the two lines failed to cross (it's just a test and won't last long) then the arrows disappear. And it must be disappear. Otherwise, the algorithm is wrong. Same logic applied to angle of line. If the angle of line is positive then up arrow appear. Likewise, if the angle of line is negative then down arrow appear. So if you see why arrow M1 repaint? Because of price action (I can't control people mind).
Why arrow M5 repaint? Because of price action. Why arrow M15 repaint? Because of price action. Why arrow M30 repaint? Because of price action. etc. To help you make better decision, this indicator is also equipped with REAL TIME 9TF dashboard monitor. Please monitor patiently such as buy when RSI from M1 to H4 all UP.
And sell when RSI from M1 to H4 all Down. Thank you for your purchase. And keep learning.