MTF Non Repaint Arrow Five RSI RTD
- Indicadores
-
Anon Candra N
 I am a professional trader who has been in the stock market for several years. After making in-depth observations of the stock market, I developed the trading tools that have helped my trading career so far. The good news is, you can have these trading tools on this website.
 - Versão: 2.10
- Atualizado: 9 julho 2026
- Ativações: 20
[V 1.00] MTF NRPA 5 RSI RTD foi lançado!
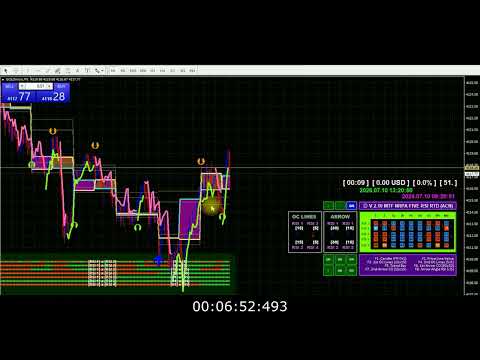
Painel em tempo real de seta sem repintura.
Se você está cansado de usar vários indicadores RSI, mas acha que eles são imprecisos, tente esta ferramenta. Normalmente, as pessoas instalam apenas 1 RSI para determinar o nível de OBOS em um período de tempo. A má notícia é que você não pode ver os níveis e tendências do OBOS em vários períodos de tempo ao mesmo tempo. É por isso que desenvolvi esta ferramenta de negociação.
Veja como é explicado:
Nesta ferramenta de negociação, eu uso cinco RSI. Sim, cinco! Por padrão, defino RSI 1 e RSI 2 em um período de tempo grande, ou seja, M30. A interseção do RSI 1 e do RSI 2 significa que há uma mudança de tendência no timeframe M30. Em seguida, defino RSI 3 e RSI 4 no timeframe atual (pequeno), por exemplo, você abre um gráfico em M5. A interseção do RSI 3 e do RSI 4 significa que há uma mudança de tendência no timeframe atual (M5). Então, para garantir o movimento da tendência, instalei o RSI 5 no período de tempo mais alto (H1). Quando o RSI 5 cruzar o nível de 50 (você pode definir o período de tempo e o nível OBOS), a seta aparecerá.
Há muitas coisas incríveis nesta ferramenta de negociação:
Você pode alterar os cinco prazos do RSI de acordo com seus desejos. Você pode alterar o estilo da linha, o estilo da cor, o tipo de seta de interseção do RSI e os parâmetros do RSI como desejar. Ainda melhor é o monitor de painel 9TF em tempo real dos cinco RSIs. Existem 10 esquemas de cores do painel a serem aplicados. Ok, agora deixe-me explicar o símbolo dentro do painel. Existem dois tipos de símbolo. Símbolo de retângulo e símbolo de seta (para cima e para baixo). O símbolo do retângulo de cor verde indica que o ângulo do RSI é positivo, o que significa que a tendência é de alta. Enquanto o símbolo do retângulo de cor vermelha indica que o ângulo do RSI é negativo, o que significa uma tendência de baixa. Além disso, você pode observar se o RSI 1 está acima ou abaixo do RSI 2 e se o RSI 3 está acima ou abaixo do RSI 4. Isso pode ser visto no símbolo da seta apontando para cima ou para baixo. Além disso, você pode monitorar o valor do RSI de todos os 9TF. Incrível não é? E há mais. O recurso de botão. Ao clicar no botão, você pode ocultar ou mostrar este indicador com apenas um clique!
Esta é realmente uma ferramenta de negociação que você deve ter.
Apresse-se para comprar esta ferramenta de negociação antes que o preço suba!
Faça entradas confiantes e negocie como um profissional.
Obrigado.
#rsiindicator #rsitradingstrategy #tradingindicators #tradingforex #tradingtips #bestindicator #doublersi
It DOES repaint, very disappointed.
I did purchase this because you clearly state on your title and description that your thing does NOT repaint, now you say that it DOES repaint and that it's normal. I call this a scam. By the way, keep your "keep learning" for you, you don't know who i am and if am or not an experienced trader. You refund me please as your claim "non repaint arrow" is wrong, thanks.
Why? Because they set the risk reward ratio inside the algorithm. They can't control what is going on inside the brain of millions of traders. They can't tell you precisely when to buy and when to sell. What I can do as a developer (and also trader) is anticipate whether there's crossover lines or not. This trading indicator is based on technical analysis, i.e crossover of two lines and angle of line. If there is crossover between two lines then the arrows appear and NON REPAINT. But because of price action (market volatility), after several seconds or minutes, if the two lines failed to cross (it's just a test and won't last long) then the arrows disappear. And it must be disappear. Otherwise, the algorithm is wrong. Same logic applied to angle of line. If the angle of line is positive then up arrow appear. Likewise, if the angle of line is negative then down arrow appear. So if you see why arrow M1 repaint? Because of price action (I can't control people mind).
Why arrow M5 repaint? Because of price action. Why arrow M15 repaint? Because of price action. Why arrow M30 repaint? Because of price action. etc. To help you make better decision, this indicator is also equipped with REAL TIME 9TF dashboard monitor. Please monitor patiently such as buy when RSI from M1 to H4 all UP.
And sell when RSI from M1 to H4 all Down. Thank you for your purchase. And keep learning.