MTF Non Repaint Arrow Five RSI RTD
- Indicadores
-
Anon Candra N
 I am a professional trader who has been in the stock market for several years. After making in-depth observations of the stock market, I developed the trading tools that have helped my trading career so far. The good news is, you can have these trading tools on this website.
 - Versión: 2.10
- Actualizado: 9 julio 2026
- Activaciones: 20
[V 1.00] ¡Se ha lanzado MTF NRPA 5 RSI RTD!
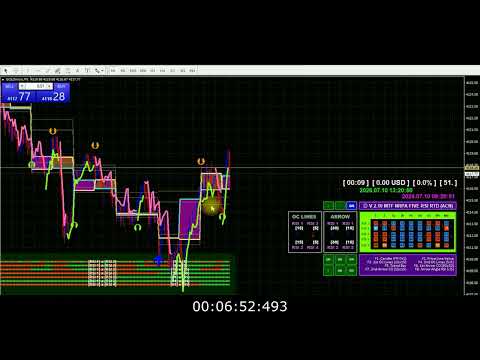
Panel de control en tiempo real de flecha sin repintar.
Si está cansado de usar varios indicadores RSI pero descubre que son inexactos, pruebe esta herramienta. Por lo general, las personas solo instalan 1 RSI para determinar el nivel de OBOS en un período de tiempo. La mala noticia es que no puede ver los niveles y las tendencias de OBOS en varios períodos de tiempo a la vez. Es por eso que desarrollé esta herramienta comercial.
Así es como se explica:
En esta herramienta comercial, uso cinco RSI. ¡Sí, cinco! De forma predeterminada, configuro RSI 1 y RSI 2 en un marco de tiempo amplio, a saber, M30. La intersección de RSI 1 y RSI 2 significa que hay un cambio de tendencia en el marco de tiempo M30. Luego configuro RSI 3 y RSI 4 en el marco de tiempo actual (pequeño), por ejemplo, abre un gráfico en M5. La intersección de RSI 3 y RSI 4 significa que hay un cambio de tendencia en el marco de tiempo actual (M5). Luego, para asegurar el movimiento de la tendencia, instalé RSI 5 en el marco de tiempo más alto (H1). Cuando RSI 5 cruce el nivel de 50 (puede establecer el marco de tiempo y el nivel de OBOS), aparecerá la flecha.
Hay muchas cosas sorprendentes en esta herramienta comercial:
Puede cambiar los cinco marcos de tiempo RSI según sus deseos. Puede cambiar el estilo de línea, puede cambiar el estilo de color, puede cambiar el tipo de flecha de intersección RSI y puede cambiar los parámetros RSI como desee. Aún mejor es el monitor de tablero 9TF en tiempo real de los cinco RSI. Hay 10 esquemas de color de tablero para aplicar. Ok, ahora déjame explicarte el símbolo dentro del tablero. Hay dos tipos de símbolo. Símbolo de rectángulo y símbolo de flecha (arriba y abajo). El símbolo del rectángulo de color verde indica que el ángulo RSI es positivo, lo que significa que la tendencia es alcista. Mientras que el símbolo del rectángulo de color rojo indica que el ángulo RSI es negativo, lo que significa una tendencia bajista. Además, puede observar si el RSI 1 está por encima o por debajo del RSI 2 y si el RSI 3 está por encima o por debajo del RSI 4. Esto se puede ver en el símbolo de flecha que apunta hacia arriba o hacia abajo. Además, puede monitorear el valor RSI de todos los 9TF. ¿No es increíble? Y hay más La característica del botón. ¡Al hacer clic en el botón, puede ocultar o mostrar este indicador con solo un clic!
Esta es realmente una herramienta comercial que debe tener.
¡Date prisa para comprar esta herramienta comercial antes de que suba el precio!
Haga entradas seguras y opere como un profesional.
Gracias.
#rsiindicator #rsitradingstrategy #tradingindicators #tradingforex #tradingtips #bestindicator #doublersi
It DOES repaint, very disappointed.
I did purchase this because you clearly state on your title and description that your thing does NOT repaint, now you say that it DOES repaint and that it's normal. I call this a scam. By the way, keep your "keep learning" for you, you don't know who i am and if am or not an experienced trader. You refund me please as your claim "non repaint arrow" is wrong, thanks.
Why? Because they set the risk reward ratio inside the algorithm. They can't control what is going on inside the brain of millions of traders. They can't tell you precisely when to buy and when to sell. What I can do as a developer (and also trader) is anticipate whether there's crossover lines or not. This trading indicator is based on technical analysis, i.e crossover of two lines and angle of line. If there is crossover between two lines then the arrows appear and NON REPAINT. But because of price action (market volatility), after several seconds or minutes, if the two lines failed to cross (it's just a test and won't last long) then the arrows disappear. And it must be disappear. Otherwise, the algorithm is wrong. Same logic applied to angle of line. If the angle of line is positive then up arrow appear. Likewise, if the angle of line is negative then down arrow appear. So if you see why arrow M1 repaint? Because of price action (I can't control people mind).
Why arrow M5 repaint? Because of price action. Why arrow M15 repaint? Because of price action. Why arrow M30 repaint? Because of price action. etc. To help you make better decision, this indicator is also equipped with REAL TIME 9TF dashboard monitor. Please monitor patiently such as buy when RSI from M1 to H4 all UP.
And sell when RSI from M1 to H4 all Down. Thank you for your purchase. And keep learning.