MTF Non Repaint Arrow Five RSI RTD

1
[V 1.00] MTF NRPA 5 RSI RTD yayınlandı!

Yeniden boyanmayan ok gerçek zamanlı pano.

Çeşitli RSI göstergelerini kullanmaktan sıkıldıysanız ancak bunların hatalı olduğunu düşünüyorsanız, bu aracı deneyin. Genellikle insanlar bir zaman diliminde OBOS seviyesini belirlemek için yalnızca 1 RSI kurarlar. Kötü haber şu ki, aynı anda çeşitli zaman dilimlerinde OBOS seviyelerini ve trendlerini göremiyorsunuz. Bu ticaret aracını bu yüzden geliştirdim.

İşte nasıl açıklandığı:

Bu ticaret aracında beş RSI kullanıyorum. Evet, beş! Varsayılan olarak, RSI 1 ve RSI 2'yi geniş bir zaman dilimine, yani M30'a ayarlıyorum. RSI 1 ve RSI 2'nin kesişmesi, M30 zaman diliminde bir trend değişikliği olduğu anlamına gelir. Sonra RSI 3 ve RSI 4'ü mevcut (küçük) zaman dilimine ayarlıyorum, örneğin M5'te bir grafik açıyorsunuz. RSI 3 ve RSI 4'ün kesişmesi, mevcut zaman diliminde (M5) bir trend değişikliği olduğu anlamına gelir. Ardından trend hareketini sağlamak için RSI 5'i daha yüksek zaman dilimine (H1) kurdum. RSI 5, 50 seviyesini geçtiğinde (zaman çerçevesini ve OBOS seviyesini ayarlayabilirsiniz), ardından ok görünecektir.

Bu ticaret aracında birçok harika şey var:

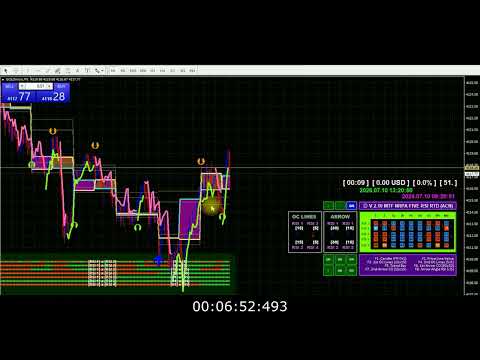
Beş RSI zaman çerçevesini isteklerinize göre değiştirebilirsiniz. Çizgi stilini değiştirebilir, renk stilini değiştirebilir, RSI kesişme okunun türünü değiştirebilir ve RSI parametrelerini istediğiniz gibi değiştirebilirsiniz. Daha da iyisi, beş RSI'nin gerçek zamanlı 9TF pano monitörüdür. Uygulanacak 10 pano renk şeması vardır. Tamam, şimdi kontrol panelinin içindeki sembolü açıklayayım. İki tür sembol vardır. Dikdörtgen sembolü ve ok sembolü (yukarı ve aşağı). Yeşil renkli dikdörtgen sembolü, RSI açısının pozitif olduğunu, yani trendin yukarı olduğunu gösterir. Kırmızı renkli dikdörtgen sembolü, RSI açısının negatif olduğunu ve bu da düşüş trendi anlamına geldiğini gösterir. Ayrıca RSI 1'in RSI 2'nin üstünde mi altında mı olduğunu ve RSI 3'ün RSI 4'ün üstünde mi altında mı olduğunu gözlemleyebilirsiniz. Bu, yukarıyı veya aşağıyı gösteren ok simgesinden görülebilir. Ayrıca, tüm 9TF'nin RSI değerini de izleyebilirsiniz. Harika değil mi? Ve dahası var. Düğme özelliği. Düğmeye tıklayarak, bu göstergeyi tek bir tıklama ile gizleyebilir veya gösterebilirsiniz!

Bu gerçekten sahip olmanız gereken bir ticaret aracıdır.

Fiyat yükselmeden önce bu ticaret aracını satın almak için acele edin!

Güvenli girişler yapın ve bir profesyonel gibi ticaret yapın.

Teşekkür ederim.

#rsiindicator #rsitradingstrategy #tradingindicators #tradingforex #tradingtips #bestindicator #doublersi
Önerilen ürünler
Blahtech Market Profile
Blahtech Limited
4.53 (15)
Was: $249  Now: $99   Market Profile defines a number of day types that can help the trader to determine market behaviour. A key feature is the Value Area, representing the range of price action where 70% of trading took place. Understanding the Value Area can give traders valuable insight into market direction and establish the higher odds trade. It is an excellent addition to any system you may be using. Blahtech Limited presents their Market Profile indicator for the MetaTrader community. Ins
The indicator allows you to trade binary options. The recommended time frame is М1 and the expiration time is 1,2,3 minutes. The indicator suitable for auto and manual trading. A possible signal is specified as a arrows above/under a candle. You should wait until the candle closes! Arrows are not re-painted Trade sessions: TOKYO section (Half-end) Currency pairs: USD/JPY Working time frame: M1 Expiration time: 1,2,3 minutes. The indicator also shows good results when using the martingale strateg
FREE
BoxChart MT4
Evgeny Shevtsov
4.4 (5)
The market is unfair if only because 10% of participants manage 90% of funds. An ordinary trader has slim changes to stand against these "vultures". This problem can be solved. You just need to be among these 10%, learn to predict their intentions and move with them. Volume is the only preemptive factor that faultlessly works on any timeframe and symbol. First, the volume appears and is accumulated, and only then the price moves. The price moves from one volume to another. Areas of volume accumu
Antabod Gamechanger
Rev Anthony Olusegun Aboderin
*Antabod GameChanger Indicator – Transform Your Trading!*   Are you tired of chasing trends too late or second-guessing your trades? The *Antabod GameChanger Indicator* is here to *revolutionize your trading strategy* and give you the edge you need in the markets!   Why Choose GameChanger? *Accurate Trend Detection* – GameChanger identifies trend reversals with *pinpoint accuracy*, ensuring you enter and exit trades at the optimal time.   *Clear Buy & Sell Signals* – No more guesswork! T
Gösterge, tarihsel olanlarla karşılaştırılabilecek güncel teklifler oluşturur ve bu temelde bir fiyat hareketi tahmini yapar. Gösterge, istenen tarihe hızlı navigasyon için bir metin alanına sahiptir. Seçenekler: Sembol - göstergenin göstereceği sembolün seçimi; SymbolPeriod - göstergenin veri alacağı dönemin seçimi; GöstergeRenk - gösterge rengi; Ters - doğru tırnakları tersine çevirir, yanlış - orijinal görünüm; Sonraki, tarihi girebileceğiniz ve 'enter' tuşuna basarak hemen atlayab
SMC Venom Model BPR göstergesi, Akıllı Para (SMC) konseptinde çalışan yatırımcılar için profesyonel bir araçtır. Fiyat grafiğinde iki temel modeli otomatik olarak belirler: FVG   (Adil Değer Açığı), ilk ve üçüncü mum arasında boşluk bulunan üç mumun birleşimidir. Hacim desteğinin olmadığı seviyeler arasında bir bölge oluşturur ve bu da sıklıkla fiyat düzeltmesine yol açar. BPR   (Dengeli Fiyat Aralığı), bir "köprü" oluşturan iki FVG modelinin birleşimidir - bir kırılma bölgesi ve fiyatın düşük
Forex Gump
Andrey Kozak
2.4 (5)
Forex Gump is a fully finished semi-automatic trading system. In the form of arrows, signals are displayed on the screen for opening and closing deals. All you need is to follow the instructions of the indicator. When the indicator shows a blue arrow, you need to open a buy order. When the indicator shows a red arrow, you need to open a sell order. Close orders when the indicator draws a yellow cross. In order to get the most effective result, we recommend using the timeframes H1, H4, D1. There
Gioteen Volatility Index (GVI)   - your ultimate solution to overcoming market unpredictability and maximizing trading opportunities. This revolutionary indicator helps you in lowering your losing trades due to choppy market movements. The GVI is designed to measure market volatility, providing you with valuable insights to identify the most favorable trading prospects. Its intuitive interface consists of a dynamic red line representing the volatility index, accompanied by blue line that indicat
EZZ Elite Zig Zag is an indicator for the MetaTrader 4 terminal. This indicator traces the peak of the trend based on the market reversal, thus showing various opportunities in the financial market. EZZ Elite Zig Zag is a visual tool, intuitive, and easy to understand and use.  Test it Yourself by Downloading it for Free. Author Paulo Rocha all rights reserved
MT4 Sürümü: https://www.mql5.com/en/market/product/166784 MT5 Sürümü: https://www.mql5.com/en/market/product/166785 LİKİDİTE PROFİLİ LİKİDİTE PROFİLİ, dinamik bir ısı haritası tarzı profil kullanarak grafikte potansiyel likidite bölgelerini haritalayan görsel bir piyasa yapısı aracıdır. Bu gösterge, geçmiş fiyat hareketlerini ve işlem hacmini analiz eder ve ardından likiditenin muhtemelen yoğunlaştığı fiyat alanlarını vurgular. Şunları çizer: Likidite çizgileri (potansiyel tepki/süpürme sevi
Indicator Description GOLD TITAN KING SIGNAL INDICATOR High-Precision Gold Scalping Buy/Sell Signals – Manual Trading Assistant Overview The Gold Titan King Signal Indicator is a manual trading assistant tool designed for high-frequency scalping on Gold (XAUUSD) and other major pairs. It generates clear BUY/SELL signals with precise entry levels, along with adjustable Stop Loss and Take Profit levels displayed directly on the chart. ️ This tool is NOT an EA. It does not execute trades
Cosmic Diviner X Planet
Olena Kondratenko
4 (2)
This unique multi-currency strategy simultaneously determines the strength of trends and market entry points, visualizing this using histograms on the chart. The indicator is optimally adapted for trading on the timeframes М5, М15, М30, Н1. For the convenience of users, the indicator renders the entry point (in the form of an arrow), recommended take profit levels (TP1, TP2 with text labels) and the recommended Stop Loss level. The take profit levels (TP1, TP2) are automatically calculated for
Profesyonel trader’lar ve değerlendirme hesapları (Prop) için Risk Yönetimi ve Limit İzleme Göstergesi Bu araç, risk yönetimi ve limitlere ilişkin bilgileri grafikte yalnızca görüntüler ve karar verme sürecinde odaklanmanıza yardımcı olur. Gösterge hiçbir işlemi açmaz/kapatmaz/değiştirmez ve Uzman Danışmanlar (EA) ile çakışmaz. Özellikler Günlük ve toplam drawdown izleme Günlük ve toplam drawdown’ı Bakiye (Balance) veya Özsermaye (Equity) bazında hesaplar ve gösterir (ayar yapılabilir). Tanımla
Description The Market Profile & Volume Profile Indicator is a powerful technical analysis tool designed to visualize market activity and price distribution over specific timeframes. Unlike standard technical indicators that focus solely on price over time, this indicator organizes price data to show where the market spent the most time (TPO) and where the most volume was traded (Volume Profile). It automatically calculates and displays key structural levels such as the Point of Control (POC) ,
Blahtech Supply Demand
Blahtech Limited
4.58 (36)
Was: $299  Now: $99   Supply Demand uses previous price action to identify potential imbalances between buyers and sellers. The key is to identify the better odds zones, not just the untouched ones. Blahtech Supply Demand indicator delivers functionality previously unavailable on any trading platform. This 4-in-1 indicator not only highlights the higher probability zones using a multi-criteria strength engine, but also combines it with multi-timeframe trend analysis, previously confirmed swings
Bu, bir mumun kapanış fiyatını tahmin eden bir göstergedir. Gösterge öncelikle D1 çizelgelerinde kullanılmak üzere tasarlanmıştır. Bu gösterge hem geleneksel forex ticareti hem de ikili opsiyon ticareti için uygundur. Gösterge, bağımsız bir ticaret sistemi olarak kullanılabilir veya mevcut ticaret sisteminize ek olarak hareket edebilir. Bu gösterge, mevcut mumu analiz ederek mumun gövdesi içindeki belirli güç faktörlerini ve önceki mumun parametrelerini hesaplar. Böylece gösterge, piyasa hareket
SX Supply Demand Zones accurately identifies and draws high-probability Supply and Demand zones using a sophisticated algorithm. Unlike traditional indicators that clutter your chart, this indicator is designed with a focus on performance and a clean user experience. New Unique Feature: Interactive Legend System What truly sets this indicator apart from everything else is the Interactive Control Legend. You have a professional dashboard directly on your chart that allows you to: Show/Hide: Ins
FREE
The Market Profile Indicator for MT4 displays the price levels and zones where increased trading activity happens. These zones with substantial forex trading activity provide the forex traders with the best entry levels, support, and resistance levels. Moreover, price levels indicate the best reversal zones. As a result, forex traders can identify BULLISH and BEARISH market trends and BUY and SELL entry points as well as the best reversal points. The indicator works well in all intraday timefram
M W Pattern Pro
Noiros Tech
4.14 (7)
M & W Pattern Pro is an advanced scanner for M and W patters , it uses extra filters to ensure scanned patterns are profitable. The indicator can be used with all symbols and time frames. The indicator is a non repaint indicator with accurate statistics calculations. To use , simply scan the most profitable pair using the statistics dashboard accuracy , then enter trades on signal arrow and exit at the TP and SL levels. STATISTICS : Accuracy 1 : This is the percentage of the times price hits TP
AW Candle Patterns MT4
AW Trading Software Limited
AW Mum Kalıpları göstergesi, güçlü bir mum kalıbı tarayıcı ile birleştirilmiş gelişmiş bir trend göstergesinin birleşimidir. En güvenilir otuz mum kalıbını tanımak ve vurgulamak için kullanışlı bir araçtır. Ek olarak, renkli çubuklara dayalı güncel bir trend analizörüdür.       yeniden boyutlandırılabilen ve konumlandırılabilen eklenti çoklu zaman çerçevesi trend paneli. Trend filtrelemeye bağlı olarak kalıpların görünümünü ayarlamak için benzersiz bir yetenek. Avantajlar: Mum desenlerini kolayc
Ugenesys AI MT4
Odaine Ramon Mcmillan
5 (1)
uGenesys AI - 90% Accurate Daytrading Indicator Introducing the ultimate forex trading indicator system, uGenesys AI, powered by cutting-edge AI technology and advanced analytical techniques, including Time-Series Analysis and Genetic Algorithms. Our AI-powered trading system leverages the power of time-series analysis to identify trends and patterns in historical price data, allowing traders to make informed predictions about future market movements. By analyzing vast amounts of data, our syst
For sure, this indicator has become very popular amongst traders. Through coding this indicator will give you the most accurate levels possible for your trading analysis. We have also added in the ability for you to receive alerts when the price breaks above or below a Support or Resistance lines! HOW TO USE The red rectangles represent your resistance/supply zone. The green rectangles represent your support/demand zone.  BONUS FEATURES We coded this indicator with the ability to switch between
Fibonacci retracement and extension line drawing tool Fibonacci retracement and extended line drawing tool for MT4 platform is suitable for traders who use  golden section trading Advantages: There is no extra line, no too long line, and it is easy to observe and find trading opportunities Trial version: https://www.mql5.com/zh/market/product/35884 Main functions: 1. Multiple groups of Fibonacci turns can be drawn directly, and the relationship between important turning points can be seen
We present you the indicator "Candle closing counter", which will become your indispensable assistant in the world of trading. That’s why knowing when the candle will close can help: If you like to trade using candle patterns, you will know when the candle will be closed. This indicator will allow you to check if a known pattern has formed and if there is a possibility of trading. The indicator will help you to prepare for market opening and market closure. You can set a timer to create a pre
QuantumEdge Trader
Hossam Ali Ahmed Ali
QuantumEdge Trader v1.0 AI-Powered Precision Signals for Serious Traders QuantumEdge Trader is a smart and reliable indicator that delivers accurate BUY and SELL signals using advanced market analysis and trend detection. Designed for M1 to M60 timeframes, it's ideal for scalping and intraday strategies. --- Key Features: No Repaint – Signals never change after appearing Smart trend filters to reduce noise Adjustable sensitivity and alerts Perfect for XAUUSD, EURUSD, and m
Reversal Pattern AI
Stanislav Konin
5 (1)
Reversal Pattern AI is a groundbreaking advancement in indicator development, combining artificial intelligence algorithms, multi-level market analysis, and classical technical analysis methods. It not only detects reversal patterns but also evaluates market inefficiencies, generating highly accurate trading signals.Thanks to its hybrid model, which utilizes price action analysis, volume, volatility, VWAP, and Volume AVG %, the indicator easily adapts to any market conditions. Reversal Pattern A
Owl smart levels
Sergey Ermolov
4.26 (38)
MT5 versiyonu  |  FAQ Owl Smart Levels Indicator ,   Bill Williams'ın gelişmiş fraktalları , piyasanın doğru dalga yapısını oluşturan Valable ZigZag ve kesin giriş seviyelerini gösteren   Fibonacci seviyeleri   gibi popüler piyasa analiz araçlarını içeren tek gösterge içinde eksiksiz bir ticaret sistemidir. pazara ve kar elde edilecek yerlere. Stratejinin ayrıntılı açıklaması Gösterge ile çalışma talimatı Baykuş Yardımcısı ticaretinde Danışman Yardımcısı Kullanıcıların özel sohbeti -> Satın ald
İşlem hacimlerine ilişkin okumaları hesaplayan teknik bir gösterge. Histogram biçiminde, ticaret enstrümanının hareket gücünün birikimini gösterir. Yükseliş ve düşüş yönleri için bağımsız hesaplama sistemlerine sahiptir. Herhangi bir ticaret enstrümanı ve zaman dilimi üzerinde çalışır. Herhangi bir ticaret sistemini tamamlayabilir. Gösterge değerlerini yeniden çizmez, sinyaller mevcut mum üzerinde görünür. Kullanımı kolaydır ve grafiği yüklemez, ek parametre hesaplamaları gerektirmez. Değiştiril
Market Profile 3
Hussien Abdeltwab Hussien Ryad
3 (2)
Market Profile 3 MetaTrader 4 indicator  — is a classic Market Profile implementation that can show the price density over time, outlining the most important price levels, value area, and control value of a given trading session. This indicator can be attached to timeframes between M1 and D1 and will show the Market Profile for daily, weekly, monthly, or even intraday sessions. Lower timeframes offer higher precision. Higher timeframes are recommended for better visibility. It is also possible t
FREE
ADX Shark Scalper – The Ultimate Hybrid Indicator for Precision Scalping Dive into the markets with the ADX Shark Scalper , a powerful and versatile tool designed for traders who seek precision in every trade. This cutting-edge indicator seamlessly combines multiple advanced technical signals into one streamlined system, allowing you to spot good buy and sell opportunities with ease. At its core, the ADX Shark Scalper leverages the power of trend and momentum detection through the integration of
Bu ürünün alıcıları ayrıca şunları da satın alıyor
El indicador "MR BEAST ALERTAS DE LIQUIDEZ" es una herramienta avanzada diseñada para proporcionar señales y alertas sobre la liquidez del mercado basándose en una serie de indicadores técnicos y análisis de tendencias. Ideal para traders que buscan oportunidades de trading en función de la dinámica de precios y los niveles de volatilidad, este indicador ofrece una visualización clara y detallada en la ventana del gráfico de MetaTrader. Características Principales: Canal ATR Adaptativo: Calcula
Are you looking for a simple and reliable indicator that can help you spot market swing points easily? Do you want clear buy and sell signals that work on any timeframe and any trading instrument? Buy Sell Signal Pro is designed to do exactly that. It helps traders identify important market turning points and understand the current market structure in a clear and easy way. This indicator detects Higher Highs (HH), Higher Lows (HL), Lower Highs (LH), and Lower Lows (LL) so you can quickly see wh
Miraculous Göstergesi – Gann Dokuz Kareye Dayalı %100 Tekrarlamayan Forex ve İkili Araç Bu video, Forex ve İkili Opsiyon traderları için özel olarak geliştirilmiş son derece doğru ve güçlü bir ticaret aracı olan Miraculous Göstergesi 'ni tanıtıyor. Bu göstergeyi benzersiz kılan, efsanevi Gann Dokuz Karesi ve Gann Titreşim Yasası 'na dayanmasıdır; bu da onu modern ticarette mevcut en hassas tahmin araçlarından biri yapmaktadır. Miraculous Göstergesi tamamen tekrarlamaz ; yani mum kapandıktan son
Precautions for subscribing to indicator This indicator only supports the computer version of MT4 Does not support MT5, mobile phones, tablets The indicator only shows the day's entry arrow The previous history arrow will not be displayed (Live broadcast is for demonstration) The indicator is a trading aid Is not a EA automatic trading No copy trading function The indicator only indicates the entry position No exit (target profit)  The entry stop loss point is set at 30-50 PIPS Or the front hi
Meravith
Ivan Stefanov
5 (3)
Market maker aracı. Meravith şunları yapar: Tüm zaman dilimlerini analiz eder ve geçerli trendi gösterir. Alış ve satış hacimlerinin eşit olduğu likidite bölgelerini (hacim dengesi) vurgular. Farklı zaman dilimlerinden tüm likidite seviyelerini doğrudan grafiğinizde gösterir. Referansınız için metin tabanlı piyasa analizi üretir ve sunar. Mevcut trende göre hedefler, destek seviyeleri ve stop-loss noktalarını hesaplar. İşlemleriniz için risk/ödül oranını hesaplar. Hesap bakiyenize göre pozisyon
GoldRush Trend Ok Sinyali GoldRush Trend Ok Sinyali göstergesi, XAU/USD'de yüksek hızlı, kısa vadeli scalperlar için özel olarak tasarlanmış hassas, gerçek zamanlı trend analizi sağlar. 1 dakikalık zaman dilimi için özel olarak tasarlanan bu araç, net giriş noktaları için yön okları gösterir ve scalper'ların değişken piyasa koşullarında güvenle hareket etmelerini sağlar. Gösterge, PRIMARY ve SECONDARY uyarı oklarından oluşur. PRIMARY sinyalleri, trend yönündeki değişikliği gösteren Beyaz ve
Looking for a powerful yet lightweight swing detector that accurately identifies market structure turning points? Want clear, reliable buy and sell signals that work across any timeframe and any instrument? Buy Sell Arrow MT Swing is built exactly for that — precision swing detection made simple and effective. This indicator identifies Higher Highs (HH) , Higher Lows (HL) , Lower Highs (LH) , and Lower Lows (LL) with remarkable clarity. It is designed to help traders easily visualize market stru
PairMaster Buy Sell Arrow Indicator for MT4 Trade Reversals Like a Pro — Catch Every Swing Point with Precision The PairMaster Buy Sell Arrow Indicator is a powerful MetaTrader 4 tool built to identify high-probability swing trading opportunities . Designed for traders who value accuracy, clarity, and simplicity, PairMaster detects key market turning points and plots intuitive buy and sell arrows directly on your chart. Key Features Accurate Swing Point Detection – Automatically identifies ma
"Dragon's Tail" is an integrated trading system, not just an indicator. This system analyzes each candle on a minute-by-minute basis, which is particularly effective in high market volatility conditions. The "Dragon's Tail" system identifies key market moments referred to as "bull and bear battles". Based on these "battles", the system gives trade direction recommendations. In the case of an arrow appearing on the chart, this signals the possibility of opening two trades in the indicated directi
Introducing a powerful, precision-engineered indicator that seamlessly combines Pivot Points, Moving Averages, and Multi-Timeframe Analysis to deliver high-probability Buy and Sell signals in real-time. This tool is your strategic edge, designed to identify trend reversals, market momentum, and optimal trade entries, no matter your preferred trading style. Our algorithm goes beyond standard indicators—by analyzing multiple timeframes simultaneously, it spots true market turning points while fi
Advanced Arrow
Alfred Kamal
3.9 (39)
This indicator depends on some secrets equations to draw Signals with Stop loss and maximum 4 Take profits. There is a free EA depends on this indicator as a gift when you purchase/rent it. Features Simply it gives you entry point as Ready sign (Buy / Sell) and arrow (Buy / Sell) after candle closed, also SL line and 4 TP lines or less. Once SL-TP lines are shown with the arrow, they remains as they are until signal change. It is historical indicator. No Repaint. user manual for V5 please click
" Dynamic Scalper System " göstergesi, trend dalgaları içinde işlem yapmak için scalping yöntemi için tasarlanmıştır. Başlıca döviz çiftleri ve altın üzerinde test edilmiştir, diğer işlem araçlarıyla uyumluluğu mümkündür. Ek fiyat hareketi desteğiyle trend boyunca pozisyonların kısa vadeli açılması için sinyaller sağlar. Göstergenin prensibi. Büyük oklar trend yönünü belirler. Küçük oklar şeklinde scalping için sinyaller üreten bir algoritma trend dalgaları içinde çalışır. Kırmızı oklar yüksel
Weis Wave with Alert
Trade The Volume Waves Single Member P.C.
4.82 (22)
Rental/Lifetime Package Options and Privileges' Rent Monthly Six Months   Yearly/Lifetime Weis Wave with Speed with Alert+Speed Index x x x Manual  x x x Quick Set up Video x x x Blog x x x Lifetime Updates x x x Setup and Training Material x x Rectangle Break Alert Tool      x Discord Access Channel "The SI traders" x   How to trade info visit:    http://www.tradethevolumewaves.com   ** If you purchase please contact me to setup your  : training Room and  complete manual access.  This is
Pulse Scalping Line - an indicator for identifying potential pivot points. Based on this indicator, you can build an effective Martingale system. According to our statistics, the indicator gives a maximum of 4 erroneous pivot points in a series. On average, these are 2 pivot points. That is, the indicator shows a reversal, it is erroneous. This means that the second signal of the indicator will be highly accurate. Based on this information, you can build a trading system based on the Martingale
Bomb Bank Signal
Igor Pereira Calil
5 (1)
Bomb Bank Signal: Your Trusted Indicator for MetaTrader 4 The Bomb Bank Signal is a powerful indicator for MetaTrader 4, designed to identify the most relevant trends in the financial market. If you are looking for a tool that accurately anticipates movements, Bomb Bank is the ally you need. How it Works: This indicator combines three distinct methods – volume analysis, candle closes and symmetrical trend – to detect and signal buying and selling opportunities. Bomb Bank is like a "bomb" whe
Algo Trading Indicaor  With this indicator , you’ll have zones and trends that hight probability the price will reverse from it. so will gives you all the help that you need  Why should you join us !?  1-This indicator is logical since it’s working in previous days movement , to predict the future movements. 2-Algo trading indicator will help you to draw trends which is special and are too strong than the basics trend , trends will change with the frame time that you work on . 3-We can use
F-16 Uçak Göstergesini tanıtıyoruz, ticaret deneyiminizi devrimleştirmek için tasarlanmış son teknoloji bir MT4 aracı. F-16 savaş uçağının eşsiz hızı ve hassasiyetinden ilham alan bu gösterge, finansal piyasalarda eşi benzeri olmayan performans sunmak için ileri algoritmalar ve son teknoloji teknolojileri bir araya getirir. F-16 Uçak Göstergesi ile gerçek zamanlı analiz sunarak yüksek doğruluklu ticaret sinyalleri üretirken rekabetin üzerine çıkacaksınız. Dinamik özellikleri, farklı varlık sınıf
OrderFlow Absorption – MT4 için Profesyonel Delta ve Absorpsiyon Sinyal Göstergesi OrderFlow Absorption ile gerçek emir akışı analizinin gücünü keşfedin – MetaTrader 4 için nihai delta histogramı ve absorpsiyon sinyal göstergesi. Fiyat hareketlerinin arkasında gerçekte neler olduğunu görmek isteyen traderlar için tasarlanan bu araç, piyasayı hareket ettiren gizli alım/satım baskısını ve absorpsiyon olaylarını ortaya çıkarır. Özellikler Delta Histogramı Görselleştirme:   Alım ve satım baskısını a
The Nihilist 5.0 Indicator includes Forexalien and Nihilist Easy Trend trading strategies and systems. It is composed of an MTF Dashboard where you can analyze the different input possibilities of each strategy at a glance. It has an alert system with different types of configurable filters. You can also configure which TF you want to be notified on your Metatrader 4 platform and Mobile application The indicator has the option to view how could be a TP and SL by using ATR or fixed points, even w
Product Name:   Quantum Regime Indicator Short Description:   A multi-engine structural regime and volatility filter. Description: Quantum Regime Indicator (QRI) is a sophisticated technical analysis algorithm designed to identify market structure shifts and volatility regimes. Unlike standard indicators that rely on immediate price action, QRI utilizes a hierarchical logic architecture to filter market noise and identify statistical extremes. The indicator is built on the philosophy of "Market
ZeusArrow Smart Liquidity Finder  Smart Liquidity Finder is Ai controlled indicator based on the Idea of Your SL is My Entry. It scan and draws the major Liquidity areas on chart partitioning them with Premium and Discount Zone and allows you find the best possible trading setups and help you decide the perfect entry price to avoid getting your Stop Loss hunted . Now no more confusion about when to enter and where to enter. Benefit from this one of it's kind trading tool powered by Ai an trade
Everyone who purchases the Scalping signals M1 indicator receives a FREE BONUS — a fully automated Expert Advisor that trades based on the indicator’s signals. The indicator shows the arrows — the robot can execute the trades for you, following all signals and risk-management rules. Scalping signals M1 – a ready-made trend-following entry system for M1 Scalping signals M1 is an indicator that turns your chart into a clear action map: a colored trend channel shows the direction of the market, and
ConfluencePro v2.0 – Ultimate Confluence Indicator for Binary Options & Forex Professional Multi-Filter Signal System with Dashboard, News Filter & Real-Time Statistics ConfluencePro v2.0 is the most advanced confluence-based indicator ever released on the MQL5 Market. It combines 17+ professional filters (Trend, Smart Money Concepts, Market Structure, Divergence, MTF Confirmation, News Events, Volume, Regime Detection and more) into a single, easy-to-read confluence score (0–100%). Only the hi
Yazarın Mesajı Ben 7 yıldan fazla süredir forex piyasasında işlem yapıyorum ve tam zamanlı bir trader ım. Ticaret yolculuğum boyunca, ticaretteki en büyük zorluğun stratejinin kendisi değil, doğru döviz çiftini seçmek olduğunu fark ettim. Ne kadar iyi tasarlanmış bir strateji olursa olsun, yanlış piyasada veya yanlış çift üzerinde uygulandığında etkisi büyük ölçüde azalır. Öte yandan, doğru döviz çifti seçildiğinde, birçok strateji doğal olarak performansını tam olarak gösterir. Bu farkındalı
BinaryIndicator is a highly accurate indicator for trading binary options. It shows excellent results in scalping. This indicator is based in multifactor analysis of trend indicators, as well as confirmation oscillators, which in the end gives an increased accuracy of signals. Advantages of the indicator Increased accuracy of signals. Excellent results when trading binary options with a short expiration time from M30 to M1 . It works on any timeframes. Works with any trade symbols. Parameters
Gold Channel is a volatility-based indicator, developed with a specific timing algorithm for the XAUUSD pair, which consists of finding possible corrections in the market. This indicator shows two outer lines, an inner line (retracement line) and an arrow sign, where the theory of the channel is to help identify overbought and oversold conditions in the market. The market price will generally fall between the boundaries of the channel. If prices touch or move outside the channel it is a tradi
BB Reversal Arrows Teknik Ticaret Sistemi, perakende kararları almak için ters noktaları tahmin etmek için geliştirilmiştir. Mevcut pazar durumu gösterge ile analiz edilir ve çeşitli kriterler için yapılandırılır: ters anlar beklentisi, potansiyel dönüm noktaları, satın alma ve satış sinyalleri. Gösterge fazla bilgi içermez, tüccarların makul kararlar vermesine izin veren görsel anlaşılabilir bir arayüze sahiptir. Tüm oklar mumu kapatıyor gibi görünüyor, yeniden çizim yapmadan, birkaç uyarı tür
RelicusRoad Pro
Relicus LLC
4.65 (106)
RelicusRoad Pro: Kantitatif Piyasa İşletim Sistemi ÖMÜR BOYU ERİŞİMDE %70 İNDİRİM (SINIRLI SÜRE) - 2.000+ TRADER'A KATILIN Neden çoğu trader "mükemmel" indikatörlere rağmen başarısız olur? Çünkü tekil kavramları boşlukta trade ederler. Bağlamı olmayan bir sinyal kumardır. Sürekli kazanmak için KONFLÜANS (UYUM) gerekir. RelicusRoad Pro basit bir ok indikatörü değildir. Tam bir Kantitatif Piyasa Ekosistemi dir. Tescilli volatilite modellemesini kullanarak fiyatın ilerlediği "Adil Değer Yolu"nu har
ECM Elite Channel is a volatility-based indicator, developed with a specific time algorithm, which consists of finding possible corrections in the market. This indicator shows two outer lines, an inner line (retracement line) and an arrow sign, where the channel theory is to help identify overbought and oversold conditions in the market. The market price will generally fall between the boundaries of the channel. If prices touch or move outside the channel, it's a trading opportunity. The ind
Rtc ML Ai | Predictor CORE MACHINE LEARNING ENGINE Adaptive ML Market Predictor – Multi-Bar Trend & Candle Forecast What This Indicator Does This indicator is a  real-time market prediction engine  designed to analyze price behavior and estimate  future market tendencies . Unlike conventional indicators, this system  does not rely on static parameters or historical curve-fitting , but adapts its internal state dynamically during live market operation. Instead of using static rules, the indic
Yazarın diğer ürünleri
Bir döviz çiftinin birden fazla zaman dilimini tek bir pencerede analiz etmek kafanızı karıştırabilir. Birden çok zaman dilimini analiz etmek için güvenilir göstergelere ihtiyacınız vardır. Bunlardan biri 9TF STOCH RSI kullanıyor. Basit ama güvenilir ve dokuz zaman dilimini tek bir göstergede kapsayan bir kod oluşturmak için gece gündüz çalışıyorum. Bu göstergenin bazı avantajlarına bakalım: Renkli histogram. Her zaman dilimindeki eğrinin rengi birbirinden farklıdır. STOCHASTIC ana hat ve
Analyzing multiple time frames of a currency pair in one window can make you confused. To analyze multiple time frames, you need reliable indicators. One of them is using 9TF RSI MA . I've been working day and night to create code that is simple but reliable and covers all nine time frames in just one indicator .  Let's look at some of the advantages of this indicator: Colorful histogram . The color of the curve in each timeframe is different from one another.  Arrows indicating the crossing of
Bir döviz çiftinin birden fazla zaman dilimini tek bir pencerede analiz etmek kafanızı karıştırabilir. Birden çok zaman dilimini analiz etmek için güvenilir göstergelere ihtiyacınız vardır. Bunlardan biri 9TF Double RSI Double MA kullanıyor. Basit ama güvenilir ve dokuz zaman dilimini tek bir göstergede kapsayan bir kod oluşturmak için gece gündüz çalışıyorum. Bu göstergenin bazı avantajlarına bakalım: Çift RSI, yani RSI daha hızlı ve RSI daha yavaş. Çift MA, yani MA daha hızlı ve MA daha
Bir döviz çiftinin birden fazla zaman dilimini tek bir pencerede analiz etmek kafanızı karıştırabilir. Birden çok zaman dilimini analiz etmek için güvenilir göstergelere ihtiyacınız vardır. Bunlardan biri 9TF Double CCI Double MA kullanıyor. Basit ama güvenilir ve dokuz zaman dilimini tek bir göstergede kapsayan bir kod oluşturmak için gece gündüz çalışıyorum. Bu göstergenin bazı avantajlarına bakalım: Çift CCI, yani CCI daha hızlı ve CCI daha yavaş. Çift MA, yani MA daha hızlı ve MA daha
Doğru bir CCI göstergesi mevcuttur. Pano Trend Çubuğu Smart Level 9TF Double CCI. Çift CCI, yani Hızlı CCI ve Yavaş CCI Neden ikinci CCİ'ye ihtiyacınız var? Ek göstergeler kullanmak, canlı ticarette bizi daha fazla ikna edecektir. 9TF Hızlı CCI eğrisi 9TF Yavaş CCI eğrisi 9TF gerçek zamanlı CCI açısı 9TF gerçek zamanlı CCI değeri 9TF gerçek zamanlı CCI yönü/fazı 9TF Eğilim Çubuğu Trend çubuğunun hesaplanmasında yeni algoritma Açma/Kapama Düğmesi. Tek bir tıklamayla göstergeyi göstermek/gizleme
Doğru bir RSI göstergesi mevcuttur. Pano Trend Çubuğu Akıllı Seviye 9TF Çift RSI. Çift RSI, yani Hızlı RSI ve Yavaş RSI Neden ikinci RSI'ya ihtiyacınız var? Ek göstergeler kullanmak, canlı ticarette bizi daha fazla ikna edecektir. 9TF Hızlı RSI eğrisi 9TF Yavaş RSI eğrisi 9TF gerçek zamanlı RSI açısı 9TF gerçek zamanlı RSI değeri 9TF gerçek zamanlı RSI yönü/fazı 9TF Eğilim Çubuğu Trend çubuğunun hesaplanmasında yeni algoritma Açma/Kapama Düğmesi. Tek bir tıklamayla göstergeyi göstermek/gizleme
Doğru bir MACD göstergesi mevcuttur. Gösterge Tablosu Trend Çubuğu Akıllı Seviye 9TF Çift MACD. Çift MACD, yani Hızlı (MACD 1) ve Yavaş (MACD 2) Neden ikinci MACD'ye ihtiyacınız var? Ek göstergeler kullanmak, canlı ticarette bizi daha fazla ikna edecektir. 9TF Hızlı MACD 1 eğrisi 9TF Yavaş MACD 2 eğrisi 9TF gerçek zamanlı MACD açısı 9TF gerçek zamanlı MACD değeri 9TF gerçek zamanlı MACD yönüDoğru bir MACD göstergesi mevcuttur. Gösterge Tablosu Trend Çubuğu Akıllı Seviye 9TF Çift MACD. Çift MA
Doğru bir Stokastik gösterge mevcuttur. Pano Trend Çubuğu Smart Level 9TF Dual Stokastik. İkili Stokastik, yani Hızlı Stokastik ve Yavaş Stokastik Neden ikinci Stokastik'e ihtiyacınız var? Ek göstergeler kullanmak, canlı ticarette bizi daha fazla ikna edecektir. 9TF Hızlı Stokastik eğri 9TF Yavaş Stokastik eğri 9TF gerçek zamanlı Stokastik açı 9TF gerçek zamanlı Stokastik değer 9TF gerçek zamanlı Stokastik yön/faz 9TF Eğilim Çubuğu Trend çubuğunun hesaplanmasında yeni algoritma Açma/Kapama Düğ
Yalnızca tek bir gösterge kullandığınız için sık sık işlem kaybediyorsanız bu işlem aracını deneyin. Bu ticaret aracı birden fazla gösterge kullanır. Yalnızca RSI göstergesini kullanan tüccarları sıklıkla gözlemliyorum. Çoğu zaman piyasa aşırı satıştadır ancak hala aşağıdadır veya piyasa aşırı alımdadır ancak hala yüksektir. Bu nedenle birden fazla gösterge kullanmanız gerekir. Yeni sürüm V 3.40 MTF PPAAF ile tanışın: Çoklu Zaman Çerçevesi Hassas Fiyat Eylem Oku Filtrelendi. Bu ticaret aracı, p
[V 1.00] MTF NRPA 5 Hareketli Ortalama RTD yayınlandı! Yeniden boyanmayan ok gerçek zamanlı pano. En iyi hareketli ortalama göstergesini arıyorsanız, doğru sayfadasınız. Genellikle insanlar iki hareketli ortalama kuracaktır çünkü iki hareketli ortalamanın kesişimi (çaprazlama) bir sonraki fiyat eğiliminin yönünü belirleyecektir. Hızlı hareket eden ortalama, yavaş hareket eden ortalama ile kesişiyorsa ve hızlı> yavaş ise, trend yukarıdır. Tersine, hızlı hareket eden ortalama, yavaş hareket ede
Introducing the advanced trading tools of 2023. MTF PPAAF Model S. This is sub window version of my best trading tool : MTF Precise Price Action Arrow Filtered.  Click here to learn more about MTF PPAAF . This trading tool is equipped with various powerful features : MTF = Multi Time Frame = Time Frame can be changed. On/off button. Non Repaint Arrows.  Customizable parameter, color etc.  Can show all time frame (ATF) crossover arrows of fast stochastic main line & fast stochastic signal line (
If you are curious about the position of the stochastic, RSI, CCI curve, whether it is at the OBOS level or not, then this trading tool is for you. Introducing the advanced trading tools of 2024. ATF Trend Following Trend Bar OBOS. This indicator is similar to MTF PPAAF Model S but have two layers.  Click here to learn more about MTF PPAAFS . This trading tool is equipped with various powerful features : MTF = Multi Time Frame = Time Frame can be changed. On/off button. Customizable parameter,
Merhaba tüccarlar. En iyi ticaret aracımla tanışın. MTF PPAAF Modeli T. Çoklu Zaman Çerçevesi Hassas fiyat eylem oku filtreli Model T.  Bu ticaret aracı, yıllar boyunca çeşitli ticaret araçları yaptıktan sonra yaptığım en iyi çalışmadır. Bu ticaret aracı neden en iyi ve güvenilirdir?  1. Bu araç 6 gösterge kullanır:  Çift CCI = hızlı CCI x yavaş CCI İkili Stokastik = hızlı Stokastik (hızlı Stokastik ana hat x hızlı Stokastik sinyal hattı) ve yavaş Stokastik (yavaş Stokastik ana hat
Bu işlem aracıyla aynı anda 15 piyasayı tarayabilirsiniz. Karşınızda yeni ticaret göstergesi 2024: ️ Kontrol Paneli Çoklu Para Birimi Çoklu Zaman Çerçevesi Stokastik. Bu ticaret aracını oluşturmamın en az iki nedeni var: Öncelikle tek piyasayı gözlemlemekten sıkıldım. İkincisi, başka bir pazara giriş anını kaybetmek istemiyorum. Bu yüzden aynı zamanda diğer piyasa koşullarını da bilmek istiyorum. Bu nedenle birden fazla piyasanın koşullarını aynı anda tarayabilecek bir tarayıcıya ihtiyac
Bu işlem aracıyla aynı anda 15 piyasayı tarayabilirsiniz. Karşınızda yeni ticaret göstergesi 2024: ️ Dashboard Çoklu Para Birimi Çoklu Zaman Çerçevesi Çift CCI. Bu ticaret aracını oluşturmamın en az iki nedeni var: Öncelikle tek piyasayı gözlemlemekten sıkıldım. İkincisi, başka bir pazara giriş anını kaybetmek istemiyorum. Bu yüzden aynı zamanda diğer piyasa koşullarını da bilmek istiyorum. Bu nedenle birden fazla piyasanın koşullarını aynı anda tarayabilecek bir tarayıcıya ihtiyacım var
Bu işlem aracıyla aynı anda 15 piyasayı tarayabilirsiniz. Karşınızda yeni ticaret göstergesi 2024: ️ Kontrol Paneli Çoklu Para Birimi Çoklu Zaman Çerçevesi Çift RSI. Bu ticaret aracını oluşturmamın en az iki nedeni var: Öncelikle tek piyasayı gözlemlemekten sıkıldım. İkincisi, başka bir pazara giriş anını kaybetmek istemiyorum. Bu yüzden aynı zamanda diğer piyasa koşullarını da bilmek istiyorum. Bu nedenle birden fazla piyasanın koşullarını aynı anda tarayabilecek bir tarayıcıya ihtiyacı
Looking for a trading tool based on the CCI indicator that can display crossovers arrows on all time frames? Introducing trading indicator : All Time Frame Double CCI Model T ready to help you achieve daily profits. This tool is created using the intersection of two CCI (Double CCI) indicator lines: the main CCI and the signal CCI. Using this tool makes it easier to observe the real-time dashboard and intersections of multiple timeframes simultaneously. Viewing both higher and lower timeframes
Looking for a trading tool based on the CCI indicator that can display crossovers arrows on all time frames? Introducing trading indicator : All Time Frame Double CCI Model S ready to help you achieve daily profits. This tool is created using the intersection of two CCI (Double CCI) indicator lines: the main CCI and the signal CCI. Using this tool makes it easier to observe the real-time dashboard and intersections of multiple timeframes simultaneously. Viewing both higher and lower timeframes
Looking for a trading tool based on the MACD indicator that can display crossovers arrows on all time frames? Introducing trading indicator : All Time Frame MACD Model T ready to help you achieve daily profits. This tool is created using the intersection of two indicator lines of MACD : the main MACD and the signal MACD. Using this tool makes it easier to observe the real-time dashboard and intersections of multiple timeframes simultaneously. Viewing both higher and lower timeframes simultaneou
Looking for a trading tool based on the MACD indicator that can display crossovers arrows on all time frames? Introducing trading indicator : All Time Frame MACD Model S ready to help you achieve daily profits. This tool is created using the intersection of two indicator lines of MACD : the main MACD and the signal MACD. Using this tool makes it easier to observe the real-time dashboard and intersections of multiple timeframes simultaneously. Viewing both higher and lower timeframes simultaneou
Looking for a trading tool based on the Stochastic indicator that can display crossovers arrows on all time frames? Introducing trading indicator : All Time Frame Stochastic Model T ready to help you achieve daily profits. This tool is created using the intersection of two indicator lines of Stochastic  : the main Stochastic  and the signal Stochastic . Using this tool makes it easier to observe the real-time dashboard and intersections of multiple timeframes simultaneously. Viewing both higher
Looking for a trading tool based on the Stochastic indicator that can display crossovers arrows on all time frames? Introducing trading indicator : All Time Frame Stochastic Model S ready to help you achieve daily profits. This tool is created using the intersection of two indicator lines of Stochastic  : the main Stochastic and the signal Stochastic . Using this tool makes it easier to observe the real-time dashboard and intersections of multiple timeframes simultaneously. Viewing both higher
Looking for a trading tool based on the RSI indicator that can display crossovers arrows on all time frames? Introducing trading indicator : All Time Frame Double RSI Model T ready to help you achieve daily profits. This tool is created using the intersection of two RSI (Double RSI) indicator lines: the main RSI and the signal RSI. Using this tool makes it easier to observe the real-time dashboard and intersections of multiple timeframes simultaneously. Viewing both higher and lower timeframes
Looking for a trading tool based on the RSI indicator that can display crossovers arrows on all time frames? Introducing trading indicator : All Time Frame Double RSI Model S ready to help you achieve daily profits. This tool is created using the intersection of two RSI (Double RSI) indicator lines: the main RSI and the signal RSI. Using this tool makes it easier to observe the real-time dashboard and intersections of multiple timeframes simultaneously. Viewing both higher and lower timeframes
Looking for a trading tool based on the moving average indicator that can display crossovers arrows on all time frames? Introducing trading indicator : All Time Frame Two MA Model T ready to help you achieve daily profits. This tool is created using the intersection of two moving average  indicator lines: the main MA1 and the signal MA2. Using this tool makes it easier to observe the real-time dashboard and intersections of multiple timeframes simultaneously. Viewing both higher and lower timef
Looking for a trading tool based on the moving average indicator that can display crossovers arrows on all time frames? Introducing trading indicator : All Time Frame Two MA Model S ready to help you achieve daily profits. This tool is created using the intersection of two moving average indicator lines: the main MA1 and the signal MA2. Using this tool makes it easier to observe the real-time dashboard and intersections of multiple timeframes simultaneously. Viewing both higher and lower timefr
Filtrele:
Violette
508
Violette 2025.05.21 17:58 
 

It DOES repaint, very disappointed.

I did purchase this because you clearly state on your title and description that your thing does NOT repaint, now you say that it DOES repaint and that it's normal. I call this a scam. By the way, keep your "keep learning" for you, you don't know who i am and if am or not an experienced trader. You refund me please as your claim "non repaint arrow" is wrong, thanks.

Anon Candra N
1552
Geliştiriciden yanıt Anon Candra N 2025.05.22 03:15
Before giving a bad rating please read this : As a developer, I can't control what is going on inside the brain of millions of traders (they buy or sell) at any hour throughout the trading day that drive price action through the various time frames all day long. I give you analogy. Very often, developer trading robot (expert advisor) suggest you (or set by algorithm) to use risk reward ratio for example 1:3. This means you can win $30 but risking loss $10. Why? Because of price action. Because of market volatility. So, stop loss hits. That's means the crossover arrow fail to appear. And very often, they also suggest you to use minimum deposit account balance.
Why? Because they set the risk reward ratio inside the algorithm. They can't control what is going on inside the brain of millions of traders. They can't tell you precisely when to buy and when to sell. What I can do as a developer (and also trader) is anticipate whether there's crossover lines or not. This trading indicator is based on technical analysis, i.e crossover of two lines and angle of line. If there is crossover between two lines then the arrows appear and NON REPAINT. But because of price action (market volatility), after several seconds or minutes, if the two lines failed to cross (it's just a test and won't last long) then the arrows disappear. And it must be disappear. Otherwise, the algorithm is wrong. Same logic applied to angle of line. If the angle of line is positive then up arrow appear. Likewise, if the angle of line is negative then down arrow appear. So if you see why arrow M1 repaint? Because of price action (I can't control people mind).
Why arrow M5 repaint? Because of price action. Why arrow M15 repaint? Because of price action. Why arrow M30 repaint? Because of price action. etc. To help you make better decision, this indicator is also equipped with REAL TIME 9TF dashboard monitor. Please monitor patiently such as buy when RSI from M1 to H4 all UP.
And sell when RSI from M1 to H4 all Down. Thank you for your purchase. And keep learning.
İncelemeye yanıt