MTF Non Repaint Arrow Five RSI RTD

1
【V1.00】MTF NRPA 5 RSI RTDがリリースされました!

非再描画矢印リアルタイム ダッシュボード。

さまざまな RSI インジケーターを使用するのにうんざりしていて、それらが不正確であると感じた場合は、このツールを試してください。 通常、時間枠内の OBOS レベルを決定するために RSI を 1 つだけインストールします。 悪いニュースは、さまざまな時間枠の OBOS レベルと傾向を一度に確認できないことです。 それが私がこの取引ツールを開発した理由です。

それは次のように説明されています。

この取引ツールでは、5 つの RSI を使用します。 はい、5つです! デフォルトでは、RSI 1 と RSI 2 を大きな時間枠、つまり M30 に設定します。 RSI 1 と RSI 2 の交差は、M30 タイムフレームでトレンドの変化があることを意味します。 次に、現在の(小さい)時間枠に RSI 3 と RSI 4 を設定します。たとえば、M5 でチャートを開いたとします。 RSI 3 と RSI 4 の交差点は、現在のタイムフレーム (M5) でトレンドの変化があることを意味します。 次に、トレンドの動きを確実にするために、RSI 5 をより高い時間枠 (H1) にインストールしました。 RSI 5が50のレベルを超えると(時間枠とOBOSレベルを設定できます)、矢印が表示されます。

この取引ツールには驚くべきことがたくさんあります。

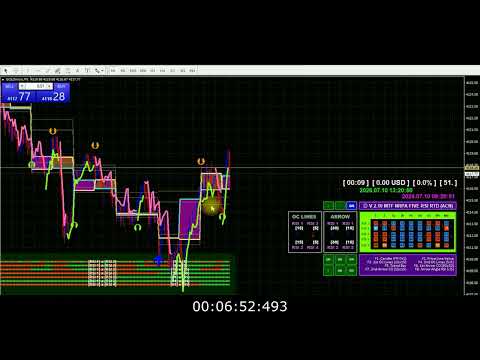
ご希望に応じて、5 つの RSI 時間枠を変更できます。 必要に応じて、線のスタイル、色のスタイル、RSI 交差矢印の種類、および RSI パラメータを変更できます。 さらに優れているのは、5 つの RSI のリアルタイム 9TF ダッシュボード モニターです。 適用できるダッシュボードの配色は 10 種類あります。 さて、ダッシュボード内のシンボルについて説明しましょう。 シンボルには2種類あります。 長方形の記号と矢印の記号 (上下)。 緑色の四角形のシンボルは、RSI 角度が正であり、トレンドが上昇していることを示します。 一方、赤色の四角形のシンボルは RSI 角度がマイナスであることを示し、これは下降トレンドを意味します。 さらに、RSI 1 が RSI 2 より上か下か、RSI 3 が RSI 4 より上か下かを観察できます。これは、上向きまたは下向きの矢印記号で確認できます。 また、9TF全てのRSI値をモニタリングすることも可能です。 すごいですね。 さらにあります。 ボタン機能。 ボタンをクリックすると、ワンクリックでこのインジケーターの表示/非表示を切り替えることができます。

これはまさに必須の取引ツールです。

価格が高騰する前に、この取引ツールを急いで購入してください。

自信を持ってエントリーして、プロのように取引しましょう。

ありがとう。

#rsiindicator #rsitradingstrategy #tradingindicators #tradingforex #tradingtips #bestindicator #doublersi
おすすめのプロダクト
Was: $249  Now: $99   Market Profile defines a number of day types that can help the trader to determine market behaviour. A key feature is the Value Area, representing the range of price action where 70% of trading took place. Understanding the Value Area can give traders valuable insight into market direction and establish the higher odds trade. It is an excellent addition to any system you may be using. Blahtech Limited presents their Market Profile indicator for the MetaTrader community. Ins
The indicator allows you to trade binary options. The recommended time frame is М1 and the expiration time is 1,2,3 minutes. The indicator suitable for auto and manual trading. A possible signal is specified as a arrows above/under a candle. You should wait until the candle closes! Arrows are not re-painted Trade sessions: TOKYO section (Half-end) Currency pairs: USD/JPY Working time frame: M1 Expiration time: 1,2,3 minutes. The indicator also shows good results when using the martingale strateg
FREE
BoxChart MT4
Evgeny Shevtsov
4.4 (5)
The market is unfair if only because 10% of participants manage 90% of funds. An ordinary trader has slim changes to stand against these "vultures". This problem can be solved. You just need to be among these 10%, learn to predict their intentions and move with them. Volume is the only preemptive factor that faultlessly works on any timeframe and symbol. First, the volume appears and is accumulated, and only then the price moves. The price moves from one volume to another. Areas of volume accumu
インディケータは現在のクオートを作成し、これを過去のものと比較して、これに基づいて価格変動予測を行います。インジケータには、目的の日付にすばやく移動するためのテキスト フィールドがあります。 オプション: シンボル - インジケーターが表示するシンボルの選択; SymbolPeriod - 指標がデータを取る期間の選択; IndicatorColor - インジケータの色; HorisontalShift - 指定されたバー数だけインディケータによって描画されたクオートのシフト; Inverse - true は引用符を逆にします。false - 元のビュー。 ChartVerticalShiftStep - チャートを垂直方向にシフトします (キーボードの上下矢印)。 次は日付を入力できるテキストフィールドの設定で、「Enter」を押すとすぐにジャンプできます。
Antabod Gamechanger
Rev Anthony Olusegun Aboderin
*Antabod GameChanger Indicator – Transform Your Trading!*   Are you tired of chasing trends too late or second-guessing your trades? The *Antabod GameChanger Indicator* is here to *revolutionize your trading strategy* and give you the edge you need in the markets!   Why Choose GameChanger? *Accurate Trend Detection* – GameChanger identifies trend reversals with *pinpoint accuracy*, ensuring you enter and exit trades at the optimal time.   *Clear Buy & Sell Signals* – No more guesswork! T
SMC Venom Model BPR インジケーターは、スマート マネー (SMC) コンセプトで取引するトレーダー向けのプロフェッショナル ツールです。価格チャート上の 2 つの主要なパターンを自動的に識別します。 FVG   (フェアバリューギャップ) は、3 本のローソク足の組み合わせで、最初のローソク足と 3 番目のローソク足の間にギャップがあります。ボリュームサポートのないレベル間のゾーンを形成し、価格修正につながることがよくあります。 BPR   (バランス価格範囲) は、2 つの FVG パターンの組み合わせで、「ブリッジ」を形成します。これは、価格がボリュームアクティビティの少ない動きで動くときに、ブレイクアウトしてレベルに戻るゾーンで、ローソク足の間にギャップを作成します。 これらのパターンは、大規模な市場プレーヤーと一般参加者の相互作用が発生するチャート上のボリュームと価格動向の分析に基づいて、トレーダーが主要なサポート/レジスタンス レベル、ブレイクアウト ゾーン、エントリ ポイントを識別するのに役立ちます。 インジケーターは、長方形と矢印の形でパターンを視
EZZ Elite Zig Zag is an indicator for the MetaTrader 4 terminal. This indicator traces the peak of the trend based on the market reversal, thus showing various opportunities in the financial market. EZZ Elite Zig Zag is a visual tool, intuitive, and easy to understand and use.  Test it Yourself by Downloading it for Free. Author Paulo Rocha all rights reserved
Discover the Power of Trend Strength Pro Unlock a new level of clarity in your trading with Trend Strength Pro , the ultimate tool for visualizing market momentum. Stop guessing and start seeing the true strength of a trend with a single glance. Our elegant and intuitive indicator helps you make smarter, more confident trading decisions. Key Advantages & Features Instantly See Trend Strength : Our color-coded histogram tells you whether the trend is getting stronger or weaker. Green means moment
FREE
Forex Gump
Andrey Kozak
2.4 (5)
Forex Gump is a fully finished semi-automatic trading system. In the form of arrows, signals are displayed on the screen for opening and closing deals. All you need is to follow the instructions of the indicator. When the indicator shows a blue arrow, you need to open a buy order. When the indicator shows a red arrow, you need to open a sell order. Close orders when the indicator draws a yellow cross. In order to get the most effective result, we recommend using the timeframes H1, H4, D1. There
Gioteen Volatility Index (GVI)   - your ultimate solution to overcoming market unpredictability and maximizing trading opportunities. This revolutionary indicator helps you in lowering your losing trades due to choppy market movements. The GVI is designed to measure market volatility, providing you with valuable insights to identify the most favorable trading prospects. Its intuitive interface consists of a dynamic red line representing the volatility index, accompanied by blue line that indicat
Indicator Description GOLD TITAN KING SIGNAL INDICATOR High-Precision Gold Scalping Buy/Sell Signals – Manual Trading Assistant Overview The Gold Titan King Signal Indicator is a manual trading assistant tool designed for high-frequency scalping on Gold (XAUUSD) and other major pairs. It generates clear BUY/SELL signals with precise entry levels, along with adjustable Stop Loss and Take Profit levels displayed directly on the chart. ️ This tool is NOT an EA. It does not execute trades
This unique multi-currency strategy simultaneously determines the strength of trends and market entry points, visualizing this using histograms on the chart. The indicator is optimally adapted for trading on the timeframes М5, М15, М30, Н1. For the convenience of users, the indicator renders the entry point (in the form of an arrow), recommended take profit levels (TP1, TP2 with text labels) and the recommended Stop Loss level. The take profit levels (TP1, TP2) are automatically calculated for
Was: $299  Now: $99   Supply Demand uses previous price action to identify potential imbalances between buyers and sellers. The key is to identify the better odds zones, not just the untouched ones. Blahtech Supply Demand indicator delivers functionality previously unavailable on any trading platform. This 4-in-1 indicator not only highlights the higher probability zones using a multi-criteria strength engine, but also combines it with multi-timeframe trend analysis, previously confirmed swings
プロトレーダーおよび評価型アカウント(Prop)向けリスク管理・制限監視インジケーター 本ツールは、リスク管理と各種リミットに関する情報をチャート上に表示するのみで、より集中した意思決定をサポートします。インジケーターはポジションの新規/決済/変更を行わず、エキスパートアドバイザー(EA)と干渉しません. 機能 日次および累計ドローダウンの監視 残高(Balance)または有効証拠金(Equity)を基準に日次/累計DDを計算・表示(設定可能)。 設定したリミットまでの残り割合を表示。 チャート上のクリーンでプロフェッショナルなパネル サマリー表:Balance、Equity、現在のP/L、日次/累計DD、アラート閾値。 判断に集中できる読みやすいUI。 リスクに基づくポジションサイズ パーセンテージ/固定金額のリスクと設定したストップロスに基づき概算ロットを算出。 R:R(リスクリワード)比とエントリー、SL、TPをチャートに表示。 アラートと通知 日次/累計DDの閾値に近づいた際にアラート(閾値は設定可能)。 価格がSL/TPに到達、またはその他の定義済みイベント発生時に通知。
これは、キャンドルの終値を予測する指標です。 このインジケータは、主にD1チャートでの使用を目的としていますが. この指標は、従来の外国為替取引とバイナリオプション取引の両方に適しています。 インジケーターは、スタンドアロンのトレーディングシステムとして使用することも、既存のトレーディングシステムへの追加として機能させることもできます。 このインジケーターは、現在のキャンドルを分析し、キャンドル自体の内部の特定の強度係数と、前のキャンドルのパラメーターを計算します。 したがって、この指標は、市場の動きのさらなる方向性と現在のキャンドルの終値を予測します。 この方法のおかげで、この指標は、短期の日中取引だけでなく、中期および長期の取引にも適しています。 インジケーターを使用すると、市場の状況の分析中にインジケーターが生成する潜在的な信号の数を設定できます。 インジケーターの設定には、このための特別なパラメーターがあります。 また、インジケーターは、チャート上のメッセージの形式で、電子メールで、およびPUSH通知の形式で、新しい信号について通知することができます。 購入後は必ず私に書いて
Descption: The Volume Profile displays detailed informations of historical trading activities at certain price levels (Market Profile). So you can locate the areas with the best prices in the market and get an advantage about other market participants. Features: Customizable Volume Profile / Market Profile Shows the "fair" Value Area with 70% of all Volume Shows critical low volume zones Shows VPOC, VAL and VAH Points Works on all timeframes Also available for MT5 ( https://www.mql5.com/en/mark
We present you the indicator "Candle closing counter", which will become your indispensable assistant in the world of trading. That’s why knowing when the candle will close can help: If you like to trade using candle patterns, you will know when the candle will be closed. This indicator will allow you to check if a known pattern has formed and if there is a possibility of trading. The indicator will help you to prepare for market opening and market closure. You can set a timer to create a pre
A technical indicator that calculates its readings on trading volumes. In the form of a histogram, it shows the accumulation of the strength of the movement of the trading instrument. It has independent calculation systems for bullish and bearish directions. Works on any trading instruments and time frames. Can complement any trading system. The indicator does not redraw its values, the signals appear on the current candle. It is easy to use and does not load the chart, does not require addition
フィボナッチリトレースと拡張ラインツール DiNapoliポイント取引方法とゴールデンセクション取引を使用するトレーダーにとって理想的なMT4プラットフォームのフィボナッチリトレースと拡張ラインツール 主な特長: あなたはフィボナッチリトレースメントの複数のセットを直接描くことができ、重要なリターンポイント間の関係は一目瞭然です。 2.フィボナッチ拡張を描画することができます。 3.フィボナッチフォールドバックとラインの延長は、簡単な観察と数値表示のために左右に動かすことができます。 4.チャートは非常に爽やかな 5.数字キーでサイクルを切り替えることができます。 ファンクションキー: 1。 [戻るを押す、要求に応じて描画する、最大8つのグループにする 2。拡張]を描くには[押す] 3。 \を押すと、現在のサイクルの下にあるすべての拡張機能と折り畳みが削除されます 4。フォールドバックを移動して削除して展開する (1)最初のフォールドバックセットのF5行をクリックします。 一度クリックすると(黄色に変わります)、キーボードのDeleteキーを押すと、フォーカ
The Market Profile Indicator for MT4 displays the price levels and zones where increased trading activity happens. These zones with substantial forex trading activity provide the forex traders with the best entry levels, support, and resistance levels. Moreover, price levels indicate the best reversal zones. As a result, forex traders can identify BULLISH and BEARISH market trends and BUY and SELL entry points as well as the best reversal points. The indicator works well in all intraday timefram
Owl smart levels
Sergey Ermolov
4.24 (37)
MT5版  |   FAQ Owl Smart Levels Indicator   は、 Bill Williams   の高度なフラクタル、市場の正しい波構造を構築する Valable ZigZag、エントリの正確なレベルをマークする Fibonacci レベルなどの一般的な市場分析ツールを含む 1 つのインジケーター内の完全な取引システムです。 利益を得るために市場と場所に。 戦略の詳細な説明 インジケータを操作するための指示 顧問-取引助手 プライベートユーザーチャット ->購入後に私に書いて、私はプライベートチャットにあなたを追加し、あなたはそこにすべてのボーナスをダウンロードすることができます 力はシンプルさにあります! Owl Smart Levels   取引システムは非常に使いやすいので、専門家にも、市場を勉強し始めて自分で取引戦略を選択し始めたばかりの人にも適しています。 戦略と指標に秘密の数式や計算方法が隠されているわけではなく、すべての戦略指標は公開されています。 Owl Smart Levels を使用すると、取引を開始するためのシグナルをすばやく確認し、注
マーケットシェーバー   マーケットスカルパー このインジケーターはRPTradeProSolutionsシステムの一部です。 Market Scalperは、プライスアクション、ダイナミックサポート、レジスタンスを使用した毎日のトレンド指標です。 誰でも使用できるように設計されており、トレーディングの初心者でも使用できます。 決して塗り直さないでください。 表示は近いものから近いものへと示されます。 単独で使用するように設計されているため、他のインジケーターは必要ありません。 明確でシンプルな表示を提供します どのように機能しますか MarketShaverはDualTimeFramesシステムを使用しています。 主な傾向はより高いTFによって取られますが、より速いものは取引を閉じるために使用されます トレードは1つずつ示され、同時に2つのトレードが存在することはありません。 マーケットシェーバーは次のことを示しています。 いつ取引するか いつそれを止めるか、利益か損失か。 貿易報酬 適切な期間終了TFを設定するのに役立つ多くの統計 マーケットシェーバーは動作します FXペ
M & W Pattern Pro is an advanced scanner for M and W patters , it uses extra filters to ensure scanned patterns are profitable. The indicator can be used with all symbols and time frames. The indicator is a non repaint indicator with accurate statistics calculations. To use , simply scan the most profitable pair using the statistics dashboard accuracy , then enter trades on signal arrow and exit at the TP and SL levels. STATISTICS : Accuracy 1 : This is the percentage of the times price hits TP
For sure, this indicator has become very popular amongst traders. Through coding this indicator will give you the most accurate levels possible for your trading analysis. We have also added in the ability for you to receive alerts when the price breaks above or below a Support or Resistance lines! HOW TO USE The red rectangles represent your resistance/supply zone. The green rectangles represent your support/demand zone.  BONUS FEATURES We coded this indicator with the ability to switch between
QuantumEdge Trader v1.0 AI-Powered Precision Signals for Serious Traders QuantumEdge Trader is a smart and reliable indicator that delivers accurate BUY and SELL signals using advanced market analysis and trend detection. Designed for M1 to M60 timeframes, it's ideal for scalping and intraday strategies. --- Key Features: No Repaint – Signals never change after appearing Smart trend filters to reduce noise Adjustable sensitivity and alerts Perfect for XAUUSD, EURUSD, and m
Market Profile 3
Hussien Abdeltwab Hussien Ryad
3 (2)
Market Profile 3 MetaTrader 4 indicator  — is a classic Market Profile implementation that can show the price density over time, outlining the most important price levels, value area, and control value of a given trading session. This indicator can be attached to timeframes between M1 and D1 and will show the Market Profile for daily, weekly, monthly, or even intraday sessions. Lower timeframes offer higher precision. Higher timeframes are recommended for better visibility. It is also possible t
FREE
これはほぼ間違いなく、MetaTraderプラットフォームで見つけることができる最も完全な調和価格形成自動認識インジケーターです。 19種類のパターンを検出し、フィボナッチプロジェクションをあなたと同じように真剣に受け止め、潜在的逆転ゾーン(PRZ)を表示し、適切なストップロスとテイクプロフィットレベルを見つけます。 [ インストールガイド | 更新ガイド | トラブルシューティング | よくある質問 | すべての製品 ] 19の異なる調和価格形成を検出します プライマリ、派生および補完フィボナッチ投影(PRZ)をプロットします 過去の価格行動を評価し、過去のすべてのパターンを表示します この指標は、独自の品質とパフォーマンスを分析します 適切なストップロスとテイクプロフィットのレベルを表示します ブレイクアウトを使用して適切な取引を通知します すべてのパターン比をグラフにプロットします 電子メール/音声/視覚アラートを実装します スコット・M・カーニーの本に着想を得て、この指標は最も純粋で急を要するトレーダーのニーズを満たすように設計されています。ただし、トレードを容易にする
ADX Shark Scalper – The Ultimate Hybrid Indicator for Precision Scalping Dive into the markets with the ADX Shark Scalper , a powerful and versatile tool designed for traders who seek precision in every trade. This cutting-edge indicator seamlessly combines multiple advanced technical signals into one streamlined system, allowing you to spot good buy and sell opportunities with ease. At its core, the ADX Shark Scalper leverages the power of trend and momentum detection through the integration of
ナイト ゴースト - バイナリ オプションの矢印インジケーター。 これからのあなたの頼もしいアシスタントです! 11 - チャートの再描画なし - すべての通貨ペアで大活躍! -インジケータの精度は最大 90% (特に夜間) ・長時間の設定不要(バイナリーオプションに最適な設定) - 信号が遅れない - 現在のローソク足でのシグナルの出現 ・M1期にピッタリ(No More!) ・目に優しいキャンドルカラー(赤・青) -インストールされたアラート それを扱う: - 青い矢印は信号アップを示します -赤い下向き矢印 M1 以上のインジケーターをチャートに配置しないでください. シグナルの精度が低下します! インジケーターのスクリーンショットとビデオを見る
AWキャンドルパターンインジケーターは、強力なキャンドルパターンスキャナーと組み合わせた高度なトレンドインジケーターの組み合わせです。これは、最も信頼性の高い30のローソク足パターンを認識して強調表示するための便利なツールです。さらに、それは色付きのバーに基づく現在の傾向分析器です。     サイズ変更と配置が可能なプラグインマルチタイムフレームトレンドパネル。トレンドフィルタリングに応じてパターンの表示を調整する独自の機能。 利点: キャンドルパターンを簡単に識別 結果を再描画しません 内蔵のマルチタイムトレンドパネル 無効なパターンタイプ(1、2、3キャンドル) パターン表示時のトレンドフィルタリングの調整 MT5 version - >   HERE   / Instructions and description  -> HERE 表示されるパターンのリスト: ハンマーパターン ピンアップ/ピンダウン 弱気なハラミ/強気なハラミ 弱気のハラミクロス/強気のハラミクロス ピボットポイント反転アップ/ピボットポイント反転ダウン ダブルバーローとハイクローズ/ダブルバーローとロークロ
このプロダクトを購入した人は以下も購入しています
Pulse Scalping Line - an indicator for identifying potential pivot points. Based on this indicator, you can build an effective Martingale system. According to our statistics, the indicator gives a maximum of 4 erroneous pivot points in a series. On average, these are 2 pivot points. That is, the indicator shows a reversal, it is erroneous. This means that the second signal of the indicator will be highly accurate. Based on this information, you can build a trading system based on the Martingale
現在20%OFF! 初心者やエキスパートトレーダーのためのベストソリューション! このダッシュボードソフトウェアは、28の通貨ペアで動作しています。それは私達の主要な指標(高度な通貨の強さ28と高度な通貨インパルス)の2に基づいています。それは全体の外国為替市場の大きい概観を与えます。それは、すべての(9)時間枠で28の外国為替ペアのための高度な通貨の強さの値、通貨の動きの速度と信号を示しています。チャート上で1つのインディケータを使用して市場全体を観察し、トレンドやスキャルピングの機会をピンポイントで見つけることができたら、あなたのトレードがどのように改善されるか想像してみてください。 このインディケータには、強い通貨と弱い通貨の識別、潜在的な取引の識別と確認がより簡単になるような機能が搭載されています。このインディケータは、通貨の強さや弱さが増加しているか減少しているか、また、すべての時間枠でどのように機能しているかをグラフィカルに表示します。 新機能として、現在の市場環境の変化に適応するダイナミックなマーケットフィボナッチレベルが追加され、すでに当社のAdvanced
Miraculous Indicator – ガン・スクエア・オブ・ナインに基づく100%非リペイントのFXおよびバイナリーツール この動画では、FXおよびバイナリーオプションのトレーダー向けに特別に開発された、非常に正確で強力な取引ツールである Miraculous Indicator を紹介しています。このインジケーターがユニークなのは、伝説的な ガン・スクエア・オブ・ナイン と ガンの振動の法則 に基づいている点で、現代の取引で利用できる最も正確な予測ツールの一つとなっています。 Miraculous Indicatorは 完全に非リペイント であり、ローソク足が確定した後にシグナルが変化したり消えたりすることはありません。つまり、見たものがそのまま利用できます。これにより、トレーダーは自信を持ってエントリーおよびエグジットを行うための信頼性と一貫性のある根拠を得ることができます。 主な特徴: ガン・スクエア・オブ・ナインとガン理論に基づいて構築 100%非リペイントのシグナルシステム すべての時間枠(M1、M5、H1、H4、日足、週足)で機能 FXおよびバイナリーオプション取引
Presenting one-of-a-kind Gann Indicator for XAUUSD IQ Gold Gann Levels is a non-repainting, precision tool designed exclusively for XAUUSD/Gold intraday trading. It uses W.D. Gann’s square root method to plot real-time support and resistance levels, helping traders spot high-probability entries with confidence and clarity. William Delbert Gann (W.D. Gann) was an exceptional market analyst whose trading technique was based on a complex blend of mathematics, geometry, astrology, and ancient calcul
F-16 Plane Indicatorをご紹介します。これは、取引体験を革新するために設計された最先端のMT4ツールです。F-16戦闘機の無類のスピードと精度に触発され、このインジケーターは高度なアルゴリズムと最新技術を組み合わせ、金融市場で比類のないパフォーマンスを提供します。 F-16 Plane Indicatorを使用すると、リアルタイムの分析と高精度な取引シグナルの生成が可能で、競争相手を圧倒します。ダイナミックな機能により、さまざまな資産クラスで利益を見つけることができ、自信を持って的確な決定を行うことができます。 使いやすいインターフェースを備えたF-16 Plane Indicatorは、人気のあるMetaTrader 4プラットフォームとシームレスに統合され、スムーズで効率的な取引プロセスを実現します。初心者のトレーダーでも経験豊富なプロフェッショナルでも、このインジケーターは独自の取引スタイルと好みに合わせて簡単にカスタマイズすることができます。 F-16 Plane Indicatorのパワーを体感し、市場のトレンドを精密かつ敏捷にナビゲートします。高度なチャー
Dynamic Forex28 Navigator - 次世代の Forex 取引ツール。 現在 49% オフ。 Dynamic Forex28 Navigator は、長年人気のインジケーターを進化させたもので、3 つの機能を 1 つにまとめています。 Advanced Currency Strength28 インジケーター (レビュー 695 件)  + Advanced Currency IMPULSE with ALERT (レビュー 520 件) + CS28 コンボ シグナル (ボーナス)。 インジケーターの詳細 https://www.mql5.com/en/blogs/post/758844 次世代の Strength インジケーターが提供するもの  オリジナルで気に入っていたすべての機能が、新機能と精度の向上によって強化されました。 主な機能: 独自の通貨強度計算式。 すべての時間枠でスムーズかつ正確な強度ライン。 トレンドの特定と正確なエントリーに最適です。 ダイナミックマーケットフィボナッチレベル (マーケットフィボナッチ)。 このインジケーターに固有
Stop Trading Random Signals. Start Trading with Real Confluence Are you tired of indicators that repaint, give conflicting signals, and leave you more confused than confident? The Quantum Regime Indicator is a professional, standalone trading tool designed for serious traders who demand a systematic edge. It solves the biggest problem in technical analysis— false signals —by using a powerful multi-engine framework. Every signal is confirmed by a confluence of market conditions , ensuring you onl
SHOGUN Trade - 16年間無調整の衝撃。戦略的市場構造と損小利大の極意 Click here for the MT5 version https://www.mql5.com/ja/market/product/160183 開発者も戦慄した「16年間」の真実 まず、添付した画像(バックテスト結果)をご覧ください。これはUSDJPY H1における、**2010年1月1日から2026年1月1日までの「丸16年間」**の検証結果です。 これはEA(自動売買)の販売ではありません。しかし、あえてこのグラフを提示させてください。「この結果、すごくないですか?」と。 特筆すべきは、この16年間、 一切のパラメーター調整(カーブフィッティング)を行っていない という点です。 リーマンショック後の混乱、アベノミクス、チャイナショック、ブレグジット、コロナショック、そして未曾有の歴史的円安――。市場のルールが何度も書き換わった激動の16年間を、このシステムは「無調整」のまま、見事な右肩上がりで突破しました。 圧倒的な3つの優位性 1. 「コツコツドカン」の真逆を行く設計(損小利大
Hidden Cycles
Lev Vladimirovic Marushkin
5 (1)
The Only 100% Universal Tool! Stop trading against nature! This is your chance to secure the only indicator rooted in the absolute laws that govern the entire universe. Most tools guess—this one reveals the truth. Buy another toy or buy the truth. Your choice... Based on Universal Laws — NOT Some Guy’s Algorithm: Let the market adjust to the Hidden Cycles Geometry — not the other way around. Most indicators are based on a man-made formula. They often lag, fail over time, or need constant re-o
ZeusArrow Smart Liquidity Finder  Smart Liquidity Finder is Ai controlled indicator based on the Idea of Your SL is My Entry. It scan and draws the major Liquidity areas on chart partitioning them with Premium and Discount Zone and allows you find the best possible trading setups and help you decide the perfect entry price to avoid getting your Stop Loss hunted . Now no more confusion about when to enter and where to enter. Benefit from this one of it's kind trading tool powered by Ai an trade
Meravith
Ivan Stefanov
5 (1)
このインジケーターは、各ポイントのボリュームを分析し、そのボリュームに対する市場の疲労レベルを計算します。 インジケーターは3本のラインで構成されています: 強気のボリューム疲労ライン 弱気のボリューム疲労ライン 市場のトレンドを示すライン。このラインは、市場が強気か弱気かに応じて色が変わります。 任意の開始点から市場を分析できます。一度ボリューム疲労ラインに達したら、次の分析を開始するための新しいポイントを設定してください。 トレンドや修正を分析できます。良いアプローチは、トレンドラインに達したときや、トップやボトムがヒットしたときにインジケーターを移動させることです。 トレンドラインとボリューム疲労ラインの距離が大きいほど、その方向のボリュームは大きくなります。 トレンドラインはオーダーを開く場所として使用でき、疲労ラインは利益を取るために使用されます。 このシステムは非常にユニークですが、非常に直感的でもあります。 市場には同様の製品はありません。 使用に制限はありません。すべての市場およびすべての時間枠で適用できます。 重要:MetaTrader4のテスターで確認する際は、紫色
The Super Arrow Indicator provides non-repainting buy and sell signals with exceptional accuracy. Key Features No repainting – confirmed signals remain fixed Clear visual arrows: green for buy, red for sell Real-time alerts via pop-up, sound, and optional email Clean chart view with no unnecessary clutter Works on all markets: Forex, gold, oil, indices, crypto Adjustable Parameters TimeFrame Default: "current time frame" Function: Sets the time frame for indicator calculation Options: Can be set
このインジケーターは実践的なトレードに最適な自動波動分析のインジケーターです! 場合... 注:   Tang Lun (Tang Zhong Shuo Zen) の命名規則の影響で、私は波のグレーディングに西洋の名前を使用することに慣れていません。基本的な波を ペン 、二次波のバンドを セグメント と名付けました。同時に、 セグメント にはトレンドの方向が指定されます (この命名方法は将来のノートで使用されます。最初に言っておきます)。ただし、アルゴリズムは曲がりくねった理論とはほとんど関係がないため、付けるべきではありません。これは、私の市場分析 によって要約された、絶えず変化する複雑な運用ルール を反映しています。 バンドは標準化され、人によって異なることがないよう定義されており、市場参入を厳密に分析する上で重要な役割を果たす人為的な干渉の描画方法が排除されています。 このインジケーターを使用することは、取引インターフェイスの美しさを改善することと同等であり、元の K ライン取引を放棄し、取引の新しいレベルに連れて行きます。また、宣伝の観点から顧客の認識も向上します。 イ
現在20%OFF! このダッシュボードは、複数のシンボルと最大9つのタイムフレームで動作するソフトウェアの非常に強力な部分です。 このソフトは、弊社のメインインジケーター(ベストレビュー:Advanced Supply Demand)をベースにしています。    Advanced Supply Demand ダッシュボードは、素晴らしい概要を提供します。それは示しています。  ゾーン強度評価を含むフィルタリングされた需給値。 ゾーン内/ゾーンへのPips距離。 ネストされたゾーンがハイライトされます。 選択されたシンボルの4種類のアラートを全ての(9)時間枠で提供します。 それはあなたの個人的なニーズに合わせて高度に設定可能です。 あなたの利益! すべてのトレーダーにとって最も重要な質問です。 市場に参入するのに最適なレベルはどこか? 成功のチャンスとリスク/リターンを得るために、強力な供給/需要ゾーン内またはその近くで取引を開始します。 損切りの最適な位置はどこですか? 最も安全なのは、強力な供給/需要ゾーンの下/上にストップを置くことです。 最適な利益
「 Dynamic Scalper System 」インジケーターは、トレンド波の中でスキャルピング取引を行う手法のために設計されています。 主要通貨ペアと金でテスト済みで、他の取引商品との互換性があります。 トレンドに沿った短期的なポジションオープンのシグナルを提供し、追加の価格変動サポートも提供します。 インジケーターの原理 大きな矢印はトレンドの方向を決定します。 トレンド波の中では、小さな矢印の形でスキャルピングシグナルを生成するアルゴリズムが機能します。 赤い矢印は強気方向、青い矢印は弱気方向です。 トレンドの方向には敏感な価格変動ラインが描かれ、小さな矢印のシグナルと連動します。 シグナルは次のように機能します。適切なタイミングでラインが現れるとエントリーシグナルが形成され、ラインが開いている間はポジションが保持され、完了すると取引が終了します。 推奨される動作時間枠はM1~H4です。 矢印は現在のローソク足に形成され、次のローソク足が開いている場合は、前のローソク足の矢印は再描画されません。 入力パラメータ Trend Wave Period - トレンド方向
BinaryIndicator is a highly accurate indicator for trading binary options. It shows excellent results in scalping. This indicator is based in multifactor analysis of trend indicators, as well as confirmation oscillators, which in the end gives an increased accuracy of signals. Advantages of the indicator Increased accuracy of signals. Excellent results when trading binary options with a short expiration time from M30 to M1 . It works on any timeframes. Works with any trade symbols. Parameters
The Nihilist 5.0 Indicator includes Forexalien and Nihilist Easy Trend trading strategies and systems. It is composed of an MTF Dashboard where you can analyze the different input possibilities of each strategy at a glance. It has an alert system with different types of configurable filters. You can also configure which TF you want to be notified on your Metatrader 4 platform and Mobile application The indicator has the option to view how could be a TP and SL by using ATR or fixed points, even w
Delta Swing Pro - マルチタイムフレーム・トレンド同調システム 製品コンセプト:時間足の矛盾を解消し、真の同調を捉える トレードにおける最大の障壁の一つは、時間足ごとの「方向性の矛盾」です。短期足が上昇を示していても、長期足が下降トレンドにある場合、そのノイズは多くの不必要な損失を招きます。 Delta Swing Pro は、異なる時間足のベクトルを「シンクロ(同調)」させるために設計されました。複数の時間軸が同じ方向へ動き出す「確率的優位性の高い局面」のみを特定し、迷いのない環境認識とエントリー判断を提供します。 5つの核心的な導入メリット 1. トレンド・コンセンサス機能(マルチタイムフレーム分析の最適化) 独自開発のアルゴリズムが、監視している全ての時間足のトレンドベクトルを内部で照合します。 技術的利点: 「短期は買い、長期は売り」といった矛盾を自動的に整理し、大きな資金の流れ(スマートマネー)と一致した方向のみを抽出します。 結果: 複雑なMTF分析をシンプル化し、一貫性のある戦略的な意思決定が可能になります。 2. 視覚的ステータスによる「待つ規
Gold Channel is a volatility-based indicator, developed with a specific timing algorithm for the XAUUSD pair, which consists of finding possible corrections in the market. This indicator shows two outer lines, an inner line (retracement line) and an arrow sign, where the theory of the channel is to help identify overbought and oversold conditions in the market. The market price will generally fall between the boundaries of the channel. If prices touch or move outside the channel it is a tradi
タイトル: BBMA 構造ガイド - BBMA 構造ガイド 説明: BBMA 構造ガイドは、BBMA 構造の進化をより簡単かつ効率的に理解するのに役立つ特別な MQL4 インジケーターです。BBMA、または「Bollinger Bands Moving Average」は、「一歩先を行く」というモットーで知られており、市場構造を深く理解することの重要性を強調しています。 BBMA 構造ガイドを使用すると、価格変動の基本的な市場構造パターンを迅速に識別できます。これにより、より正確かつ効果的な取引の決定が可能になります。このインジケーターは情報を明確で直感的に表示し、次の取引ステップをより自信を持って進むことができます。 主な特徴: - **深い理解:** BBMA 構造ガイドは、市場構造を明確に示し、市場のダイナミクスをより良く理解できます。 - **使いやすさ:** 直感的なインターフェイスで設計されており、すべての経験レベルのトレーダーが簡単に使用できます。 - **強力なシグナル:** このインジケーターは、**CSAK**(キャンドルスティックの強力な方向)や **MH
ゴールドラッシュ・トレンド・アロー・シグナル ゴールドラッシュ・トレンド・アロー・シグナル 指標は、XAU/USDにおける高速・短期スキャルパー向けに最適化された、正確でリアルタイムのトレンド分析を提供します。 1分足専用に設計されたこのツールは、明確なエントリーポイントを示す方向矢印を表示し、スキャルパーが変動の激しい市場状況でも自信を持って取引できるよう支援します。 この指標は、PRIMARY(主要)とSECONDARY(補助)のアラート矢印で構成されています。PRIMARYシグナルは、トレンドの方向転換を示す白と黒の方向矢印であり、SECONDARYシグナルは、PRIMARY矢印が示す方向を確認し、潜在的なエントリーポイントを示す青と赤の矢印です。 注意:トレンド方向の変化後にPRIMARYアラート矢印が1つだけ表示される場合、複数のSECONDARY青/赤矢印が表示される点に注意が必要です。SECONDARYシグナルは、シグナル基準を満たす任意のローソク足後に表示されます。したがって、長期的なトレンド移動の場合、画面に多くのSECONDARY矢印が表示されます(添付の
Looking for a powerful yet lightweight swing detector that accurately identifies market structure turning points? Want clear, reliable buy and sell signals that work across any timeframe and any instrument? Buy Sell Arrow MT Swing is built exactly for that — precision swing detection made simple and effective. This indicator identifies Higher Highs (HH) , Higher Lows (HL) , Lower Highs (LH) , and Lower Lows (LL) with remarkable clarity. It is designed to help traders easily visualize market str
Elliott Wave Trend was designed for the scientific wave counting. This tool focuses to get rid of the vagueness of the classic Elliott Wave Counting using the guideline from the template and pattern approach. In doing so, firstly Elliott Wave Trend offers the template for your wave counting. Secondly, it offers Wave Structural Score to assist to identify accurate wave formation. It offers both impulse wave Structural Score and corrective wave Structure Score. Structural Score is the rating to sh
OrderFlow Absorption – MT4用プロフェッショナル・デルタ&アブソープションシグナルインジケーター OrderFlow Absorptionで本物のオーダーフロー分析の力を解き放ちましょう。MetaTrader 4向けの究極のデルタヒストグラム&アブソープションシグナルインジケーターです。あらゆる価格変動の裏側で何が起きているのかを知りたいトレーダーのために設計されており、市場を動かす隠れた買い/売り圧力や吸収イベントを明らかにします。 特徴 デルタヒストグラムの可視化:   買い圧力・売り圧力を色分けされたヒストグラムで即座に表示。 アブソープションシグナル検出:   高度なロジックで強気・弱気の吸収イベントを特定し、反転の兆しを早期に通知。 チャートマーカー:   吸収シグナルをチャート上に直接マークし、視覚的に分かりやすく表示。 ポップアップアラート:   新しい吸収シグナルが出現した際にリアルタイムで通知。 カスタマイズ可能な閾値:   弱いシグナルを除外し、高確率のセットアップに集中。 リソース管理:   大きなチャートでも高速に動作する効率的な計算。
Gendel Gendut is Binary Option Indicator From @realTatino Trade with expaired time Pairs : All Forex Pair Time Frame : M5 only Trade Time All Time Alert : Alert Message, Alert Email, Alerts Push Buffer : 4 Buffer (0,2 (Buy) || 1,3 (Sell) Broker Suitable : All Broker Binary With Forex Pair Auto Trade : Yes Repaint : NO Delay : NO Other Binary Indicator : https://www.mql5.com/en/market/product/70915 https://www.mql5.com/en/market/product/71054 https://www.mql5.com/en/market/product/57755 etc IND
まず第一に、この取引ツールはノンリペイント、ノンリドロー、ノンラグの指標であり、プロの取引に理想的ですことを強調する価値があります。 オンラインコース、ユーザーマニュアル、デモ。 スマートプライスアクションコンセプトインジケーターは、新米から経験豊富なトレーダーまで、非常 に強力なツールです。Inner Circle Trader AnalysisやSmart Money Concepts Trading Strategiesなど、20以上の有用な指標を1つに組み合わせています。このインジケーターはスマートマネーコンセプトに焦点を当て、大手機関の取引方法を提供し、彼らの動きを予測するのに役立ちます。 特に、流動性分析に優れており、機関がどのように取引しているかを理解しやすくしています。市場のトレンドを予測し、価格の動きを慎重に分析するのに優れています。機関の戦略とトレードを合わせることで、市場の動向についてより正確な予測ができます。このインジケーターは多目的であり、市場構造を分析し、重要な注文ブロックを特定し、さまざまなパターンを認識するのに優れています。 このインジケーターは
This indicator is SO SIMPLE… when the green Rise Coming arrow appears, a price drop may be on the way! Plain and easy profits! As you receive more than one 'Rise Coming' text signal in a downtrend, it means momentum is building larger for a bull run. HOW TO USE 1. When the green "Rise Coming" text appears, a price jump may be on the way! This indicator Never Repaints! To get the best setting it's a matter of tweaking the indicator until it gives you the best results. Our recommendation, and what
Introduction to Fractal Pattern Scanner Fractal Indicator refers to the technical indicator that makes use of the fractal geometry found in the financial market. Fractal Pattern Scanner is the advanced Fractal Indicator that brings the latest trading technology after the extensive research and development work in the fractal geometry in the financial market. The most important feature in Fractal Pattern Scanner is the ability to measure the turning point probability as well as the trend probabi
Algo Trading Indicaor  With this indicator , you’ll have zones and trends that hight probability the price will reverse from it. so will gives you all the help that you need  Why should you join us !?  1-This indicator is logical since it’s working in previous days movement , to predict the future movements. 2-Algo trading indicator will help you to draw trends which is special and are too strong than the basics trend , trends will change with the frame time that you work on . 3-We can use
"Dragon's Tail" is an integrated trading system, not just an indicator. This system analyzes each candle on a minute-by-minute basis, which is particularly effective in high market volatility conditions. The "Dragon's Tail" system identifies key market moments referred to as "bull and bear battles". Based on these "battles", the system gives trade direction recommendations. In the case of an arrow appearing on the chart, this signals the possibility of opening two trades in the indicated directi
作者のその他のプロダクト
1 つのウィンドウで通貨ペアの複数の時間枠を分析すると、混乱する可能性があります。 複数の時間枠を分析するには、信頼できるインジケーターが必要です。 それらの 1 つは 9TF STOCH RSI を使用しています。 シンプルでありながら信頼性が高く、1 つのインジケーターで 9 つの時間枠すべてをカバーするコードを作成するために、昼夜を問わず取り組んできました。 このインジケーターの利点のいくつかを見てみましょう。 カラフルなヒストグラム。 各時間枠の曲線の色は互いに異なります。 STOCHASTICメインラインとシグナルラインの交差を示す矢印。 (注: 最後に表示される矢印は無視してください!) OBOS レベルライン。 リアルタイム 9TF ダッシュボード モニター。 ある時間枠から別の時間枠に変更しても、9TF ダッシュボード モニターの計算は非常に正確です。 どの曲線が買われ過ぎのレベルを上回っており、どの曲線が売られ過ぎのレベルを下回っているかを監視します。 メイン STOCH が信号 STOCH を上回っているか、またはその逆であるかを曲線で監視します。 メイ
Analyzing multiple time frames of a currency pair in one window can make you confused. To analyze multiple time frames, you need reliable indicators. One of them is using 9TF RSI MA . I've been working day and night to create code that is simple but reliable and covers all nine time frames in just one indicator .  Let's look at some of the advantages of this indicator: Colorful histogram . The color of the curve in each timeframe is different from one another.  Arrows indicating the crossing of
1 つのウィンドウで通貨ペアの複数の時間枠を分析すると、混乱する可能性があります。 複数の時間枠を分析するには、信頼できるインジケーターが必要です。 そのうちの1つが9TF Double RSI Double MAを使用しています。 シンプルでありながら信頼性が高く、1 つのインジケーターで 9 つの時間枠すべてをカバーするコードを作成するために、昼夜を問わず取り組んできました。 このインジケーターの利点のいくつかを見てみましょう。 RSI を 2 倍にします。つまり、RSI が速く、RSI が遅くなります。 MA を 2 倍にします。つまり、MA が速くなり、MA が遅くなります。 10配色。 各時間枠の曲線の色は互いに異なります。 RSIのOBOSレベルライン。 リアルタイム 9TF ダッシュボード モニター。 ある時間枠から別の時間枠に変更しても、9TF ダッシュボード モニターの計算は非常に正確です。 どの RSI 曲線が買われ過ぎのレベルを上回っており、どの RSI 曲線が売られ過ぎのレベルを下回っているかを監視します。 MA ファスト ラインが MA スロー ラ
1 つのウィンドウで通貨ペアの複数の時間枠を分析すると、混乱する可能性があります。 複数の時間枠を分析するには、信頼できるインジケーターが必要です。 そのうちの1つが9TF Double CCI Double MAを使用しています。 シンプルでありながら信頼性が高く、1 つのインジケーターで 9 つの時間枠すべてをカバーするコードを作成するために、昼夜を問わず取り組んできました。 このインジケーターの利点のいくつかを見てみましょう。 CCI を 2 倍にします。つまり、CCI が速く、CCI が遅くなります。 MA を 2 倍にします。つまり、MA が速くなり、MA が遅くなります。 10配色。 各時間枠の曲線の色は互いに異なります。 CCIのOBOSレベルライン。 リアルタイム 9TF ダッシュボード モニター。 ある時間枠から別の時間枠に変更しても、9TF ダッシュボード モニターの計算は非常に正確です。 どの CCI 曲線が買われ過ぎのレベルを上回っており、どの CCI 曲線が売られ過ぎのレベルを下回っているかを監視します。 MA ファスト ラインが MA スロー ラ
正確な CCI インジケータが利用可能です。 ダッシュボード トレンド バー スマート レベル 9TF ダブル CCI。 Double CCI、つまり Fast CCI と Slow CCI 2 番目の CCI が必要な理由 追加のインジケーターを使用すると、ライブ取引でより説得力が増します 9TF ファスト CCI カーブ 9TF スロー CCI カーブ 9TF リアルタイム CCI 角度 9TF リアルタイム CCI 値 9TF リアルタイム CCI 方向/位相 9TF トレンドバー トレンドバーを計算する新しいアルゴリズム オン/オフボタン。 ワンクリックでインジケータを表示/非表示にするのに非常に便利 リアルタイム 9TF ダッシュボード モニター トレンドバーのみ表示可能 CCI 曲線のみを表示する機能 ダッシュボードのみを表示する機能 表示する CCI 曲線を選択する機能 トレンドの矢印タイプを選択可能 obos ライン スタイルを選択する機能 凡例を表示/非表示にする機能 小節の数を増減する機能 配色レベルを選択する機能 最大 10 個のダッシュボード トレンド バー
正確な RSI インジケーターが利用可能です。 ダッシュボード トレンド バー スマート レベル 9TF ダブル RSI。 ダブルRSI、つまり速いRSIと遅いRSI なぜ2番目のRSIが必要なのですか? 追加のインジケーターを使用すると、ライブ取引でより説得力が増します 9TF 高速 RSI 曲線 9TF スロー RSI カーブ 9TF リアルタイム RSI アングル 9TF リアルタイム RSI 値 9TF リアルタイム RSI 方向/位相 9TF トレンドバー トレンドバーを計算する新しいアルゴリズム オン/オフボタン。 ワンクリックでインジケータを表示/非表示にするのに非常に便利 リアルタイム 9TF ダッシュボード モニター トレンドバーのみ表示可能 RSI 曲線のみを表示する機能 ダッシュボードのみを表示する機能 表示するRSI曲線を選択する機能 トレンドの矢印タイプを選択可能 obos ライン スタイルを選択する機能 凡例を表示/非表示にする機能 小節の数を増減する機能 配色レベルを選択する機能 最大 10 個のダッシュボード トレンド バーの配色を選択する機能 RS
正確な MACD インジケーターが利用可能です。 ダッシュボード トレンド バー スマート レベル 9TF ダブル MACD。 デュアル MACD、つまり高速 (MACD 1) と低速 (MACD 2) 2 つ目の MACD が必要な理由 追加のインジケーターを使用すると、ライブ取引でより説得力が増します 9TF ファースト MACD 1 カーブ 9TF 遅い MACD 2 カーブ 9TF リアルタイム MACD 角度 9TF リアルタイム MACD 値 9TF リアルタイム MACD 方向正確な MACD インジケーターが利用可能です。 ダッシュボード トレンド バー スマート レベル 9TF ダブル MACD。 デュアル MACD、つまり高速 (MACD 1) と低速 (MACD 2) 2 つ目の MACD が必要な理由 追加のインジケーターを使用すると、ライブ取引でより説得力が増します 9TF ファースト MACD 1 カーブ 9TF 遅い MACD 2 カーブ 9TF リアルタイム MACD 角度 9TF リアルタイム MACD 値 9TF リアルタイム MACD 方向/
正確な確率指標が利用可能です。 ダッシュボード トレンド バー スマート レベル 9TF デュアル ストキャスティクス。 デュアル ストキャスティクス、つまりファスト ストキャスティクスとスロー ストキャスティクス セカンド ストキャスティクスが必要な理由 追加のインジケーターを使用すると、ライブ取引でより説得力が増します 9TF 高速確率曲線 9TF スロー ストキャスティクス カーブ 9TF リアルタイム確率角 9TFリアルタイム確率値 9TF リアルタイム確率的方向/位相 9TF トレンドバー トレンドバーを計算する新しいアルゴリズム オン/オフボタン。 ワンクリックでインジケータを表示/非表示にするのに非常に便利 リアルタイム 9TF ダッシュボード モニター トレンドバーのみ表示可能 確率曲線のみを表示する機能 ダッシュボードのみを表示する機能 表示する確率曲線を選択する機能 トレンドの矢印タイプを選択可能 obos ライン スタイルを選択する機能 凡例を表示/非表示にする機能 バーの数を増減する機能 配色レベルを選択する機能 最大 10 個のダッシュボード トレンド バ
インジケーターを 1 つしか使用しないためにトレードで頻繁に負ける場合は、この取引ツールを試してください。 この取引ツールは複数のインジケーターを使用します。 私はRSIインジケーターのみを使用するトレーダーをよく観察します。 市場は売られすぎているのにまだ下落している、または市場は買われすぎているのにまだ上昇していることがよくあります。 このため、複数のインジケーターを使用する必要があります。 新しいバージョン V 3.40 MTF PPAAF の紹介: マルチ タイム フレームの正確なプライス アクション矢印フィルター。 この取引ツールは、市場の動きの方向性を強化するためにさまざまな指標を使用します。 この取引ツールで使用される最初の指標はデュアル ストキャスティクスです。 ここでは、ファスト ストキャスティクスとスロー ストキャスティクスという 2 つのストキャスティクスを使用します。 ファストストキャスティクスには、ファストストキャスティクスメインラインとファストストキャスティクスシグナルラインがあります。 同様に、スロー ストキャスティックには、スロー ストキャスティック
【V 1.00】MTF NRPA 5 移動平均RTDがリリースされました! 非再描画矢印リアルタイム ダッシュボード。 最適な移動平均インジケーターをお探しなら、ここが正しいページです。 一般に、2 つの移動平均の交点 (クロスオーバー) が次の価格トレンドの方向を決定するため、2 つの移動平均を設定します。 高速移動平均が低速移動平均と交差し、高速 > 低速の場合、トレンドは上昇しています。 逆に、速い移動平均が遅い移動平均と交差し、速い < 遅い場合、トレンドは下降しています。 2 つの移動平均の欠点は、長期的な傾向が見えないことです。 それが私がこの取引ツールを開発した理由です。 それは次のように説明されています。 この取引ツールでは、5 つの移動平均を使用します。 はい、5つです! デフォルトでは、MA 1 と MA 2 を大きな時間枠 (H1) に設定します。 MA 1 と MA 2 の交差は、上半期の時間枠でトレンドの変化があることを意味します。 次に、現在の時間枠(小さい)に MA 3 と MA 4 を設定します。たとえば、M5 でチャートを開きます。 MA 3
Introducing the advanced trading tools of 2023. MTF PPAAF Model S. This is sub window version of my best trading tool : MTF Precise Price Action Arrow Filtered.  Click here to learn more about MTF PPAAF . This trading tool is equipped with various powerful features : MTF = Multi Time Frame = Time Frame can be changed. On/off button. Non Repaint Arrows.  Customizable parameter, color etc.  Can show all time frame (ATF) crossover arrows of fast stochastic main line & fast stochastic signal line (
If you are curious about the position of the stochastic, RSI, CCI curve, whether it is at the OBOS level or not, then this trading tool is for you. Introducing the advanced trading tools of 2024. ATF Trend Following Trend Bar OBOS. This indicator is similar to MTF PPAAF Model S but have two layers.  Click here to learn more about MTF PPAAFS . This trading tool is equipped with various powerful features : MTF = Multi Time Frame = Time Frame can be changed. On/off button. Customizable parameter,
トレーダーの皆様、こんにちは。 私の最高の取引ツールを紹介します。 機動部隊 PPAAF モデル T. マルチタイムフレーム 正確なプライスアクションアローフィルタリングされたモデル T。  この取引ツールは、長年さまざまな取引ツールを作成してきた私の最高傑作です。 なぜこの取引ツールが最高で信頼できるのでしょうか?  1. このツールは 6 つのインジケーターを使用します。  ダブル CCI = 高速 CCI x 低速 CCI デュアル ストキャスティクス = 高速ストキャスティクス (高速ストキャスティクス メイン ライン x 高速ストキャスティクス シグナル ライン) & スロー ストキャスティクス (低速ストキャスティクス メイン ライン x 低速ストキャスティクス シグナル ライン)  デュアルMACD = 高速MACD (高速MACDメインライン x 高速MACDシグナルライン) & スローMACD (低速MACDメインライン x 低速MACDシグナルライン) 6 つの移動平均 = MA 1 x MA 2 、MA 3 x MA 4 および
この取引ツールを使用すると、15 の市場を同時にスキャンできます。 新しい取引指標 2024 のご紹介: ️ ダッシュボード マルチ通貨 マルチタイムフレーム 確率的。 私がこの取引ツールを作成した理由は少なくとも 2 つあります。 まず、1 つの市場だけを観察することに飽きました。 次に、別の市場への参入の瞬間を逃したくないです。 だからこそ、他の市況も同時に知りたいのです。 このため、複数の市場の状況を同時にスキャンできるスキャナーが必要です。 私は確率的メインライン > (または <=) 確率的シグナルラインが M1 から H4 (または単に M1 から M30) で始まる市場をよく探します。 私の分析に同意するなら、これがあなたが探していた取引指標です。 市況が上記の要件を満たす瞬間を見逃さないでください。 これは、多くの優れた機能を備えたストキャスティックのスキャナーまたはダッシュボードです。 確率的メインラインのデータを表示可能 確率シグナルラインのデータを表示可能 確率的メインラインとシグナルラインの位置を表示可能(シグナルラインの上のメインライ
この取引ツールを使用すると、15の市場を同時にスキャンできます。 新しい取引インジケーター2024のご紹介: ️ダッシュボード マルチ通貨 マルチタイムフレーム ダブルCCI。 この取引ツールを作成した理由は少なくとも2つあります。 まず、1つの市場だけを観察することに飽き飽きしています。 次に、別の市場でのエントリーの瞬間を失いたくないのです。 そのため、同時に他の市場の状況を知りたいのです。 このため、複数の市場の状況を同時にスキャンできるスキャナーが必要です。 私は、高速CCIライン> (または<=) 低速CCIラインがM1からH4 (またはM1からM30のみ) から始まる市場をよく探します。 私の分析に同意するなら、これはあなたが探していた取引インジケーターです。 市場の状況が上記の要件を満たす瞬間を逃さないでください。 これは、多くの優れた機能を備えたストキャスティクスのスキャナーまたはダッシュボードです。 高速 CCI ラインのデータを表示できます 低速 CCI ラインのデータを表示できます 高速 CCI ラインと低速 CCI ラインの位置を表示
この取引ツールを使用すると、15 の市場を同時にスキャンできます。 新しい取引指標 2024 のご紹介: ️ ダッシュボードのマルチ通貨マルチタイムフレームダブルRSI。 私がこの取引ツールを作成した理由は少なくとも 2 つあります。 まず、1 つの市場だけを観察することに飽きました。 次に、別の市場への参入の瞬間を逃したくないです。 だからこそ、他の市況も同時に知りたいのです。 このため、複数の市場の状況を同時にスキャンできるスキャナーが必要です。 私は、高速 RSI ライン > (または <=) 低速 RSI ラインが M1 から H4 (または単に M1 から M30) で始まる市場をよく探します。 また、M1 から M30 まで売られすぎ/買われすぎの市場をよく探します。 私の分析に同意するなら、これがあなたが探していた取引指標です。 市況が上記の要件を満たす瞬間を見逃さないでください。 これは、多くの優れた機能を備えたストキャスティックのスキャナーまたはダッシュボードです。 高速RSIラインのデータを表示可能 遅いRSIラインのデータも表示可能 高
Looking for a trading tool based on the CCI indicator that can display crossovers arrows on all time frames? Introducing trading indicator : All Time Frame Double CCI Model T ready to help you achieve daily profits. This tool is created using the intersection of two CCI (Double CCI) indicator lines: the main CCI and the signal CCI. Using this tool makes it easier to observe the real-time dashboard and intersections of multiple timeframes simultaneously. Viewing both higher and lower timeframes
Looking for a trading tool based on the CCI indicator that can display crossovers arrows on all time frames? Introducing trading indicator : All Time Frame Double CCI Model S ready to help you achieve daily profits. This tool is created using the intersection of two CCI (Double CCI) indicator lines: the main CCI and the signal CCI. Using this tool makes it easier to observe the real-time dashboard and intersections of multiple timeframes simultaneously. Viewing both higher and lower timeframes
Looking for a trading tool based on the MACD indicator that can display crossovers arrows on all time frames? Introducing trading indicator : All Time Frame MACD Model T ready to help you achieve daily profits. This tool is created using the intersection of two indicator lines of MACD : the main MACD and the signal MACD. Using this tool makes it easier to observe the real-time dashboard and intersections of multiple timeframes simultaneously. Viewing both higher and lower timeframes simultaneou
Looking for a trading tool based on the MACD indicator that can display crossovers arrows on all time frames? Introducing trading indicator : All Time Frame MACD Model S ready to help you achieve daily profits. This tool is created using the intersection of two indicator lines of MACD : the main MACD and the signal MACD. Using this tool makes it easier to observe the real-time dashboard and intersections of multiple timeframes simultaneously. Viewing both higher and lower timeframes simultaneou
Looking for a trading tool based on the Stochastic indicator that can display crossovers arrows on all time frames? Introducing trading indicator : All Time Frame Stochastic Model T ready to help you achieve daily profits. This tool is created using the intersection of two indicator lines of Stochastic  : the main Stochastic  and the signal Stochastic . Using this tool makes it easier to observe the real-time dashboard and intersections of multiple timeframes simultaneously. Viewing both higher
Looking for a trading tool based on the Stochastic indicator that can display crossovers arrows on all time frames? Introducing trading indicator : All Time Frame Stochastic Model S ready to help you achieve daily profits. This tool is created using the intersection of two indicator lines of Stochastic  : the main Stochastic and the signal Stochastic . Using this tool makes it easier to observe the real-time dashboard and intersections of multiple timeframes simultaneously. Viewing both higher
Looking for a trading tool based on the RSI indicator that can display crossovers arrows on all time frames? Introducing trading indicator : All Time Frame Double RSI Model T ready to help you achieve daily profits. This tool is created using the intersection of two RSI (Double RSI) indicator lines: the main RSI and the signal RSI. Using this tool makes it easier to observe the real-time dashboard and intersections of multiple timeframes simultaneously. Viewing both higher and lower timeframes
Looking for a trading tool based on the RSI indicator that can display crossovers arrows on all time frames? Introducing trading indicator : All Time Frame Double RSI Model S ready to help you achieve daily profits. This tool is created using the intersection of two RSI (Double RSI) indicator lines: the main RSI and the signal RSI. Using this tool makes it easier to observe the real-time dashboard and intersections of multiple timeframes simultaneously. Viewing both higher and lower timeframes
Looking for a trading tool based on the moving average indicator that can display crossovers arrows on all time frames? Introducing trading indicator : All Time Frame Two MA Model T ready to help you achieve daily profits. This tool is created using the intersection of two moving average  indicator lines: the main MA1 and the signal MA2. Using this tool makes it easier to observe the real-time dashboard and intersections of multiple timeframes simultaneously. Viewing both higher and lower timef
Looking for a trading tool based on the moving average indicator that can display crossovers arrows on all time frames? Introducing trading indicator : All Time Frame Two MA Model S ready to help you achieve daily profits. This tool is created using the intersection of two moving average indicator lines: the main MA1 and the signal MA2. Using this tool makes it easier to observe the real-time dashboard and intersections of multiple timeframes simultaneously. Viewing both higher and lower timefr
フィルタ:
Violette
458
Violette 2025.05.21 17:58 
 

It DOES repaint, very disappointed.

I did purchase this because you clearly state on your title and description that your thing does NOT repaint, now you say that it DOES repaint and that it's normal. I call this a scam. By the way, keep your "keep learning" for you, you don't know who i am and if am or not an experienced trader. You refund me please as your claim "non repaint arrow" is wrong, thanks.

Anon Candra N
1552
開発者からの返信 Anon Candra N 2025.05.22 03:15
Before giving a bad rating please read this : As a developer, I can't control what is going on inside the brain of millions of traders (they buy or sell) at any hour throughout the trading day that drive price action through the various time frames all day long. I give you analogy. Very often, developer trading robot (expert advisor) suggest you (or set by algorithm) to use risk reward ratio for example 1:3. This means you can win $30 but risking loss $10. Why? Because of price action. Because of market volatility. So, stop loss hits. That's means the crossover arrow fail to appear. And very often, they also suggest you to use minimum deposit account balance.
Why? Because they set the risk reward ratio inside the algorithm. They can't control what is going on inside the brain of millions of traders. They can't tell you precisely when to buy and when to sell. What I can do as a developer (and also trader) is anticipate whether there's crossover lines or not. This trading indicator is based on technical analysis, i.e crossover of two lines and angle of line. If there is crossover between two lines then the arrows appear and NON REPAINT. But because of price action (market volatility), after several seconds or minutes, if the two lines failed to cross (it's just a test and won't last long) then the arrows disappear. And it must be disappear. Otherwise, the algorithm is wrong. Same logic applied to angle of line. If the angle of line is positive then up arrow appear. Likewise, if the angle of line is negative then down arrow appear. So if you see why arrow M1 repaint? Because of price action (I can't control people mind).
Why arrow M5 repaint? Because of price action. Why arrow M15 repaint? Because of price action. Why arrow M30 repaint? Because of price action. etc. To help you make better decision, this indicator is also equipped with REAL TIME 9TF dashboard monitor. Please monitor patiently such as buy when RSI from M1 to H4 all UP.
And sell when RSI from M1 to H4 all Down. Thank you for your purchase. And keep learning.
レビューに返信