MTF Non Repaint Arrow Five RSI RTD

1
[V 1.00] 기동특무부대 NRPA 5 RSI RTD 출시!

다시 칠하지 않는 화살표 실시간 대시보드.

다양한 RSI 지표를 사용하는 데 지쳤지만 정확하지 않은 경우 이 도구를 사용해 보십시오. 일반적으로 사람들은 일정 기간 동안 OBOS 수준을 결정하기 위해 1 RSI만 설치합니다. 나쁜 소식은 다양한 시간대의 OBOS 수준과 추세를 한 번에 볼 수 없다는 것입니다. 이것이 제가 이 거래 도구를 개발한 이유입니다.

설명 방법은 다음과 같습니다.

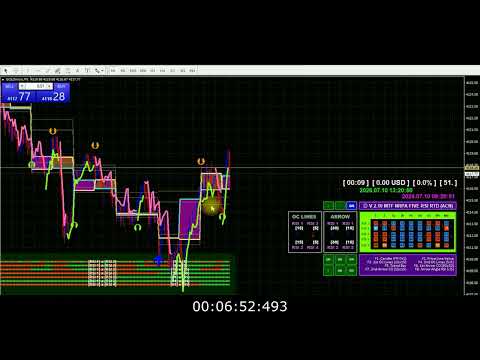
이 거래 도구에서는 5개의 RSI를 사용합니다. 예, 다섯! 기본적으로 M30이라는 큰 시간 프레임에 RSI 1과 RSI 2를 설정합니다. RSI 1과 RSI 2의 교차점은 M30 시간대에 추세 변화가 있음을 의미합니다. 그런 다음 현재(작은) 시간대에 RSI 3과 RSI 4를 설정합니다. 예를 들어 M5에서 차트를 엽니다. RSI 3과 RSI 4의 교차점은 현재 시간대(M5)에 추세 변화가 있음을 의미합니다. 그런 다음 추세 움직임을 보장하기 위해 더 높은 시간대(H1)에 RSI 5를 설치했습니다. RSI 5가 50 수준을 넘으면(시간 프레임과 OBOS 수준을 설정할 수 있음) 화살표가 나타납니다.

이 거래 도구에는 다음과 같은 놀라운 기능이 많이 있습니다.

원하는 대로 5개의 RSI 기간을 변경할 수 있습니다. 선 스타일을 변경할 수 있고 색상 스타일을 변경할 수 있으며 RSI 교차 화살표의 유형을 변경할 수 있으며 원하는 대로 RSI 매개변수를 변경할 수 있습니다. 5개 RSI의 실시간 9TF 대시보드 모니터가 더 좋습니다. 10가지 대시보드 색 구성표를 적용할 수 있습니다. 자, 이제 대시보드 내부의 기호에 대해 설명하겠습니다. 두 종류의 기호가 있습니다. 사각형 기호 및 화살표 기호(위 및 아래). 녹색 사각형 기호는 RSI 각도가 양수임을 나타내며 추세가 상승했음을 의미합니다. 빨간색 사각형 기호는 RSI 각도가 음수임을 나타내며 이는 하락세를 의미합니다. 또한 RSI 1이 RSI 2보다 높거나 낮은지 여부와 RSI 3이 RSI 4보다 높거나 낮은지 여부를 관찰할 수 있습니다. 이는 위 또는 아래를 가리키는 화살표 기호에서 볼 수 있습니다. 또한 모든 9TF의 RSI 값을 모니터링 할 수 있습니다. 놀랍지 않나요? 그리고 더 있습니다. 버튼 기능입니다. 버튼을 클릭하면 한 번의 클릭으로 이 지표를 숨기거나 표시할 수 있습니다!

이것은 진정으로 당신이 가져야 할 거래 도구입니다.

가격이 오르기 전에 서둘러 이 거래 도구를 구매하세요!

자신감 있게 입력하고 프로처럼 거래하세요.

감사합니다.

#rsiindicator #rsitradingstrategy #tradingindicators #tradingforex #tradingtips #bestindicator #doublersi
추천 제품
Blahtech Market Profile
Blahtech Limited
4.53 (15)
Was: $249  Now: $99   Market Profile defines a number of day types that can help the trader to determine market behaviour. A key feature is the Value Area, representing the range of price action where 70% of trading took place. Understanding the Value Area can give traders valuable insight into market direction and establish the higher odds trade. It is an excellent addition to any system you may be using. Blahtech Limited presents their Market Profile indicator for the MetaTrader community. Ins
The indicator allows you to trade binary options. The recommended time frame is М1 and the expiration time is 1,2,3 minutes. The indicator suitable for auto and manual trading. A possible signal is specified as a arrows above/under a candle. You should wait until the candle closes! Arrows are not re-painted Trade sessions: TOKYO section (Half-end) Currency pairs: USD/JPY Working time frame: M1 Expiration time: 1,2,3 minutes. The indicator also shows good results when using the martingale strateg
FREE
BoxChart MT4
Evgeny Shevtsov
4.4 (5)
The market is unfair if only because 10% of participants manage 90% of funds. An ordinary trader has slim changes to stand against these "vultures". This problem can be solved. You just need to be among these 10%, learn to predict their intentions and move with them. Volume is the only preemptive factor that faultlessly works on any timeframe and symbol. First, the volume appears and is accumulated, and only then the price moves. The price moves from one volume to another. Areas of volume accumu
History Pattern Search
Yevhenii Levchenko
표시기는 현재 시세를 작성하여 과거 시세와 비교할 수 있으며 이를 바탕으로 가격 변동을 예측합니다. 표시기에는 원하는 날짜로 빠르게 이동할 수 있는 텍스트 필드가 있습니다. 옵션: 기호 - 표시기가 표시할 기호 선택. SymbolPeriod - 지표가 데이터를 가져올 기간 선택. IndicatorColor - 표시기 색상. HorisontalShift - 지시자가 그린 따옴표를 지정된 막대 수만큼 이동합니다. Inverse - true는 인용 부호를 반대로, false - 원래 보기를 반전합니다. ChartVerticalShiftStep - 차트를 수직으로 이동합니다(키보드의 위/아래 화살표). 다음은 날짜를 입력할 수 있는 텍스트 필드의 설정으로, '엔터'를 누르면 즉시 이동할 수 있습니다.
Antabod Gamechanger
Rev Anthony Olusegun Aboderin
*Antabod GameChanger Indicator – Transform Your Trading!*   Are you tired of chasing trends too late or second-guessing your trades? The *Antabod GameChanger Indicator* is here to *revolutionize your trading strategy* and give you the edge you need in the markets!   Why Choose GameChanger? *Accurate Trend Detection* – GameChanger identifies trend reversals with *pinpoint accuracy*, ensuring you enter and exit trades at the optimal time.   *Clear Buy & Sell Signals* – No more guesswork! T
SMC Venom Model BPR 지표는 Smart Money(SMC) 개념 내에서 일하는 트레이더를 위한 전문 도구입니다. 가격 차트에서 두 가지 주요 패턴을 자동으로 식별합니다. FVG (공정 가치 갭)는 3개의 캔들의 조합으로, 첫 번째와 세 번째 캔들 사이에 갭이 있습니다. 이는 볼륨 지원이 없는 레벨 사이에 구역을 형성하여 종종 가격 수정으로 이어집니다. BPR (균형 가격 범위)은 두 개의 FVG 패턴의 조합으로, "브리지"를 형성합니다. 이는 가격이 낮은 볼륨 활동으로 움직일 때 브레이크아웃과 레벨로의 복귀 구역으로, 캔들 사이에 갭을 생성합니다. 이러한 패턴은 거래자가 차트에서 거래량과 가격 역학을 분석하여 주요 지지/저항 수준, 돌파 구역 및 진입 지점을 식별하는 데 도움이 되며, 여기서 대형 시장 참여자와 일반 참여자 간의 상호 작용이 발생합니다. 이 지표는 사각형과 화살표 형태로 패턴을 시각화하며 유연한 경고 설정도 지원합니다. 주요 특징: 패턴 표시 모드:
EZZ Zig Zag MT4
Paulo Rocha
5 (1)
EZZ Elite Zig Zag is an indicator for the MetaTrader 4 terminal. This indicator traces the peak of the trend based on the market reversal, thus showing various opportunities in the financial market. EZZ Elite Zig Zag is a visual tool, intuitive, and easy to understand and use.  Test it Yourself by Downloading it for Free. Author Paulo Rocha all rights reserved
Discover the Power of Trend Strength Pro Unlock a new level of clarity in your trading with Trend Strength Pro , the ultimate tool for visualizing market momentum. Stop guessing and start seeing the true strength of a trend with a single glance. Our elegant and intuitive indicator helps you make smarter, more confident trading decisions. Key Advantages & Features Instantly See Trend Strength : Our color-coded histogram tells you whether the trend is getting stronger or weaker. Green means moment
FREE
Forex Gump
Andrey Kozak
2.4 (5)
Forex Gump is a fully finished semi-automatic trading system. In the form of arrows, signals are displayed on the screen for opening and closing deals. All you need is to follow the instructions of the indicator. When the indicator shows a blue arrow, you need to open a buy order. When the indicator shows a red arrow, you need to open a sell order. Close orders when the indicator draws a yellow cross. In order to get the most effective result, we recommend using the timeframes H1, H4, D1. There
Gioteen Volatility Index (GVI)   - your ultimate solution to overcoming market unpredictability and maximizing trading opportunities. This revolutionary indicator helps you in lowering your losing trades due to choppy market movements. The GVI is designed to measure market volatility, providing you with valuable insights to identify the most favorable trading prospects. Its intuitive interface consists of a dynamic red line representing the volatility index, accompanied by blue line that indicat
Gold Titan King Scalper
Dodong Christian Arnon
Indicator Description GOLD TITAN KING SIGNAL INDICATOR High-Precision Gold Scalping Buy/Sell Signals – Manual Trading Assistant Overview The Gold Titan King Signal Indicator is a manual trading assistant tool designed for high-frequency scalping on Gold (XAUUSD) and other major pairs. It generates clear BUY/SELL signals with precise entry levels, along with adjustable Stop Loss and Take Profit levels displayed directly on the chart. ️ This tool is NOT an EA. It does not execute trades
Cosmic Diviner X Planet
Olena Kondratenko
4 (2)
This unique multi-currency strategy simultaneously determines the strength of trends and market entry points, visualizing this using histograms on the chart. The indicator is optimally adapted for trading on the timeframes М5, М15, М30, Н1. For the convenience of users, the indicator renders the entry point (in the form of an arrow), recommended take profit levels (TP1, TP2 with text labels) and the recommended Stop Loss level. The take profit levels (TP1, TP2) are automatically calculated for
Blahtech Supply Demand
Blahtech Limited
4.58 (36)
Was: $299  Now: $99   Supply Demand uses previous price action to identify potential imbalances between buyers and sellers. The key is to identify the better odds zones, not just the untouched ones. Blahtech Supply Demand indicator delivers functionality previously unavailable on any trading platform. This 4-in-1 indicator not only highlights the higher probability zones using a multi-criteria strength engine, but also combines it with multi-timeframe trend analysis, previously confirmed swings
Nirvana prop controler MT4
Aiireza Arjmandi Nezhad
전문 트레이더와 평가형 계정(Prop)을 위한 위험 관리 및 한도 모니터링 지표 이 도구는 위험 관리와 한도에 관한 정보를 차트에 표시만 하여, 더 집중해서 의사결정을 내리도록 돕습니다. 인디케이터는 포지션을 열거나/닫거나/변경하지 않으며, 익스퍼트 어드바이저(EA)와도 충돌하지 않습니다. 기능 일일 및 총 드로우다운 모니터링 잔고(Balance) 또는 에쿼티(Equity)를 기준으로 일일/총 드로우다운을 계산·표시합니다(설정 가능). 설정된 한도까지 남은 비율을 표시합니다. 차트 내 깔끔하고 전문적인 패널 요약 표: Balance, Equity, 현재 P/L, 일일/총 DD, 경고 임계값. 의사결정에 집중할 수 있도록 간결하고 가독성 높은 UI. 위험 기반 포지션 사이징 퍼센트/고정 금액 리스크와 선택한 손절폭(SL)에 따라 대략적인 거래량을 산출. 위험대비보상비(R:R)와 진입, SL, TP 레벨을 차트에 표시. 경고와 알림 일일/총 DD 임계값에 근접 시 경고(임계값 퍼센트
캔들의 종가를 예측하는 지표입니다. 지표는 주로 D1 차트에서 사용하기 위한 것이. 이 지표는 전통적인 외환 거래와 바이너리 옵션 거래 모두에 적합합니다. 지표는 독립형 거래 시스템으로 사용하거나 기존 거래 시스템에 추가로 사용할 수 있습니다. 이 표시기는 현재 양초를 분석하여 양초 본체 내부의 특정 강도 요인과 이전 양초의 매개변수를 계산합니다. 따라서 지표는 시장 움직임의 추가 방향과 현재 양초의 종가를 예측합니다. 이 방법 덕분에 지표는 단기 및 중장기 거래 모두에 적합합니다. 지표를 사용하면 시장 상황을 분석하는 동안 지표가 생성할 잠재적 신호의 수를 설정할 수 있습니다. 표시기 설정에는 이를 위한 특별한 매개변수가 있습니다. 또한 인디케이터는 새로운 신호에 대해 차트의 메시지 형태, 이메일 및 PUSH 알림 형태로 알릴 수 있습니다. 구매 후 저에게 꼭 써주세요! 나는 당신에게 지표와 거래에 대한 나의 추천을 줄 것입니다! 또한 보너스를 받으세요!
VolumeProfile
Robert Hess
3.8 (5)
Descption: The Volume Profile displays detailed informations of historical trading activities at certain price levels (Market Profile). So you can locate the areas with the best prices in the market and get an advantage about other market participants. Features: Customizable Volume Profile / Market Profile Shows the "fair" Value Area with 70% of all Volume Shows critical low volume zones Shows VPOC, VAL and VAH Points Works on all timeframes Also available for MT5 ( https://www.mql5.com/en/mark
We present you the indicator "Candle closing counter", which will become your indispensable assistant in the world of trading. That’s why knowing when the candle will close can help: If you like to trade using candle patterns, you will know when the candle will be closed. This indicator will allow you to check if a known pattern has formed and if there is a possibility of trading. The indicator will help you to prepare for market opening and market closure. You can set a timer to create a pre
A technical indicator that calculates its readings on trading volumes. In the form of a histogram, it shows the accumulation of the strength of the movement of the trading instrument. It has independent calculation systems for bullish and bearish directions. Works on any trading instruments and time frames. Can complement any trading system. The indicator does not redraw its values, the signals appear on the current candle. It is easy to use and does not load the chart, does not require addition
Fibonacci retracement and extension line drawing tool Fibonacci retracement and extended line drawing tool for MT4 platform is suitable for traders who use  golden section trading Advantages: There is no extra line, no too long line, and it is easy to observe and find trading opportunities Trial version: https://www.mql5.com/zh/market/product/35884 Main functions: 1. Multiple groups of Fibonacci turns can be drawn directly, and the relationship between important turning points can be seen
The Market Profile Indicator for MT4 displays the price levels and zones where increased trading activity happens. These zones with substantial forex trading activity provide the forex traders with the best entry levels, support, and resistance levels. Moreover, price levels indicate the best reversal zones. As a result, forex traders can identify BULLISH and BEARISH market trends and BUY and SELL entry points as well as the best reversal points. The indicator works well in all intraday timefram
Owl smart levels
Sergey Ermolov
4.24 (37)
MT5 버전  |   FAQ Owl Smart Levels Indicator 는   Bill Williams 의 고급 프랙탈, 시장의 올바른 파동 구조를 구축하는 Valable ZigZag, 정확한 진입 수준을 표시하는 피보나치 수준과 같은 인기 있는 시장 분석 도구를 포함하는 하나의 지표 내에서 완전한 거래 시스템입니다. 시장과 이익을 취하는 장소로. 전략에 대한 자세한 설명 표시기 작업에 대한 지침 고문-거래 올빼미 도우미의 조수 개인 사용자 채팅 ->구입 후 나에게 쓰기,나는 개인 채팅에 당신을 추가하고 거기에 모든 보너스를 다운로드 할 수 있습니다 힘은 단순함에 있습니다! Owl Smart Levels   거래 시스템은 사용하기 매우 쉽기 때문에 전문가와 이제 막 시장을 연구하고 스스로 거래 전략을 선택하기 시작한 사람들 모두에게 적합합니다. 전략 및 지표에는 눈에 보이지 않는 비밀 공식 및 계산 방법이 없으며 모든 전략 지표는 공개되어 있습니다. Owl Smart Leve
Market Shaver
Remi Passanello
시장 면도기   마켓 스캘퍼 이 표시기는 RPTrade Pro 솔루션 시스템의 일부입니다. Market Scalper는 Price Action, Dynamic Support 및 Resistance를 사용하는 일일 추세 지표입니다. 누구나 사용할 수 있도록 설계되었으며 거래의 절대 초보자도 사용할 수 있습니다. 다시 칠하지 마십시오. 표시는 닫기에서 닫기로 제공됩니다. 단독으로 사용하도록 설계되어 다른 표시기가 필요하지 않습니다. 명확하고 간단한 표시를 제공합니다. 어떻게 작동합니까 Market Shaver는 Dual TimeFrames 시스템을 사용하고 있습니다. 주요 추세는 더 높은 TF가 취하는 반면 더 빠른 것은 거래를 마감하는 데 사용됩니다. 거래는 하나씩 표시되며 동시에 두 거래가 없습니다. Market Shaver는 다음을 나타냅니다. 거래를 할 때 그것을 멈출 때, 이익 또는 손실. 무역 보상 올바른 기말 TF를 설정하는 데 도움이 되는 많은 통계 시장 면도기
M W Pattern Pro
Noiros Tech
4.14 (7)
M & W Pattern Pro is an advanced scanner for M and W patters , it uses extra filters to ensure scanned patterns are profitable. The indicator can be used with all symbols and time frames. The indicator is a non repaint indicator with accurate statistics calculations. To use , simply scan the most profitable pair using the statistics dashboard accuracy , then enter trades on signal arrow and exit at the TP and SL levels. STATISTICS : Accuracy 1 : This is the percentage of the times price hits TP
For sure, this indicator has become very popular amongst traders. Through coding this indicator will give you the most accurate levels possible for your trading analysis. We have also added in the ability for you to receive alerts when the price breaks above or below a Support or Resistance lines! HOW TO USE The red rectangles represent your resistance/supply zone. The green rectangles represent your support/demand zone.  BONUS FEATURES We coded this indicator with the ability to switch between
QuantumEdge Trader
Hossam Ali Ahmed Ali
QuantumEdge Trader v1.0 AI-Powered Precision Signals for Serious Traders QuantumEdge Trader is a smart and reliable indicator that delivers accurate BUY and SELL signals using advanced market analysis and trend detection. Designed for M1 to M60 timeframes, it's ideal for scalping and intraday strategies. --- Key Features: No Repaint – Signals never change after appearing Smart trend filters to reduce noise Adjustable sensitivity and alerts Perfect for XAUUSD, EURUSD, and m
Market Profile 3
Hussien Abdeltwab Hussien Ryad
3 (2)
Market Profile 3 MetaTrader 4 indicator  — is a classic Market Profile implementation that can show the price density over time, outlining the most important price levels, value area, and control value of a given trading session. This indicator can be attached to timeframes between M1 and D1 and will show the Market Profile for daily, weekly, monthly, or even intraday sessions. Lower timeframes offer higher precision. Higher timeframes are recommended for better visibility. It is also possible t
FREE
PZ Harmonacci Patterns
PZ TRADING SLU
3.17 (6)
Trade smarter, not harder: Empower your trading with Harmonacci Patterns This is arguably the most complete harmonic price formation auto-recognition indicator you can find for the MetaTrader Platform. It detects 19 different patterns, takes fibonacci projections as seriously as you do, displays the Potential Reversal Zone (PRZ) and finds suitable stop-loss and take-profit levels. [ Installation Guide | Update Guide | Troubleshooting | FAQ | All Products ] It detects 19 different harmonic pric
ADX Shark Scalper
Maxwell Ndzoyiya
ADX Shark Scalper – The Ultimate Hybrid Indicator for Precision Scalping Dive into the markets with the ADX Shark Scalper , a powerful and versatile tool designed for traders who seek precision in every trade. This cutting-edge indicator seamlessly combines multiple advanced technical signals into one streamlined system, allowing you to spot good buy and sell opportunities with ease. At its core, the ADX Shark Scalper leverages the power of trend and momentum detection through the integration of
Night ghost
Dmitriy Kashevich
Night Ghost - Arrow indicator for binary options. This is a reliable assistant to you in the future! - No redrawing on the chart -Works great on EUR/USD currency pairs! -Indicator accuracy up to 90% (Especially at night) -No long setup required (Perfectly set up for Binary Options) - Not late signals - The appearance of a signal on the current candle -Perfect for M1 period (No More!) - Eye-friendly candle color (Red and Blue) -Installed Alert Working with it: - Blue arrow shows signa
AW Candle Patterns MT4
AW Trading Software Limited
AW 양초 패턴 표시기는 강력한 양초 패턴 스캐너와 결합된 고급 추세 표시기의 조합입니다. 가장 신뢰할 수 있는 30개의 촛대 패턴을 인식하고 강조 표시하는 데 유용한 도구입니다. 또한 색상 막대를 기반으로 하는 현재 추세 분석기입니다.       크기를 조정하고 위치를 지정할 수 있는 플러그인 다중 시간 프레임 추세 패널. 트렌드 필터링에 따라 패턴 표시를 조정하는 고유한 기능. 장점: 캔들 패턴을 쉽게 식별 결과를 다시 그리지 않습니다 내장된 다중 시간 추세 패널 비활성화된 패턴 유형(1, 2, 3 촛불) 패턴 표시 시 트렌드 필터링 조정 MT5 version - >   HERE   / Instructions and description  -> HERE 표시된 패턴 목록: 망치 패턴 핀 업 / 핀 다운 약세 하라미 / 강세 하라미 Bearish Harami Cross / Bullish Harami Cross 피벗 포인트 반전 업 / 피벗 포인트 반전 다운 더 높은 종가와 함께 낮
이 제품의 구매자들이 또한 구매함
Miraculous Indicator – Gann Square of Nine 기반 100% 비리페인트 Forex 및 바이너리 도구 이 영상은 Miraculous Indicator 를 소개합니다. 이 지표는 Forex 및 바이너리 옵션 트레이더를 위해 특별히 개발된 매우 정확하고 강력한 트레이딩 도구입니다. 이 지표가 독특한 이유는 전설적인 **Gann Square of Nine(Gann 9의 사각형)**과 **Gann's Law of Vibration(Gann 진동의 법칙)**에 기반을 두고 있기 때문입니다. 이는 현대 트레이딩에서 가장 정밀한 예측 도구 중 하나로 손꼽힙니다. Miraculous Indicator는 완전히 비리페인트(non-repaint) 됩니다. 즉, 캔들이 마감된 후에도 신호가 변경되거나 사라지지 않습니다. 보이는 것이 곧 결과입니다. 이는 트레이더가 자신감을 가지고 거래에 진입하고 청산할 수 있는 신뢰할 수 있고 일관된 기반을 제공합니다. 주요 특징: Gann
현재 20% 할인 ! 초보자 또는 전문가 트레이더를 위한 최고의 솔루션! 이 대시보드 소프트웨어는 28개의 통화 쌍에서 작동합니다. 2가지 주요 지표(Advanced Currency Strength 28 및 Advanced Currency Impulse)를 기반으로 합니다. 전체 Forex 시장에 대한 훌륭한 개요를 제공합니다. 고급 통화 강도 값, 통화 이동 속도 및 모든(9) 시간대의 28 Forex 쌍에 대한 신호를 보여줍니다. 추세 및/또는 스캘핑 기회를 정확히 파악하기 위해 차트의 단일 지표를 사용하여 전체 시장을 볼 수 있을 때 거래가 어떻게 개선될지 상상해 보십시오! 잠재적인 거래를 식별하고 확인하면서 강력한 통화와 약한 통화를 더욱 쉽게 식별할 수 있도록 이 지표에 기능을 내장했습니다. 이 표시기는 통화의 강세 또는 약세가 증가 또는 감소하는지 여부와 모든 시간대에서 수행되는 방식을 그래픽으로 보여줍니다. 추가된 새로운 기능은 현재 시장 조건 변화에 적응하는
F-16 비행기 지표를 소개합니다. 이것은 귀하의 거래 경험을 혁신하도록 설계된 최첨단 MT4 도구입니다. F-16 전투기의 비할 데 없는 속도와 정밀성에 영감을 받아이 지표는 고급 알고리즘과 최첨단 기술을 결합하여 금융 시장에서 압도적인 성능을 제공합니다. F-16 비행기 지표를 사용하면 실시간 분석을 제공하고 매우 정확한 거래 신호를 생성하여 경쟁을 앞서갈 수 있습니다. 다양한 자산 클래스에서 수익 기회를 식별하는 데 필요한 동적 기능을 갖추고 있어 확신을 가지고 정보에 근거한 결정을 내릴 수 있습니다. 사용자 친화적인 인터페이스로 구성된 F-16 비행기 지표는 인기있는 MetaTrader 4 플랫폼과 완벽하게 통합되어 원활하고 효율적인 거래 과정을 보장합니다. 초보자 트레이더든 경험 많은 전문가든 이 지표를 쉽게 사용자 정의하여 고유한 거래 스타일과 선호도에 맞출 수 있습니다. F-16 비행기 지표의 강력함을 경험해 보세요. 이 지표는 시장 트렌드를 정확하고 민첩하게 탐색하며
Dynamic Forex28 Navigator
Bernhard Schweigert
4.43 (7)
Dynamic Forex28 Navigator - 차세대 외환 거래 도구. 현재 49% 할인. Dynamic Forex28 Navigator는 오랫동안 인기 있는 지표의 진화형으로, 세 가지의 힘을 하나로 결합했습니다. 고급 통화 Strength28 지표(695개 리뷰) + 고급 통화 IMPULSE with ALERT(520개 리뷰) + CS28 콤보 신호(보너스). 지표에 대한 자세한 정보 https://www.mql5.com/en/blogs/post/758844 차세대 Strength 지표는 무엇을 제공합니까?  원래 지표에서 좋아했던 모든 것이 새로운 기능과 더 높은 정확도로 강화되었습니다. 주요 기능: 독점적인 통화 Strength 공식.  모든 시간대에 걸쳐 부드럽고 정확한 강도선. 추세와 정확한 진입을 식별하는 데 이상적입니다. 역동적인 시장 피보나치 수준(시장 피보나치).  이 지표에만 있는 고유한 기능. 가격 차트가 아닌 통화 강도에 피보나치가 적용됩니다.
Shogun Trade
Yuki Miyake
5 (1)
SHOGUN Trade [Concept: Command the Market Structure] To win a war, one must see the entire battlefield, not just the skirmishes. SHOGUN Trade elevates your perspective from a reactive foot soldier to a strategic "Commander." By synchronizing analysis across 7 timeframes and identifying the maturity of trends, it allows you to govern your trades with the authority and patience of a "Shogun," entering the market only when the structural advantage is undeniable. 5 Strategic Benefits of Installi
Supply and Demand Dashboard PRO
Bernhard Schweigert
4.8 (20)
현재 20% 할인! 이 대시보드는 여러 기호와 최대 9개의 타임프레임에서 작동하는 매우 강력한 소프트웨어입니다. 주요 지표(최상의 리뷰: 고급 공급 수요)를 기반으로 합니다.   Advanced Supply Demand 대시보드는 훌륭한 개요를 제공합니다. 다음과 같이 표시됩니다.  영역 강도 등급을 포함하여 필터링된 공급 및 수요 값, 영역에 대한/및 영역 내 Pips 거리, 중첩된 영역을 강조 표시하고 모든 (9) 시간 프레임에서 선택한 기호에 대해 4가지 종류의 경고를 제공합니다. 그것은 당신의 개인적인 필요에 맞게 고도로 구성 가능합니다! 당신의 혜택! 모든 트레이더에게 가장 중요한 질문: 시장에 진입하기에 가장 좋은 수준은 무엇입니까? 최고의 성공 기회와 위험/보상을 얻으려면 강력한 공급/수요 영역 내 또는 그 근처에서 거래를 시작하십시오. 손절매를 위한 최적의 장소는 어디입니까? 가장 안전하려면 강력한 수요/공급 구역 아래/위에 정류장을 두십시오.
BinaryIndicator
Andrey Spiridonov
BinaryIndicator is a highly accurate indicator for trading binary options. It shows excellent results in scalping. This indicator is based in multifactor analysis of trend indicators, as well as confirmation oscillators, which in the end gives an increased accuracy of signals. Advantages of the indicator Increased accuracy of signals. Excellent results when trading binary options with a short expiration time from M30 to M1 . It works on any timeframes. Works with any trade symbols. Parameters
이 지표는 실제 거래에 완벽한 자동 파동 분석 지표입니다! 사례... 참고:   웨이브 그레이딩에 서양식 이름을 사용하는 데 익숙하지 않습니다. Tang Lun(Tang Zhong Shuo Zen)의 명명 규칙의 영향으로 기본 웨이브를   펜   으로 명명하고 2차 웨이브 밴드를   세그먼트   로 명명했습니다. 동시에, 세그먼트에는 추세 방향이 있습니다.   주요 추세 세그먼트에는   이름이 지정되지만(이 이름 지정 방법은 향후 노트에서 사용됩니다. 먼저 말씀드리겠습니다.) 알고리즘은 굴곡 이론과 거의 관련이 없으므로 그렇게 해서는 안 됩니다. 이는 나의 시장 분석을   통해 요약된 끊임없이 변화하고 복잡한 운영 규칙을   반영합니다. 밴드는 더 이상 사람마다 다르지 않도록 표준화되고 정의되었습니다. 인위적인 간섭의 드로잉 방법은 시장 진입을 엄격하게 분석하는 데 핵심적인 역할을 합니다. 이 지표를 사용하는 것은 거래 인터페이스의 미학을 개선하고 원래의 K-line 거래를
Title: BBMA Structure Guide - BBMA Structure Guide Description: BBMA Structure Guide is a specialized MQL4 indicator designed to help traders understand the journey of BBMA structure more easily and efficiently. BBMA, or "Bollinger Bands Moving Average," is known for its motto "One Step Ahead," highlighting the importance of understanding market structure in depth. With BBMA Structure Guide, you can quickly identify the underlying market structure patterns that drive price movements. This wil
Meravith
Ivan Stefanov
5 (1)
이 인디케이터는 각 지점에서 볼륨을 분석하고 해당 볼륨에 대한 시장의 피로 레벨을 계산합니다. 이 인디케이터는 세 개의 라인으로 구성됩니다: 강세 볼륨 피로 라인 약세 볼륨 피로 라인 시장 추세를 나타내는 라인. 이 라인은 시장이 강세인지 약세인지에 따라 색이 변합니다. 원하는 시작 지점에서 시장을 분석할 수 있습니다. 볼륨 피로 라인에 도달하면 다음 분석을 시작할 새 지점을 식별하세요. 트렌드와 수정 모두 분석할 수 있습니다. 좋은 접근 방법은 트렌드 라인에 도달하거나 고점 또는 저점에 도달할 때마다 인디케이터를 이동시키는 것입니다. 트렌드 라인과 볼륨 피로 라인 간의 거리가 클수록 해당 방향의 볼륨이 더 큽니다. 트렌드 라인은 주문을 열기 위한 장소로 사용할 수 있으며, 피로 라인은 수익을 얻는 데 사용됩니다. 이 시스템은 정말 독특하지만 매우 직관적입니다. 시장에는 비슷한 제품이 없습니다. 사용에 제한이 없습니다. 모든 시장과 모든 시간 프레임에서 적용할 수 있습니다. 중요:
Golden Gendut
Anthonius Soruh
5 (1)
Gendel Gendut is Binary Option Indicator From @realTatino Trade with expaired time Pairs : All Forex Pair Time Frame : M5 only Trade Time All Time Alert : Alert Message, Alert Email, Alerts Push Buffer : 4 Buffer (0,2 (Buy) || 1,3 (Sell) Broker Suitable : All Broker Binary With Forex Pair Auto Trade : Yes Repaint : NO Delay : NO Other Binary Indicator : https://www.mql5.com/en/market/product/70915 https://www.mql5.com/en/market/product/71054 https://www.mql5.com/en/market/product/57755 etc IND
IQ Gold Gann Levels
INTRAQUOTES
5 (4)
Presenting one-of-a-kind Gann Indicator for XAUUSD IQ Gold Gann Levels is a non-repainting, precision tool designed exclusively for XAUUSD/Gold intraday trading. It uses W.D. Gann’s square root method to plot real-time support and resistance levels, helping traders spot high-probability entries with confidence and clarity. William Delbert Gann (W.D. Gann) was an exceptional market analyst whose trading technique was based on a complex blend of mathematics, geometry, astrology, and ancient calcul
POWR Rise Coming
Trade Indicators LLC
This indicator is SO SIMPLE… when the green Rise Coming arrow appears, a price drop may be on the way! Plain and easy profits! As you receive more than one 'Rise Coming' text signal in a downtrend, it means momentum is building larger for a bull run. HOW TO USE 1. When the green "Rise Coming" text appears, a price jump may be on the way! This indicator Never Repaints! To get the best setting it's a matter of tweaking the indicator until it gives you the best results. Our recommendation, and what
Buy Sell Arrow Swing MT4
Sahib Ul Ahsan
5 (1)
Looking for a powerful yet lightweight swing detector that accurately identifies market structure turning points? Want clear, reliable buy and sell signals that work across any timeframe and any instrument? Buy Sell Arrow MT Swing is built exactly for that — precision swing detection made simple and effective. This indicator identifies Higher Highs (HH) , Higher Lows (HL) , Lower Highs (LH) , and Lower Lows (LL) with remarkable clarity. It is designed to help traders easily visualize market str
Introduction to Fractal Pattern Scanner Fractal Indicator refers to the technical indicator that makes use of the fractal geometry found in the financial market. Fractal Pattern Scanner is the advanced Fractal Indicator that brings the latest trading technology after the extensive research and development work in the fractal geometry in the financial market. The most important feature in Fractal Pattern Scanner is the ability to measure the turning point probability as well as the trend probabi
Dynamic Scalper System
Vitalyi Belyh
5 (1)
" Dynamic Scalper System " 지표는 추세 파동 내에서 스캘핑 방식으로 거래하도록 설계되었습니다. 주요 통화쌍 및 금에서 테스트되었으며, 다른 거래 상품과의 호환성이 가능합니다. 추가적인 가격 변동 지원을 통해 추세에 따라 단기 포지션 진입 신호를 제공합니다. 지표의 원리 큰 화살표는 추세 방향을 결정합니다. 작은 화살표 형태의 스캘핑 신호를 생성하는 알고리즘은 추세 파동 내에서 작동합니다. 빨간색 화살표는 상승 방향을, 파란색 화살표는 하락 방향을 나타냅니다. 민감한 가격 변동선은 추세 방향으로 그려지며, 작은 화살표의 신호와 함께 작용합니다. 신호는 다음과 같이 작동합니다. 적절한 시점에 선이 나타나면 진입 신호가 형성되고, 선이 있는 동안 미결제 포지션을 유지하며, 완료되면 거래를 종료합니다. 권장되는 작업 시간대는 M1~H4입니다. 화살표는 현재 캔들에 형성되며, 다음 캔들이 이미 시작되었더라도 이전 캔들의 화살표는 다시 그려지지 않습니다. 입력 매개
The Nihilist 5.0 Indicator includes Forexalien and Nihilist Easy Trend trading strategies and systems. It is composed of an MTF Dashboard where you can analyze the different input possibilities of each strategy at a glance. It has an alert system with different types of configurable filters. You can also configure which TF you want to be notified on your Metatrader 4 platform and Mobile application The indicator has the option to view how could be a TP and SL by using ATR or fixed points, even w
RelicusRoad Pro
Relicus LLC
4.63 (106)
훌륭한 백테스트 , 환상적인 숫자로 증명된 실계좌 성능 , 그리고 온갖 통계 를 가진 트레이딩 지표를 얼마나 많이 구매했지만, 사용 후에 결국 계좌를 날려버린 적이 있나요? 신호 자체만으로는 신뢰할 수 없습니다. 애초에 그 신호가 왜 나타났는지 알아야 하며, 이것이 바로 RelicusRoad Pro가 가장 잘하는 일입니다! 사용자 설명서 + 전략 + 교육 비디오 + VIP 접근 권한이 있는 비공개 그룹 + 모바일 버전 사용 가능 시장을 바라보는 새로운 방법 RelicusRoad는 외환, 선물, 암호화폐, 주식 및 지수를 위한 세계에서 가장 강력하고 최고의 트레이딩 지표 이며, 트레이더가 계좌를 성장 시키는 데 필요한 모든 정보와 도구를 제공합니다. 저희는 초보자 부터 고급 트레이더까지 모든 트레이더가 성공 할 수 있도록 기술적 분석 과 트레이딩 계획 을 제공합니다. 이것은 미래 시장을 예측 하기에 충분한 정보를 제공하는 핵심 트레이딩 지표 입니다. 저희는 차트에 여러 다른 지표
The Hurricane Indicator
Paul Nicholas Clevett
5 (1)
Currently switched to the 4 hour chart - but use other time frames for confirmation. :-)  I change my main time frame based on the market movement at the time. The Hurricane Forex Indicator is a multi time frame indicator that includes such things as Trade Notifications, Trade Calculator, Momentum Indicator, risk reward and much more. We have a free Trade room for our users as well. Please check out the video for full details of how this indicator works as it has over 15 years worth of developme
What indicator do you look at most on your MT4 charts? Is it the Moving Average? I d o not believe that the default grid lines on MT4 charts—which you likely see hundreds or thousands of times—are designed with the intent of helping the user win. This is why MT4 users apply various indicators and go through trial and error. Because it is a chart you look at every day, it must present reliable information that we humans can recognize intuitively. This indicator was born from a single core concep
OrderFlow Absorption – MT4용 전문 델타 & 흡수 신호 인디케이터 OrderFlow Absorption으로 진정한 오더플로우 분석의 힘을 경험하세요. MetaTrader 4를 위한 궁극의 델타 히스토그램 및 흡수 신호 인디케이터입니다. 가격 움직임의 이면에서 실제로 무슨 일이 일어나는지 알고 싶은 트레이더를 위해 설계된 이 도구는, 시장을 움직이는 숨겨진 매수/매도 압력과 흡수 이벤트를 드러냅니다. 주요 기능 델타 히스토그램 시각화:   매수와 매도 압력을 색상별 히스토그램으로 즉시 확인할 수 있습니다. 흡수 신호 감지:   고급 로직으로 강세 및 약세 흡수 이벤트를 식별하여 반전 신호를 미리 알려줍니다. 차트 마커:   흡수 신호가 차트에 직접 표시되어 시각적으로 쉽게 확인할 수 있습니다. 팝업 알림:   새로운 흡수 신호가 발생하면 실시간으로 알림을 받을 수 있습니다. 사용자 지정 임계값:   약한 신호는 필터링하고, 확률이 높은 기회에 집중할 수 있습니다.
NAM Order Blocks
NAM TECH GROUP, CORP.
3.67 (3)
MT4 Multi-timeframe Order Blocks detection indicator. Features - Fully customizable on chart control panel, provides complete interaction. - Hide and show control panel wherever you want. - Detect OBs on multiple timeframes. - Select OBs quantity to display. - Different OBs user interface. - Different filters on OBs. - OB proximity alert. - ADR High and Low lines. - Notification service (Screen alerts | Push notifications). Summary Order block is a market behavior that indicates order collection
The BB Reversal Arrows technical trading system has been developed to predict reverse points for making retail decisions. The current market situation is analyzed by the indicator and structured for several criteria: the expectation of reversal moments, potential turning points, purchase and sale signals. The indicator does not contain excess information, has a visual understandable interface, allowing traders to make reasonable decisions. All arrows appear to close the candle, without redrawin
Smart Price Action Concepts
Issam Kassas
4.75 (12)
우선적으로, 이 거래 도구는 전문적인 거래에 이상적인 비-다시 그리기 및 지연되지 않는 지표입니다.  온라인 강좌, 사용자 매뉴얼 및 데모. 스마트 가격 액션 컨셉트 인디케이터는 신규 및 경험 많은 트레이더 모두에게 매우 강력한 도구입니다. Inner Circle Trader Analysis 및 Smart Money Concepts Trading Strategies와 같은 고급 거래 아이디어를 결합하여 20가지 이상의 유용한 지표를 하나로 결합합니다. 이 인디케이터는 스마트 머니 컨셉트에 중점을 두어 대형 기관의 거래 방식을 제공하고 이동을 예측하는 데 도움을 줍니다.  특히 유동성 분석에 뛰어나 기관이 어떻게 거래하는지 이해하는 데 도움을 줍니다. 시장 트렌드를 예측하고 가격 변동을 신중하게 분석하는 데 탁월합니다. 귀하의 거래를 기관 전략에 맞추어 시장의 동향에 대해 더 정확한 예측을 할 수 있습니다. 이 인디케이터는 시장 구조를 분석하고 중요한 주문 블록을 식별하고 다양한
Introducing the Delta Volume Profile Indicator - Unleash the Power of Institutional Precision!  Technical Indicator: Are you ready to trade like the pros? The Delta Volume Profile Indicator is no ordinary tool. It’s a high-precision, cutting-edge indicator that puts the power of institutional-grade trading in your hands. This unique indicator analyses delta volume distribution in real-time, revealing the market's hidden buy/sell imbalances that the biggest financial institutions rely on to antic
Elliott Wave Trend MT4
Young Ho Seo
4 (7)
Elliott Wave Trend was designed for the scientific wave counting. This tool focuses to get rid of the vagueness of the classic Elliott Wave Counting using the guideline from the template and pattern approach. In doing so, firstly Elliott Wave Trend offers the template for your wave counting. Secondly, it offers Wave Structural Score to assist to identify accurate wave formation. It offers both impulse wave Structural Score and corrective wave Structure Score. Structural Score is the rating to sh
WeSpread
Anchor Trading S.R.L.S.
The We-Spread mt4 indicator is a spread trading tools and it is suitable for those who want to study the markets with a different approach to the contents that are normally available in online trading bookstores. I think the Spread Trading strategy is one of the best I've ever used in the last few years. This is a unique indicator for spread trading because allow you to study till 3 spreads in one time. What is Spread Trading on forex The Spread Trading is the study of the strength of 2 currency
The Super Arrow Indicator provides non-repainting buy and sell signals with exceptional accuracy. Key Features No repainting – confirmed signals remain fixed Clear visual arrows: green for buy, red for sell Real-time alerts via pop-up, sound, and optional email Clean chart view with no unnecessary clutter Works on all markets: Forex, gold, oil, indices, crypto Adjustable Parameters TimeFrame Default: "current time frame" Function: Sets the time frame for indicator calculation Options: Can be set
Supreme Commander
Ramon Sobrevals Arce
4.13 (8)
The indicator of the indicators. The Most Powerful Technique to Determine Forex Trend Strength in 2023. We have perfected Supreme Commander that it calculates an average of the selected indicators (up to 16) and the selected timeframe (all) with the result of a single trend that indicates the potential of buying and selling.  It includes the following indicators: Accelerator/Decelerator oscillator Average Directional Movement Index Awesome oscillator; Bulls and Bears  Commodity Channel Index; De
"Dragon's Tail" is an integrated trading system, not just an indicator. This system analyzes each candle on a minute-by-minute basis, which is particularly effective in high market volatility conditions. The "Dragon's Tail" system identifies key market moments referred to as "bull and bear battles". Based on these "battles", the system gives trade direction recommendations. In the case of an arrow appearing on the chart, this signals the possibility of opening two trades in the indicated directi
제작자의 제품 더 보기
[V 1.00] MTF NRPA 5 이동 평균 RTD가 출시되었습니다! 비 다시 그리기 화살표 실시간 대시보드. 최고의 이동 평균 지표를 찾고 있다면 올바른 페이지에 있습니다. 일반적으로 사람들은 두 이동 평균의 교차점(교차)이 다음 가격 추세의 방향을 결정하기 때문에 두 이동 평균을 설정합니다. 빠른 이동 평균이 느린 이동 평균과 교차하고 빠른 > 느린 경우 추세가 상승합니다. 반대로 빠른 이동 평균이 느린 이동 평균과 교차하고 빠른 < 느린 경우 추세가 하락합니다. 두 이동 평균의 단점은 장기적인 추세를 볼 수 없다는 것입니다. 이것이 제가 이 거래 도구를 개발한 이유입니다. 설명 방법은 다음과 같습니다. 이 거래 도구에서는 5개의 이동 평균을 사용합니다. 예, 다섯! 기본적으로 저는 MA 1과 MA 2를 큰 시간 프레임인 H1에 설정했습니다. MA 1과 MA 2의 교차점은 H1 기간에 추세 변화가 있음을 의미합니다. 그런 다음 MA 3 및 MA 4는 현재 시간 프레임(
하나의 창에서 통화 쌍의 여러 시간 프레임을 분석하면 혼란스러울 수 있습니다. 여러 시간 프레임을 분석하려면 신뢰할 수 있는 지표가 필요합니다. 그중 하나는 9TF STOCH RSI를 사용하고 있습니다. 나는 단순하지만 신뢰할 수 있고 단 하나의 지표에서 9개의 시간 프레임을 모두 다루는 코드를 만들기 위해 밤낮으로 노력했습니다. 이 표시기의 몇 가지 장점을 살펴보겠습니다. 다채로운 히스토그램. 각 기간의 곡선 색상은 서로 다릅니다. STOCHASTIC 본선과 신호선의 교차점을 나타내는 화살표. (참고: 나타나는 마지막 화살표는 무시하십시오!) OBOS 레벨 라인. 실시간 9TF 대시보드 모니터. 9TF 대시보드 모니터 계산은 한 시간 프레임에서 다른 시간 프레임으로 변경하더라도 매우 정확합니다. 어떤 곡선이 과매수 수준 위에 있고 과매도 수준 아래에 있는지 모니터링합니다. 메인 STOCH가 신호 STOCH 위에 있는지 또는 그 반대인지 곡선을 모니터링합니다. 메인 STO
Analyzing multiple time frames of a currency pair in one window can make you confused. To analyze multiple time frames, you need reliable indicators. One of them is using 9TF RSI MA . I've been working day and night to create code that is simple but reliable and covers all nine time frames in just one indicator .  Let's look at some of the advantages of this indicator: Colorful histogram . The color of the curve in each timeframe is different from one another.  Arrows indicating the crossing of
하나의 창에서 통화 쌍의 여러 시간 프레임을 분석하면 혼란스러울 수 있습니다. 여러 시간 프레임을 분석하려면 신뢰할 수 있는 지표가 필요합니다. 그중 하나는 9TF Double RSI Double MA를 사용하고 있습니다. 나는 단순하지만 신뢰할 수 있고 단 하나의 지표에서 9개의 시간 프레임을 모두 다루는 코드를 만들기 위해 밤낮으로 노력했습니다. 이 표시기의 몇 가지 장점을 살펴보겠습니다. 이중 RSI, 즉 RSI는 더 빠르고 RSI는 더 느립니다. 이중 MA, 즉 MA는 더 빠르고 MA는 더 느립니다. 10 색 구성표. 각 기간의 곡선 색상은 서로 다릅니다. RSI의 OBOS 레벨 라인. 실시간 9TF 대시보드 모니터. 9TF 대시보드 모니터 계산은 한 시간 프레임에서 다른 시간 프레임으로 변경하더라도 매우 정확합니다. 어떤 RSI 곡선이 과매수 수준 위에 있고 과매도 수준 아래에 있는지 모니터링합니다. MA 빠른 라인이 MA 느린 라인 위에 있는지 또는 그 반대인지
하나의 창에서 통화 쌍의 여러 시간 프레임을 분석하면 혼란스러울 수 있습니다. 여러 시간 프레임을 분석하려면 신뢰할 수 있는 지표가 필요합니다. 그중 하나는 9TF Double CCI Double MA를 사용하고 있습니다. 나는 단순하지만 신뢰할 수 있고 단 하나의 지표에서 9개의 시간 프레임을 모두 다루는 코드를 만들기 위해 밤낮으로 노력했습니다. 이 표시기의 몇 가지 장점을 살펴보겠습니다. 이중 CCI, 즉 CCI는 더 빠르고 CCI는 더 느립니다. 이중 MA, 즉 MA는 더 빠르고 MA는 더 느립니다. 10 색 구성표. 각 기간의 곡선 색상은 서로 다릅니다. CCI의 OBOS 레벨 라인. 실시간 9TF 대시보드 모니터. 9TF 대시보드 모니터 계산은 한 시간 프레임에서 다른 시간 프레임으로 변경하더라도 매우 정확합니다. 어떤 CCI 곡선이 과매수 수준 위에 있고 과매도 수준 아래에 있는지 모니터링합니다. MA 빠른 라인이 MA 느린 라인 위에 있는지 또는 그 반대인지
정확한 CCI 지표를 사용할 수 있습니다. 대시보드 트렌드 바 스마트 레벨 9TF Double CCI. 이중 CCI, 즉 빠른 CCI 및 느린 CCI 두 번째 CCI가 필요한 이유는 무엇입니까? 추가 지표를 사용하면 라이브 거래에서 더 많은 확신을 얻을 수 있습니다. 9TF 빠른 CCI 곡선 9TF 느린 CCI 곡선 9TF 실시간 CCI 각도 9TF 실시간 CCI 값 9TF 실시간 CCI 방향/위상 9TF 트렌드 바 추세 막대 계산의 새로운 알고리즘 켜기/끄기 버튼. 한 번의 클릭으로 표시기를 표시하거나 숨길 때 매우 유용합니다. 실시간 9TF 대시보드 모니터 추세 막대만 표시하는 기능 CCI 곡선만 표시하는 기능 대시보드만 표시하는 기능 표시할 CCI 곡선을 선택하는 기능 추세의 화살표 유형 선택 기능 obos 선 스타일을 선택하는 기능 범례 표시/숨기기 기능 막대 수를 늘리거나 줄이는 기능 색 구성표 수준을 선택하는 기능 최대 10개의 대시보드 추세 막대 색 구성표를 선택하는
정확한 RSI 지표를 사용할 수 있습니다. 대시보드 트렌드 바 스마트 레벨 9TF Double RSI. 이중 RSI, 즉 빠른 RSI 및 느린 RSI 두 번째 RSI가 필요한 이유는 무엇입니까? 추가 지표를 사용하면 라이브 거래에서 더 많은 확신을 얻을 수 있습니다. 9TF 빠른 RSI 곡선 9TF 느린 RSI 곡선 9TF 실시간 RSI 각도 9TF 실시간 RSI 값 9TF 실시간 RSI 방향/위상 9TF 트렌드 바 추세 막대 계산의 새로운 알고리즘 켜기/끄기 버튼. 한 번의 클릭으로 표시기를 표시하거나 숨길 때 매우 유용합니다. 실시간 9TF 대시보드 모니터 추세 막대만 표시하는 기능 RSI 곡선만 표시하는 기능 대시보드만 표시하는 기능 표시할 RSI 곡선을 선택하는 기능 추세의 화살표 유형 선택 기능 obos 선 스타일을 선택하는 기능 범례 표시/숨기기 기능 막대 수를 늘리거나 줄이는 기능 색 구성표 수준을 선택하는 기능 최대 10개의 대시보드 추세 막대 색 구성표를 선택하는
정확한 MACD 지표를 사용할 수 있습니다. 대시보드 트렌드 바 스마트 레벨 9TF Double MACD. 이중 MACD, 즉 Fast(MACD 1) 및 Slow(MACD 2) 두 번째 MACD가 필요한 이유는 무엇입니까? 추가 지표를 사용하면 라이브 거래에서 더 많은 확신을 얻을 수 있습니다. 9TF 빠른 MACD 1 곡선 9TF 느린 MACD 2 곡선 9TF 실시간 MACD 각도 9TF 실시간 MACD 값 9TF 실시간 MACD 방향정확한 MACD 지표를 사용할 수 있습니다. 대시보드 트렌드 바 스마트 레벨 9TF Double MACD. 이중 MACD, 즉 Fast(MACD 1) 및 Slow(MACD 2) 두 번째 MACD가 필요한 이유는 무엇입니까? 추가 지표를 사용하면 라이브 거래에서 더 많은 확신을 얻을 수 있습니다. 9TF 빠른 MACD 1 곡선 9TF 느린 MACD 2 곡선 9TF 실시간 MACD 각도 9TF 실시간 MACD 값 9TF 실시간 MACD 방향/위상 9
정확한 스토캐스틱 지표를 사용할 수 있습니다. 대시보드 트렌드 바 스마트 레벨 9TF 듀얼 스토캐스틱. 이중 스토캐스틱, 즉 빠른 스토캐스틱 및 느린 스토캐스틱 두 번째 스토캐스틱이 필요한 이유는 무엇입니까? 추가 지표를 사용하면 라이브 거래에서 더 많은 확신을 얻을 수 있습니다. 9TF 빠른 확률 곡선 9TF 느린 확률 곡선 9TF 실시간 확률 각도 9TF 실시간 스토캐스틱 값 9TF 실시간 확률적 방향/위상 9TF 트렌드 바 추세 막대 계산의 새로운 알고리즘 켜기/끄기 버튼. 한 번의 클릭으로 표시기를 표시하거나 숨기는 데 매우 유용합니다. 실시간 9TF 대시보드 모니터 추세 막대만 표시하는 기능 확률적 곡선만 표시하는 기능 대시보드만 표시하는 기능 표시할 확률 곡선을 선택하는 기능 추세의 화살표 유형 선택 기능 obos 선 스타일을 선택하는 기능 범례 표시/숨기기 기능 막대 수를 늘리거나 줄이는 기능 색 구성표 수준을 선택하는 기능 최대 10개의 대시보드 추세 막대 색 구성
하나의 지표만 사용하여 거래를 자주 잃는다면 이 거래 도구를 사용해 보십시오. 이 거래 도구는 하나 이상의 지표를 사용합니다. 나는 RSI 지표만 사용하는 트레이더를 자주 관찰합니다. 시장이 과매도 상태이지만 여전히 하락세이거나, 시장이 과매수 상태이지만 여전히 상승하는 경우가 많습니다. 이러한 이유로 하나 이상의 지표를 사용해야 합니다. 새 버전 V 3.40 MTF PPAAF 소개: 다중 시간 프레임 정확한 가격 동작 화살표 필터링. 이 거래 도구는 다양한 지표를 사용하여 시장 움직임의 방향을 강화합니다. 이 거래 도구에 사용되는 첫 번째 지표는 듀얼 스토캐스틱(Dual Stochastic)입니다. 여기서는 Fast Stochastic과 Slow Stochastic이라는 두 가지 Stochastic을 사용합니다. Fast Stochastic에는 Fast Stochastic 메인 라인과 Fast Stochastic 신호 라인이 있습니다. 마찬가지로 Slow Stochastic에는
Introducing the advanced trading tools of 2023. MTF PPAAF Model S. This is sub window version of my best trading tool : MTF Precise Price Action Arrow Filtered.  Click here to learn more about MTF PPAAF . This trading tool is equipped with various powerful features : MTF = Multi Time Frame = Time Frame can be changed. On/off button. Non Repaint Arrows.  Customizable parameter, color etc.  Can show all time frame (ATF) crossover arrows of fast stochastic main line & fast stochastic signal line (
If you are curious about the position of the stochastic, RSI, CCI curve, whether it is at the OBOS level or not, then this trading tool is for you. Introducing the advanced trading tools of 2024. ATF Trend Following Trend Bar OBOS. This indicator is similar to MTF PPAAF Model S but have two layers.  Click here to learn more about MTF PPAAFS . This trading tool is equipped with various powerful features : MTF = Multi Time Frame = Time Frame can be changed. On/off button. Customizable parameter,
안녕하세요 상인 여러분. 최고의 거래 도구를 소개합니다. MTF PPAAF 모델 T. 다중 시간 프레임 정확한 가격 조치 화살표가 모델 T를 필터링했습니다.  이 거래 도구는 수년간 다양한 거래 도구를 만든 후 최고의 작품입니다. 이 거래 도구가 왜 최고이고 신뢰할 수 있습니까?  1. 이 도구는 6가지 지표를 사용합니다.  이중 CCI = 빠른 CCI x 느린 CCI 듀얼 스토캐스틱 = 빠른 스토캐스틱(빠른 스토캐스틱 주선 x 빠른 스토캐스틱 신호선) 및 느린 스토캐스틱(느린 스토캐스틱 주선 x 느린 스토캐스틱 신호선)  듀얼 MACD = 빠른 MACD(빠른 MACD 메인 라인 x 빠른 MACD 신호 라인) 및 느린 MACD(느린 MACD 메인 라인 x 느린 MACD 신호 라인) 6가지 이동 평균 = MA 1 x MA 2, MA 3 x MA 4 및 MA 5 x MA 6 듀얼 더블 RSI = 빠른 DRSI(빠른 DRSI 메인 라인 x 빠른 DRSI
15 years old, 15 years old, 15 years old. 2024 years ago: ️ What to do next. I want to know what I want to know. Sorry, I don't know what to do. I want to know, I want to know, I want to know. I want to know what I want to know. I want to know what I want to know. H4(단지 M1에서 M30) I'm here. I'm here. I want to know what I want to know. I want to know what I'm saying. I want to know what I want to know. I want to know what I want to know. I want to know what I want to know. I want to
이 거래 도구를 사용하면 15개 시장을 동시에 스캔할 수 있습니다. 2024년 새로운 거래 지표 소개: ️ 대시보드 다중 통화 다중 시간 프레임 이중 CCI. 제가 이 거래 도구를 만든 이유는 최소한 두 가지입니다. 첫째, 하나의 시장만 관찰하는 것이 지루합니다. 둘째, 다른 시장에 진입하는 순간을 놓치고 싶지 않습니다. 그렇기 때문에 동시에 다른 시장 상황도 알고 싶습니다. 이러한 이유로 여러 시장의 상황을 동시에 스캔할 수 있는 스캐너가 필요합니다. 나는 종종 빠른 CCI 라인 > (또는 <=) 느린 CCI 라인이 M1에서 H4(또는 단지 M1에서 M30)까지 시작하는 시장을 찾습니다. 내 분석에 동의하신다면 이것이 바로 귀하가 찾고 있던 거래 지표입니다. 시장 상황이 위의 요구 사항을 충족하는 순간을 놓치지 마십시오. 이것은 많은 훌륭한 기능을 갖춘 확률론적 스캐너 또는 대시보드입니다. 빠른 CCI 라인의 데이터를 표시할 수 있습니다. 느린 CCI 라인의
이 거래 도구를 사용하면 15개 시장을 동시에 스캔할 수 있습니다. 2024년 새로운 거래 지표 소개: ️ 대시보드 다중 통화 다중 시간 프레임 이중 RSI. 제가 이 거래 도구를 만든 이유는 최소한 두 가지입니다. 첫째, 하나의 시장만 관찰하는 것이 지루합니다. 둘째, 다른 시장에 진입하는 순간을 놓치고 싶지 않습니다. 그렇기 때문에 동시에 다른 시장 상황도 알고 싶습니다. 이러한 이유로 여러 시장의 상황을 동시에 스캔할 수 있는 스캐너가 필요합니다. 나는 종종 빠른 RSI 라인 > (또는 <=) 느린 RSI 라인이 M1에서 H4(또는 단지 M1에서 M30)까지 시작하는 시장을 찾습니다. 그리고 M1부터 M30까지 과매도/과매수 상태인 시장을 자주 찾아봅니다. 내 분석에 동의하신다면 이것이 바로 귀하가 찾고 있던 거래 지표입니다. 시장 상황이 위의 요구 사항을 충족하는 순간을 놓치지 마십시오. 이것은 많은 훌륭한 기능을 갖춘 확률론적 스캐너 또는 대시보드입니
Looking for a trading tool based on the CCI indicator that can display crossovers arrows on all time frames? Introducing trading indicator : All Time Frame Double CCI Model T ready to help you achieve daily profits. This tool is created using the intersection of two CCI (Double CCI) indicator lines: the main CCI and the signal CCI. Using this tool makes it easier to observe the real-time dashboard and intersections of multiple timeframes simultaneously. Viewing both higher and lower timeframes
Looking for a trading tool based on the CCI indicator that can display crossovers arrows on all time frames? Introducing trading indicator : All Time Frame Double CCI Model S ready to help you achieve daily profits. This tool is created using the intersection of two CCI (Double CCI) indicator lines: the main CCI and the signal CCI. Using this tool makes it easier to observe the real-time dashboard and intersections of multiple timeframes simultaneously. Viewing both higher and lower timeframes
Looking for a trading tool based on the MACD indicator that can display crossovers arrows on all time frames? Introducing trading indicator : All Time Frame MACD Model T ready to help you achieve daily profits. This tool is created using the intersection of two indicator lines of MACD : the main MACD and the signal MACD. Using this tool makes it easier to observe the real-time dashboard and intersections of multiple timeframes simultaneously. Viewing both higher and lower timeframes simultaneou
Looking for a trading tool based on the MACD indicator that can display crossovers arrows on all time frames? Introducing trading indicator : All Time Frame MACD Model S ready to help you achieve daily profits. This tool is created using the intersection of two indicator lines of MACD : the main MACD and the signal MACD. Using this tool makes it easier to observe the real-time dashboard and intersections of multiple timeframes simultaneously. Viewing both higher and lower timeframes simultaneou
Looking for a trading tool based on the Stochastic indicator that can display crossovers arrows on all time frames? Introducing trading indicator : All Time Frame Stochastic Model T ready to help you achieve daily profits. This tool is created using the intersection of two indicator lines of Stochastic  : the main Stochastic  and the signal Stochastic . Using this tool makes it easier to observe the real-time dashboard and intersections of multiple timeframes simultaneously. Viewing both higher
Looking for a trading tool based on the Stochastic indicator that can display crossovers arrows on all time frames? Introducing trading indicator : All Time Frame Stochastic Model S ready to help you achieve daily profits. This tool is created using the intersection of two indicator lines of Stochastic  : the main Stochastic and the signal Stochastic . Using this tool makes it easier to observe the real-time dashboard and intersections of multiple timeframes simultaneously. Viewing both higher
Looking for a trading tool based on the RSI indicator that can display crossovers arrows on all time frames? Introducing trading indicator : All Time Frame Double RSI Model T ready to help you achieve daily profits. This tool is created using the intersection of two RSI (Double RSI) indicator lines: the main RSI and the signal RSI. Using this tool makes it easier to observe the real-time dashboard and intersections of multiple timeframes simultaneously. Viewing both higher and lower timeframes
Looking for a trading tool based on the RSI indicator that can display crossovers arrows on all time frames? Introducing trading indicator : All Time Frame Double RSI Model S ready to help you achieve daily profits. This tool is created using the intersection of two RSI (Double RSI) indicator lines: the main RSI and the signal RSI. Using this tool makes it easier to observe the real-time dashboard and intersections of multiple timeframes simultaneously. Viewing both higher and lower timeframes
Looking for a trading tool based on the moving average indicator that can display crossovers arrows on all time frames? Introducing trading indicator : All Time Frame Two MA Model T ready to help you achieve daily profits. This tool is created using the intersection of two moving average  indicator lines: the main MA1 and the signal MA2. Using this tool makes it easier to observe the real-time dashboard and intersections of multiple timeframes simultaneously. Viewing both higher and lower timef
Looking for a trading tool based on the moving average indicator that can display crossovers arrows on all time frames? Introducing trading indicator : All Time Frame Two MA Model S ready to help you achieve daily profits. This tool is created using the intersection of two moving average indicator lines: the main MA1 and the signal MA2. Using this tool makes it easier to observe the real-time dashboard and intersections of multiple timeframes simultaneously. Viewing both higher and lower timefr
필터:
Violette
458
Violette 2025.05.21 17:58 
 

It DOES repaint, very disappointed.

I did purchase this because you clearly state on your title and description that your thing does NOT repaint, now you say that it DOES repaint and that it's normal. I call this a scam. By the way, keep your "keep learning" for you, you don't know who i am and if am or not an experienced trader. You refund me please as your claim "non repaint arrow" is wrong, thanks.

Anon Candra N
1552
개발자의 답변 Anon Candra N 2025.05.22 03:15
Before giving a bad rating please read this : As a developer, I can't control what is going on inside the brain of millions of traders (they buy or sell) at any hour throughout the trading day that drive price action through the various time frames all day long. I give you analogy. Very often, developer trading robot (expert advisor) suggest you (or set by algorithm) to use risk reward ratio for example 1:3. This means you can win $30 but risking loss $10. Why? Because of price action. Because of market volatility. So, stop loss hits. That's means the crossover arrow fail to appear. And very often, they also suggest you to use minimum deposit account balance.
Why? Because they set the risk reward ratio inside the algorithm. They can't control what is going on inside the brain of millions of traders. They can't tell you precisely when to buy and when to sell. What I can do as a developer (and also trader) is anticipate whether there's crossover lines or not. This trading indicator is based on technical analysis, i.e crossover of two lines and angle of line. If there is crossover between two lines then the arrows appear and NON REPAINT. But because of price action (market volatility), after several seconds or minutes, if the two lines failed to cross (it's just a test and won't last long) then the arrows disappear. And it must be disappear. Otherwise, the algorithm is wrong. Same logic applied to angle of line. If the angle of line is positive then up arrow appear. Likewise, if the angle of line is negative then down arrow appear. So if you see why arrow M1 repaint? Because of price action (I can't control people mind).
Why arrow M5 repaint? Because of price action. Why arrow M15 repaint? Because of price action. Why arrow M30 repaint? Because of price action. etc. To help you make better decision, this indicator is also equipped with REAL TIME 9TF dashboard monitor. Please monitor patiently such as buy when RSI from M1 to H4 all UP.
And sell when RSI from M1 to H4 all Down. Thank you for your purchase. And keep learning.
리뷰 답변