MTF Non Repaint Arrow Five RSI RTD
- Indicateurs
-
Anon Candra N
 I am a professional trader who has been in the stock market for several years. After making in-depth observations of the stock market, I developed the trading tools that have helped my trading career so far. The good news is, you can have these trading tools on this website.
 - Version: 2.10
- Mise à jour: 9 juillet 2026
- Activations: 20
[V 1.00] MTF NRPA 5 RSI RTD est sorti !
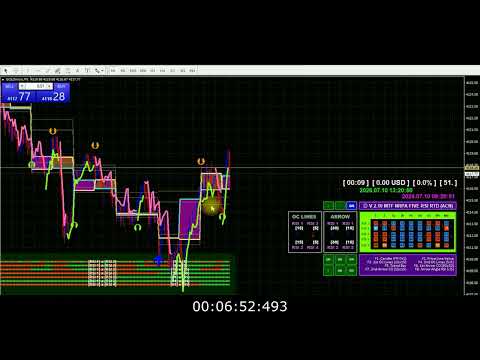
Tableau de bord en temps réel avec flèche non repeinte.
Si vous en avez assez d'utiliser divers indicateurs RSI mais que vous constatez qu'ils sont inexacts, essayez cet outil. Habituellement, les gens n'installent qu'un seul RSI pour déterminer le niveau d'OBOS dans un laps de temps. La mauvaise nouvelle est que vous ne pouvez pas voir les niveaux et les tendances OBOS sur différentes périodes à la fois. C'est pourquoi j'ai développé cet outil de trading.
Voici comment c'est expliqué :
Sur cet outil de trading, j'utilise cinq RSI. Oui, cinq ! Par défaut, je fixe RSI 1 et RSI 2 sur une grande plage horaire, à savoir M30. L'intersection de RSI 1 et RSI 2 signifie qu'il y a un changement de tendance sur la période M30. Ensuite, je règle RSI 3 et RSI 4 sur la (petite) période actuelle, par exemple vous ouvrez un graphique sur M5. L'intersection de RSI 3 et RSI 4 signifie qu'il y a un changement de tendance sur la période actuelle (M5). Ensuite, pour assurer le mouvement de tendance, j'ai installé RSI 5 sur la période la plus élevée (H1). Lorsque RSI 5 franchit le niveau de 50 (vous pouvez définir la période et le niveau OBOS), une flèche apparaît.
Il y a beaucoup de choses étonnantes dans cet outil de trading :
Vous pouvez modifier les cinq délais RSI selon vos souhaits. mieux est le moniteur de tableau de bord 9TF en temps réel des cinq RSI. Il ya 10 schémas de couleurs de tableau de bord à appliquer. deux types de symboles. Symbole rectangle et symbole flèche (haut et bas). Le symbole du rectangle de couleur verte indique que l'angle RSI est positif, ce qui signifie que la tendance est à la hausse. couleur rouge indique que l'angle RSI est négatif, ce qui signifie une tendance à la baisse.vous pouvez observer si RSI 1 est au-dessus ou en dessous de RSI 2 et si RSI 3 est au-dessus ou en dessous de RSI 4. Cela peut être vu par le symbole de flèche pointant vers le haut ou vers le bas. outre, vous pouvez surveiller la valeur RSI de tous les 9TF. Incroyable n'est-ce pas ? Et il ya plus. La fonction de bouton.
C'est vraiment un outil de trading que vous devez avoir.
Dépêchez-vous d'acheter cet outil de trading avant que le prix n'augmente !
Faites des entrées en toute confiance et négociez comme un pro.
Merci.
#rsiindicator #rsitradingstrategy #tradingindicators #tradingforex #tradingtips #bestindicator #doublersi
It DOES repaint, very disappointed.
I did purchase this because you clearly state on your title and description that your thing does NOT repaint, now you say that it DOES repaint and that it's normal. I call this a scam. By the way, keep your "keep learning" for you, you don't know who i am and if am or not an experienced trader. You refund me please as your claim "non repaint arrow" is wrong, thanks.
Why? Because they set the risk reward ratio inside the algorithm. They can't control what is going on inside the brain of millions of traders. They can't tell you precisely when to buy and when to sell. What I can do as a developer (and also trader) is anticipate whether there's crossover lines or not. This trading indicator is based on technical analysis, i.e crossover of two lines and angle of line. If there is crossover between two lines then the arrows appear and NON REPAINT. But because of price action (market volatility), after several seconds or minutes, if the two lines failed to cross (it's just a test and won't last long) then the arrows disappear. And it must be disappear. Otherwise, the algorithm is wrong. Same logic applied to angle of line. If the angle of line is positive then up arrow appear. Likewise, if the angle of line is negative then down arrow appear. So if you see why arrow M1 repaint? Because of price action (I can't control people mind).
Why arrow M5 repaint? Because of price action. Why arrow M15 repaint? Because of price action. Why arrow M30 repaint? Because of price action. etc. To help you make better decision, this indicator is also equipped with REAL TIME 9TF dashboard monitor. Please monitor patiently such as buy when RSI from M1 to H4 all UP.
And sell when RSI from M1 to H4 all Down. Thank you for your purchase. And keep learning.