KT XMaster Formula MT4
- Indicators
-
KEENBASE SOFTWARE SOLUTIONS
 Keenbase Trading develops professional MetaTrader 4 and MetaTrader 5 indicators and Expert Advisors designed to help traders make more informed trading decisions.
 - Version: 1.0
- Activations: 10
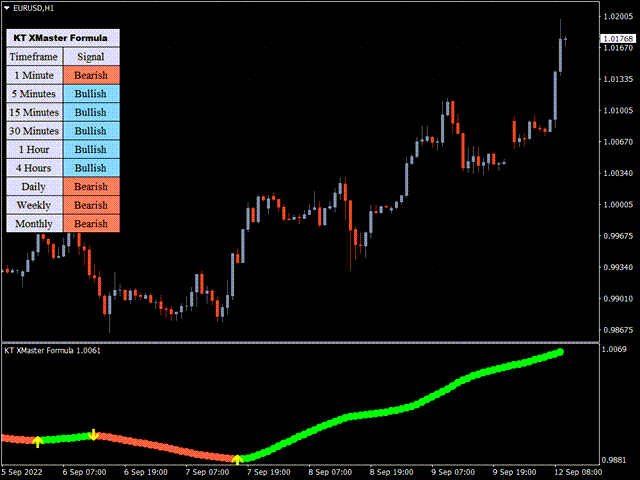
When the market changes direction, price alone does not always make the shift obvious straight away. KT XMaster Formula turns its trend and momentum calculation into a clean dotted line, yellow change arrows, and a multi-timeframe dashboard. You can check the current direction, see where it last changed, and compare that reading with the rest of the market structure on your chart.
The calculation combines moving-average smoothing with RSI and MACD-based information. Instead of stacking several indicators, you get one visual reference that can sit beside a scalping, pullback, or trend-following method.
One line, three clear cues
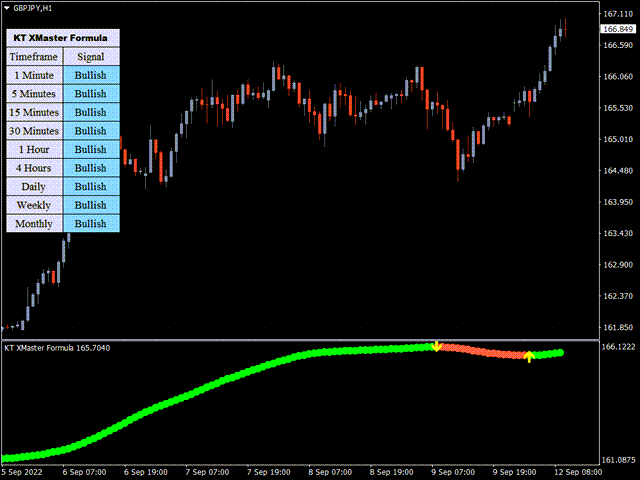
- Green dotted line: the indicator is reading bullish direction.
- Red dotted line: the indicator is reading bearish direction.
- Yellow arrow: the reading has changed from one direction to the other.
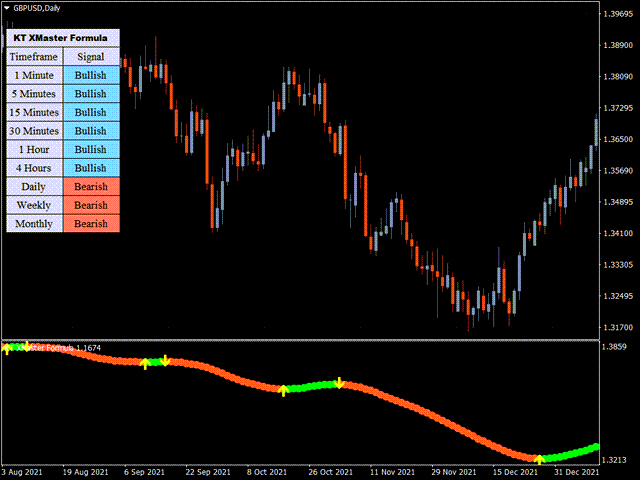
The dashboard shows Bullish or Bearish readings from M1 through MN1. This makes it easy to see whether a fresh chart signal agrees with faster and slower timeframes or appears while the market is still mixed.
Putting the signal into a trading plan
For a long setup, watch for an upward yellow arrow as the line changes from red to green. For a short setup, watch for a downward yellow arrow as the line changes from green to red. You can then judge the signal against your own entry rules, price structure, and preferred trading session.
Some traders use the latest swing low or swing high as a reference for risk placement and monitor the next opposite signal as one possible exit cue. The indicator leaves the final entry, stop, and exit decision with you, so it can fit around different trading styles rather than forcing one fixed approach.
Settings and alerts that stay practical
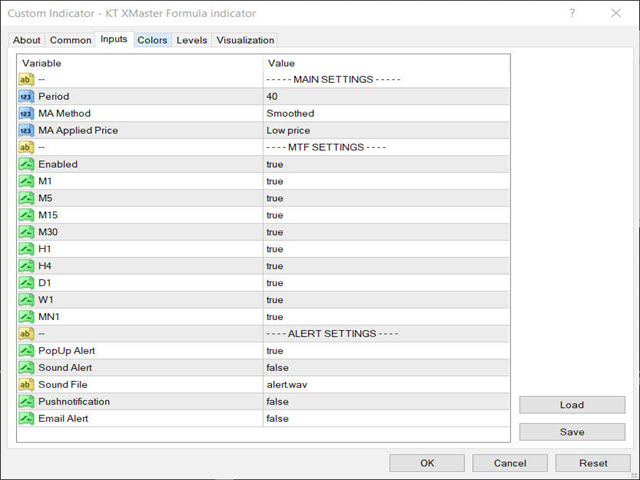
You can adjust the calculation period, smoothing method, and applied price. The dashboard timeframes can be enabled individually, which lets you keep only the market views that matter to your routine. Popup, sound, push notification, and email alerts are available, so a new direction change does not require you to watch the chart continuously.