KT XMaster Formula MT4
- インディケータ
- バージョン: 1.0
- アクティベーション: 10

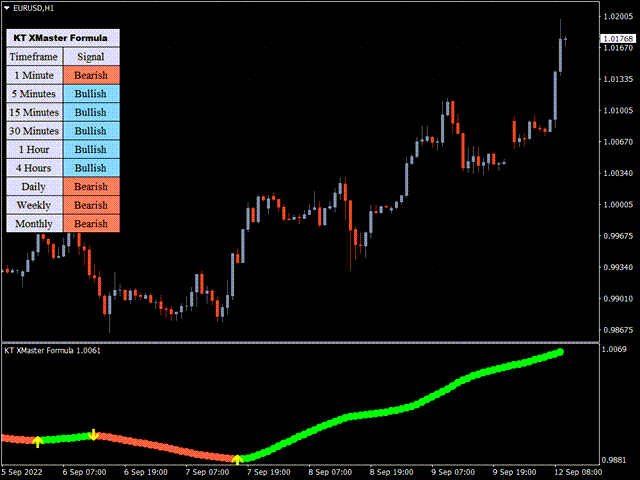
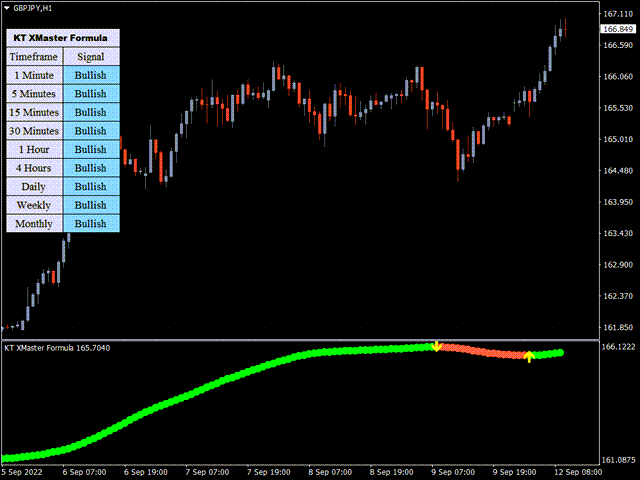
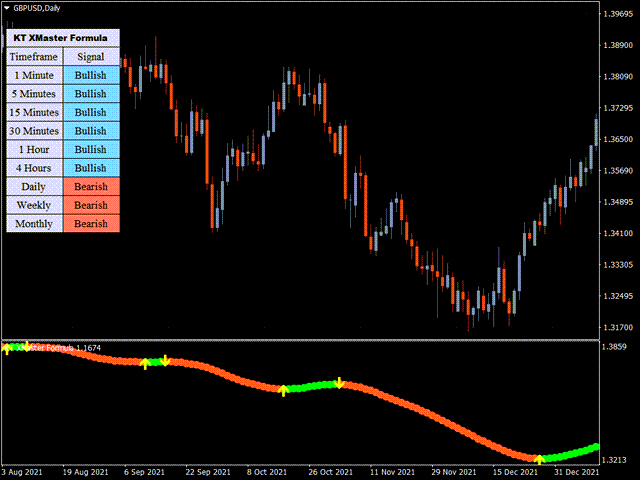
相場が方向を変えても、値動きだけではその変化がすぐに分からないことがあります。KT XMaster Formula は、トレンドとモメンタムの計算結果を、見やすいドットライン、方向転換を示す黄色の矢印、マルチタイムフレームのダッシュボードで表示します。現在の方向、直近で方向が変わった位置、そしてその読みがチャートの価格構造と合っているかを一つの画面で確認できます。
計算には移動平均による平滑化と、RSI および MACD を基にした情報が組み合わされています。複数のインジケーターを重ねる代わりに、スキャルピング、押し目や戻りを狙う手法、トレンドフォローに組み込める一つの視覚的な基準を提供します。
一本のラインで分かる三つの合図
- 緑のドットライン: インジケーターが上昇方向と判断しています。
- 赤のドットライン: インジケーターが下降方向と判断しています。
- 黄色の矢印: 判断が一方の方向から反対方向へ切り替わりました。
ダッシュボードには M1 から MN1 までの Bullish または Bearish の読みが表示されます。新しいチャートシグナルが短期と長期の時間足にそろっているのか、それとも時間足ごとの方向がまだ混在しているのかを素早く確認できます。
シグナルを自分の売買計画に組み込む
買いの候補では、ラインが赤から緑に変わるときの黄色い上向き矢印を確認します。売りの候補では、ラインが緑から赤に変わるときの黄色い下向き矢印を確認します。その後、自分のエントリールール、価格構造、取引する時間帯に照らしてシグナルを判断できます。
直近のスイング安値や高値をリスク配置の参考にし、次の反対シグナルを決済判断の一つとして見るトレーダーもいます。最終的なエントリー、ストップ、決済は自分で決められるため、固定された一つの方法に縛られず、さまざまな取引スタイルに合わせられます。
実用的な設定とアラート
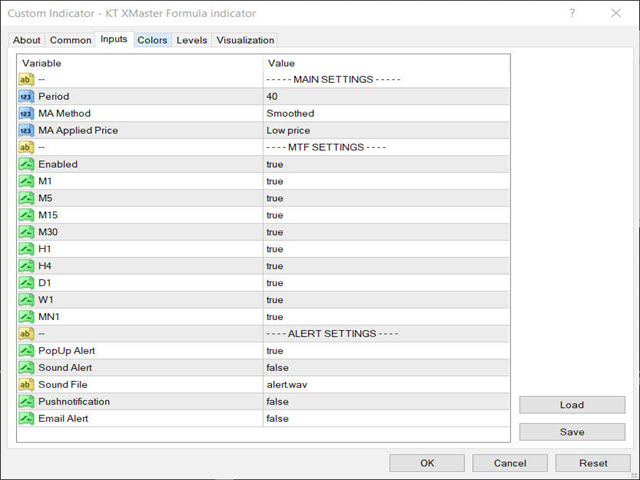
計算期間、平滑化方法、適用価格を調整できます。ダッシュボードの時間足は個別に有効化できるため、普段の取引に必要な市場情報だけを残せます。ポップアップ、サウンド、プッシュ通知、メールの各アラートに対応しており、方向転換を待つ間ずっとチャートを見続ける必要はありません。