KT Coppock Curve MT5
- Indicators
-
KEENBASE SOFTWARE SOLUTIONS
 Keenbase Trading develops professional MetaTrader 4 and MetaTrader 5 indicators and Expert Advisors designed to help traders make more informed trading decisions.
 - Version: 1.0
- Activations: 10
KT Coppock Curve turns a smoothed momentum reading into a clear view of market direction. It runs in a separate window below the price chart, where the zero line becomes the main reference. Instead of reacting to every small change in the curve, you can quickly see whether momentum is holding on the bullish or bearish side.
The curve combines longer and shorter rate-of-change readings and smooths the result. This makes it useful for following broader momentum shifts while reducing some of the noise that appears in faster oscillators.
Start with position, then watch the crossover
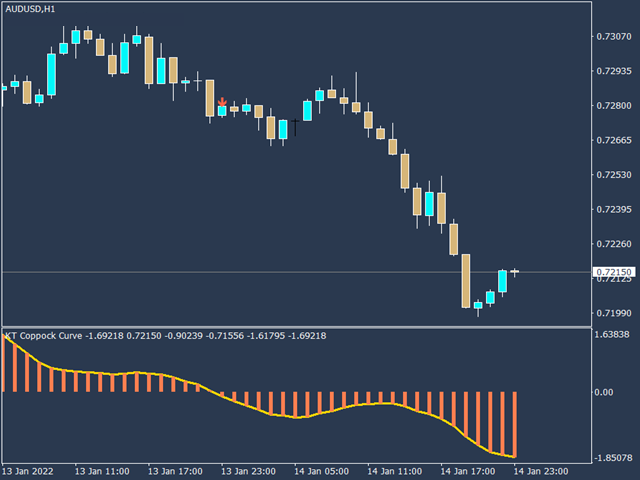
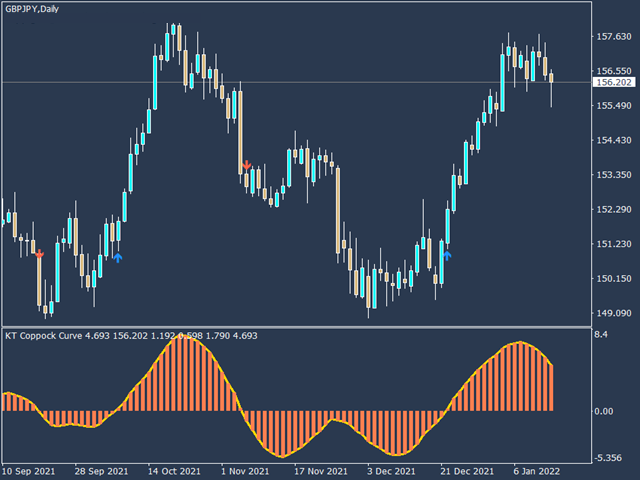
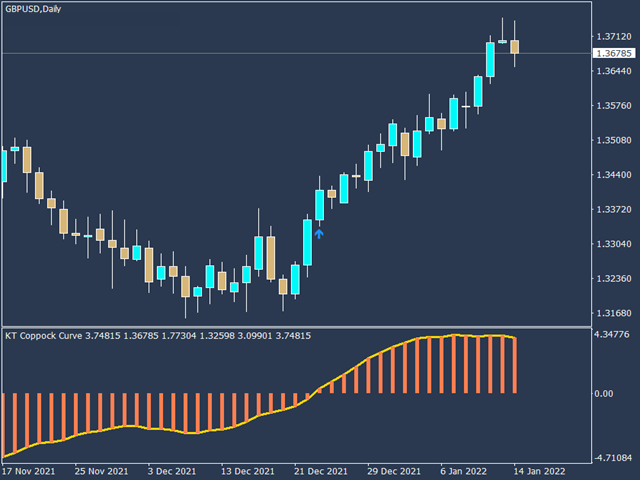
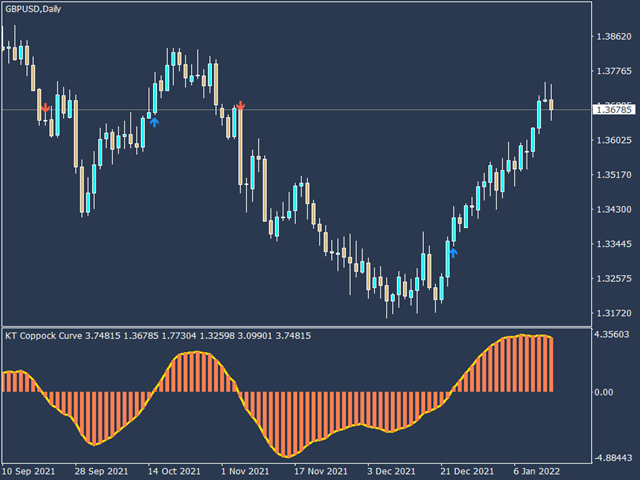
When the curve is above zero, positive momentum is in control. When it is below zero, negative momentum is in control. A curve that remains on one side of the line can help you stay aligned with the prevailing directional pressure instead of changing your view after every candle.
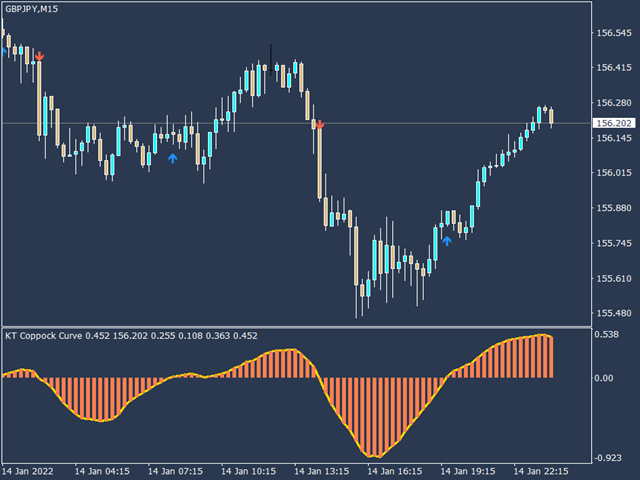
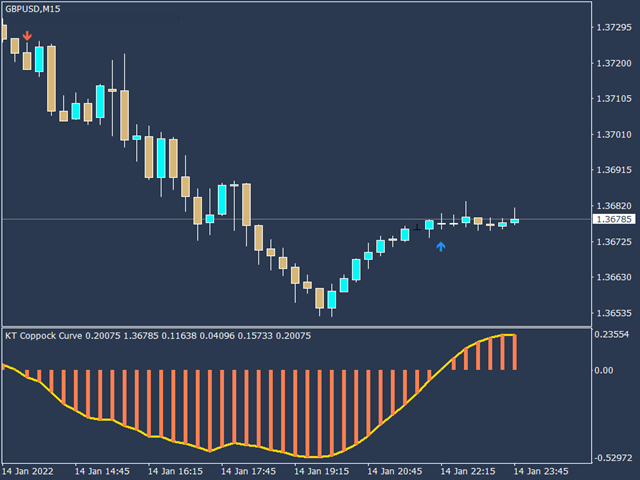
An upward zero-line crossover is marked with an up arrow. A downward crossover is marked with a down arrow. These markers make fresh momentum changes easy to identify without having to judge the exact crossover point by eye.
Use it in a practical trading routine
For directional filtering, you can focus on long setups while the curve is above zero and short setups while it is below zero. This is especially useful when your entry method produces signals in both directions and you want a simple momentum filter.
For timing, watch how the crossover fits with the price chart. A bullish crossover near support or after a pullback carries different context from the same crossover directly below resistance. The bearish side can be read in the same way around resistance, a failed rally, or a break in structure.
On shorter-term charts, the curve can help organize intraday direction and highlight changes in momentum. On longer-term charts, it can help you follow the larger market phase and avoid trading too aggressively against sustained pressure.
Clean chart display and alerts
The simplified color scheme separates positive and negative momentum clearly, while the arrows keep attention on the important zero-line events. This gives you the information without turning the indicator window into a crowded signal panel.
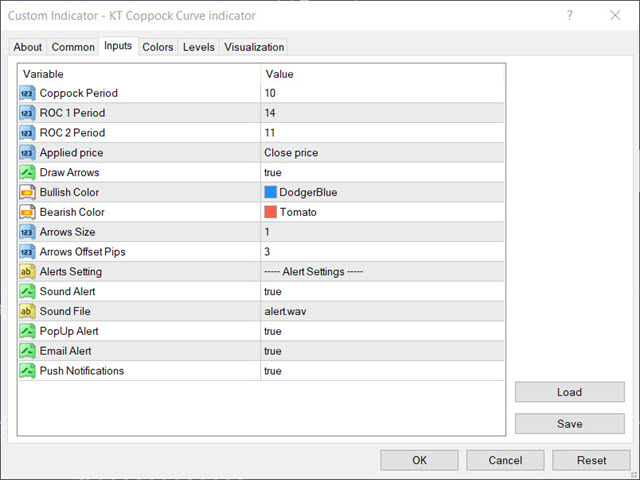
Built-in MetaTrader alerts can notify you when a new zero-line crossover appears. You can monitor several charts without continuously watching each curve, then return to the price chart and judge the setup in its proper market context.