NosTraderMus LinearRegressionBands MT5
- Indicators
- Version: 1.0
- Activations: 5

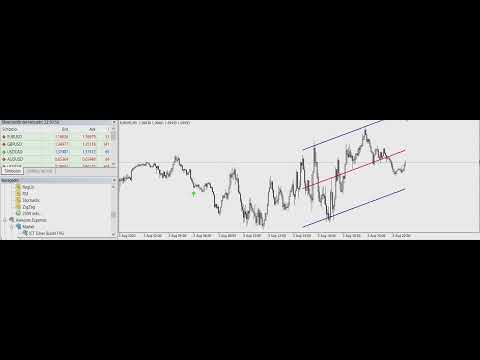
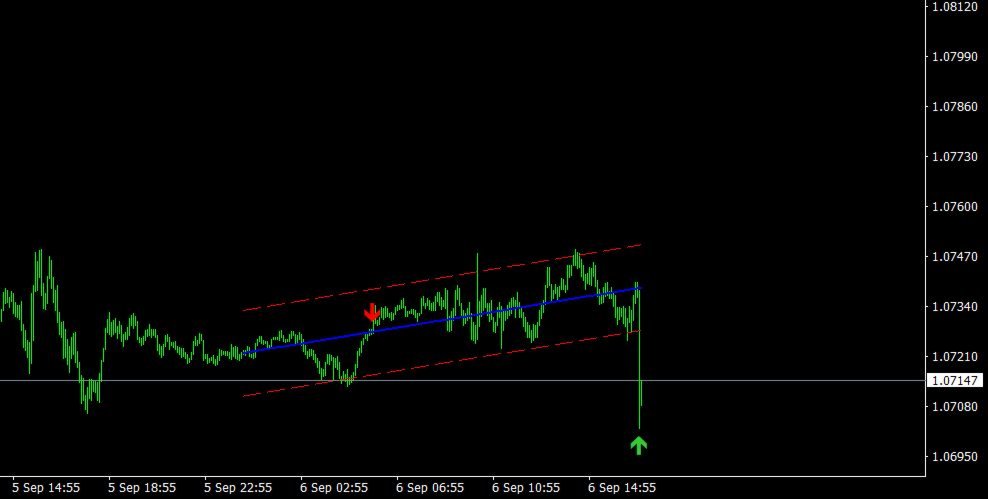
NosTraderMus LinearRegressionBands MT5 is a professional MetaTrader 5 indicator that plots a regression line over a rolling price window and builds dynamic bands from the standard deviation of the fit residuals. On top of this statistical channel it integrates an RSI filter (with selectable timeframe) and buy/sell arrows when objective extreme + confirmation conditions are met. It aims for clear, disciplined signals, reducing noise and repainting by validating on a closed bar.
What it does and how it works
-
Regression line + adaptive bands
The indicator computes the best-fit line (least squares) using RegPeriod bars—this is the channel’s center line. The band width is StdDevFactor times the standard deviation of residuals, so the channel adapts to recent volatility. -
Trend filter (optional)
The slope of the line indicates directional bias. With OnlyInTrend=true , signals are shown with the slope (buys only if slope is positive; sells only if slope is negative). -
Signals (arrows) with RSI + channel break
Exactly one arrow per bar is drawn when both conditions hold:-
Red arrow (sell): RSI exceeds RSI_Overbought and the bar’s high breaks above the upper band.
-
Green arrow (buy): RSI falls below RSI_Oversold and the bar’s low breaks below the lower band.
Evaluation is done on the closed bar set by RSI_Shift (default 1) to mitigate repaint. RSI can come from the current timeframe or a higher timeframe ( RSITimeframe ) for MTF confirmation.
-
-
User experience
-
Solid arrows (red for sells, green for buys) that do not disappear once confirmed.
-
Optional sound ( EnableSound ) when a new arrow is plotted.
-
Visual shift ( PlotShift ) to offset the channel on screen (display only).
-
Advantages and benefits
-
True statistical consistency: band width is based on the model error, not a fixed range, so breaks are measured in context.
-
Clean trend read: the regression line smooths noise and reveals the dominant direction.
-
Extreme + confirmation entries: the RSI + band break combo reduces weak or misleading signals.
-
Less repaint by design: validating on a closed bar via RSI_Shift avoids “forming” signals that later vanish.
-
Multi-timeframe alignment: pull RSI from a higher TF to align micro-signals with the larger structure.
-
Clear, lightweight UI: three lines + solid arrows; easy to read across assets and timeframes.
Best practices
-
Start with RSI_Shift=1 (closed bar). If you later need earlier hints, lower the shift knowing noise will increase.
-
Tune RegPeriod to your symbol and timeframe:
larger → steadier channel with fewer signals; smaller → more reactive channel with more signals. -
StdDevFactor : 1.5–2.5 is common. Higher = fewer signals; lower = more sensitivity.
-
Turn on OnlyInTrend for continuation trading; turn it off if you hunt reversals—but pair that with stricter risk control.
Editable inputs (quick guide)
Window & bands
-
RegPeriod (int) — Number of bars used to fit the regression line.
-
StdDevFactor (double) — Multiplier of residual standard deviation (defines band width).
-
PriceType (enum) — Price source for the fit:
Close , Open , High , Low , Average (O+C)/2 , Typical (H+L+C)/3 .
RSI & signals
-
RSIPeriod (int) — RSI period used as a filter.
-
RSITimeframe (ENUM_TIMEFRAMES) — RSI timeframe (enables MTF confirmation).
-
RSI_Overbought / RSI_Oversold (double) — Overbought/oversold thresholds (70/30 by default).
-
RSI_Shift (int) — Bar index used for evaluation (1 = closed bar).
-
OnlyInTrend (bool) — If true , requires slope in favor of the signal.
-
EnableSound (bool) — If true , plays a sound when a new arrow is drawn.
Presentation
-
PlotShift (int) — Visual offset for the center line and bands (no effect on calculations).
Reading examples
-
Sell (red arrow): RSI > RSI_Overbought and the bar’s high above the upper band. With OnlyInTrend=true , negative slope.
-
Buy (green arrow): RSI < RSI_Oversold and the bar’s low below the lower band. With OnlyInTrend=true , positive slope.
Each arrow is drawn once per bar and persists on the chart.
Disclaimer
NosTraderMus LinearRegressionBands MT5 does not guarantee results or profits. Trading financial markets involves significant risk, especially with leverage. Entry/exit decisions, position sizing, and parameter settings are the sole responsibility of the user. Before using live, we recommend demo testing, validating your approach with backtesting/forward testing, and applying a risk-management plan consistent with your profile.
In summary
NosTraderMus LinearRegressionBands MT5 blends a solid quantitative base (regression line with residual-based bands) with clear signals (RSI + channel break + optional slope filter). It offers a clean trend read and meaningful extremes, mitigates repaint, and adapts across markets and timeframes. A tool for traders who value consistency, noise control, and disciplined visuals in decision-making.