KT Coppock Curve MT5
- 지표
-
KEENBASE SOFTWARE SOLUTIONS
 Keenbase Trading은 트레이더가 더욱 정확하고 신뢰할 수 있는 거래 결정을 내릴 수 있도록 MetaTrader 4 및 MetaTrader 5용 전문 지표와 Expert Advisor(EA)를 개발합니다.
당사의 제품은 실전에서 활용할 수 있는 거래 로직과 직관적인 사용자 경험을 결합하여 안정성, 사용 편의성, 그리고 체계적인 리스크 관리에 중점을 두고 설계되었습니다. 모든 도구는 철저한 테스트를 거쳐 실제 시장 환경에서도 일관되고 안정적인 성능을 제공할 수 있도록 개발됩니다. - 버전: 1.0
- 활성화: 10
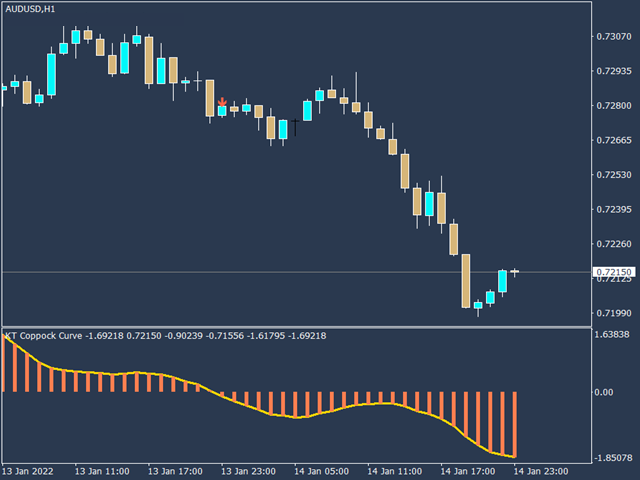
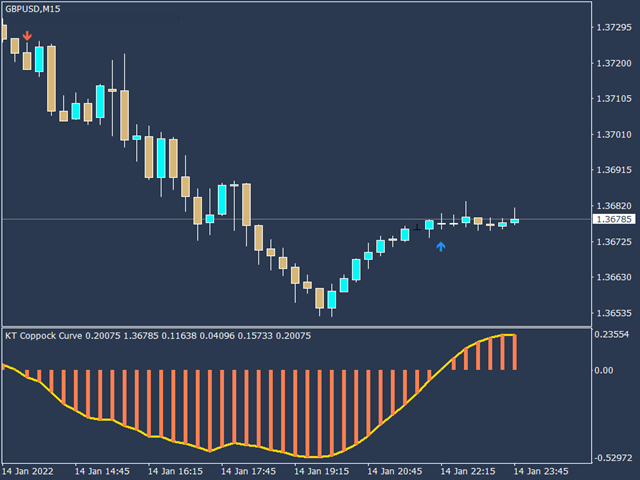
KT Coppock Curve는 평활화된 모멘텀 값을 시장 방향을 보기 쉬운 형태로 보여 줍니다. 가격 차트 아래의 별도 창에 표시되며, 제로 라인이 가장 중요한 기준이 됩니다. 곡선의 작은 변화마다 반응하는 대신 모멘텀이 상승 쪽에 있는지 하락 쪽에 있는지를 빠르게 확인할 수 있습니다.
이 곡선은 장기와 단기의 변화율을 결합한 뒤 결과를 평활화합니다. 따라서 빠른 오실레이터에서 자주 나타나는 노이즈를 어느 정도 줄이면서 더 큰 모멘텀 변화를 추적하는 데 유용합니다.
먼저 위치를 보고 그다음 교차를 확인하세요
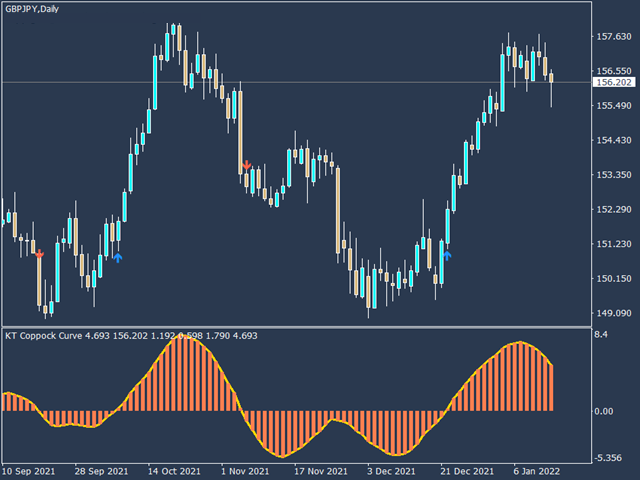
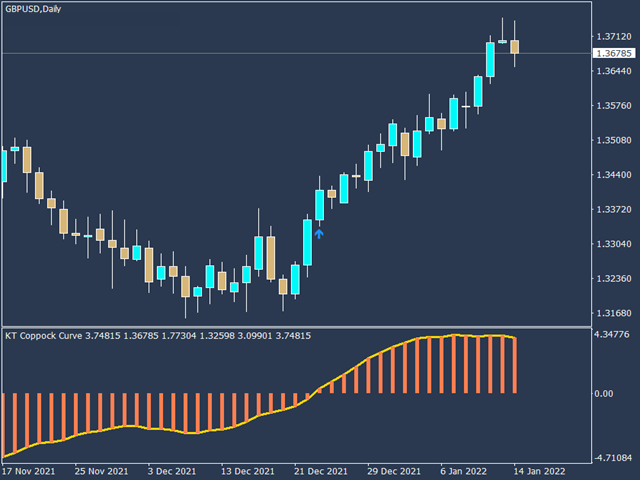
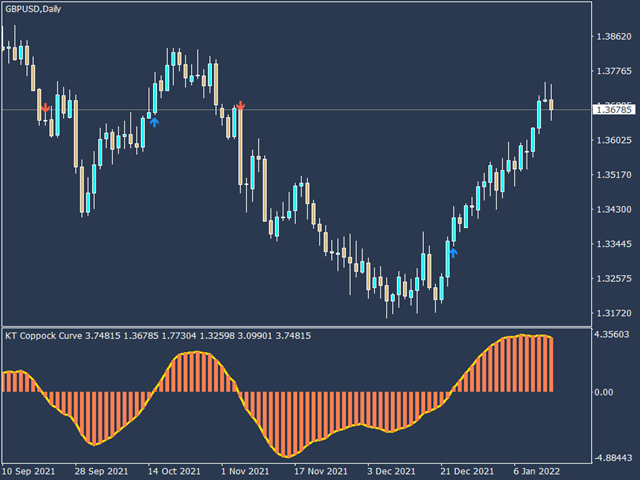
곡선이 제로 위에 있으면 양의 모멘텀이 우세합니다. 제로 아래에 있으면 음의 모멘텀이 우세합니다. 곡선이 제로 라인의 한쪽에 계속 머무르면 캔들 하나마다 관점을 바꾸지 않고 현재의 방향 압력에 맞춰 거래하는 데 도움이 됩니다.
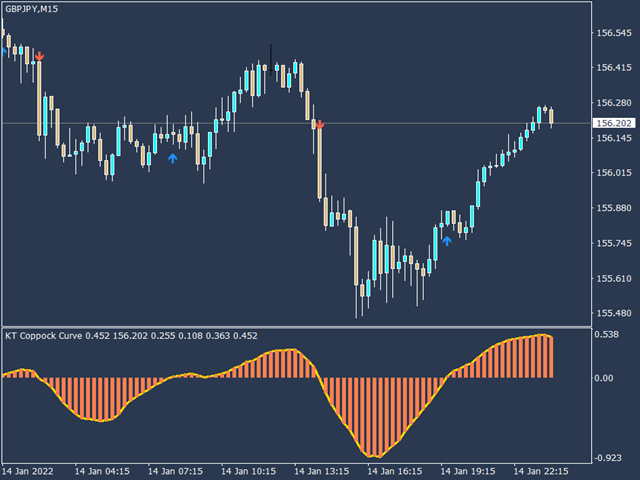
제로 라인을 위로 돌파하면 위쪽 화살표가 표시되고, 아래로 돌파하면 아래쪽 화살표가 표시됩니다. 정확한 교차 지점을 눈으로 판단하지 않아도 새로운 모멘텀 변화를 쉽게 찾을 수 있습니다.
실전 매매 과정에서 활용하는 방법
방향 필터로 사용할 때는 곡선이 제로 위에 있는 동안 매수 기회에 집중하고, 제로 아래에 있는 동안 매도 기회에 집중할 수 있습니다. 진입 방법이 양방향 신호를 모두 만들고 간단한 모멘텀 필터가 필요할 때 특히 유용합니다.
타이밍을 볼 때는 교차가 가격 차트의 어느 위치에서 나왔는지 확인하세요. 지지선 근처나 조정 후에 나온 상승 교차는 저항선 바로 아래에서 나온 같은 교차와 의미가 다릅니다. 하락 쪽도 저항선, 상승 실패 또는 시장 구조 붕괴와 함께 같은 방식으로 판단할 수 있습니다.
단기 차트에서는 장중 방향을 정리하고 모멘텀 변화를 찾는 데 도움이 됩니다. 장기 차트에서는 더 큰 시장 국면을 따라가고 지속되는 압력에 지나치게 역행하는 거래를 피하는 데 도움이 됩니다.
깔끔한 표시와 알림
단순한 색상 구성은 양의 모멘텀과 음의 모멘텀을 명확하게 구분하며, 화살표는 중요한 제로 라인 이벤트에 시선을 모아 줍니다. 필요한 정보는 유지하면서 지표 창이 복잡한 신호 패널처럼 보이지 않게 합니다.
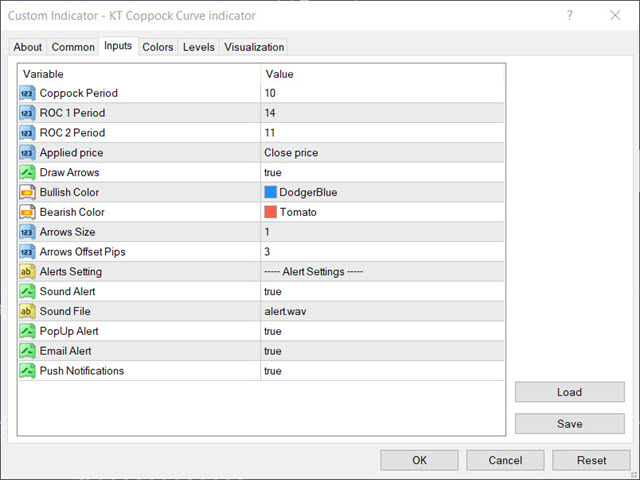
MetaTrader 내장 알림은 새로운 제로 라인 교차가 나타날 때 알려 줄 수 있습니다. 각 곡선을 계속 보고 있지 않아도 여러 차트를 모니터링할 수 있으며, 알림 후 가격 차트로 돌아가 현재 시장 상황에 맞춰 진입 기회를 판단할 수 있습니다.