Volume Profile FR supply and demand
- Indicators
-
Mihails Babuskins
 Senior developer for financial markets.
Contact me: Forex.terminology@outlook.com
🔵 Telegram group link: https://t.me/CommunityAndChat - Version: 1.7
- Updated: 10 January 2025
- Activations: 11
- Contact me after payment to send you the User-Manual PDF File.
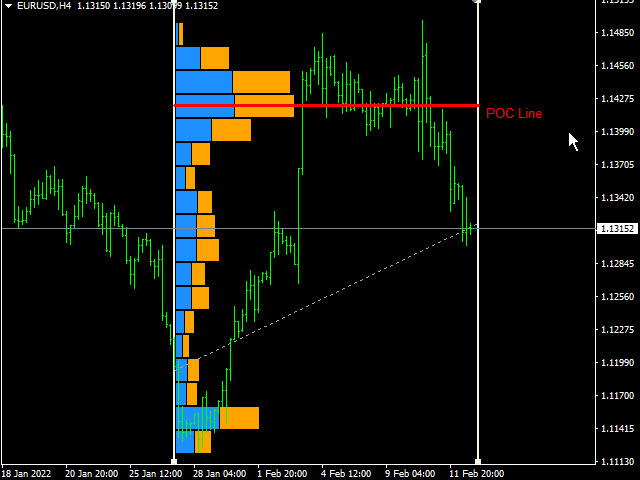
Volume Profile Indicator
A functional and useful tool that can improve your trading plan.
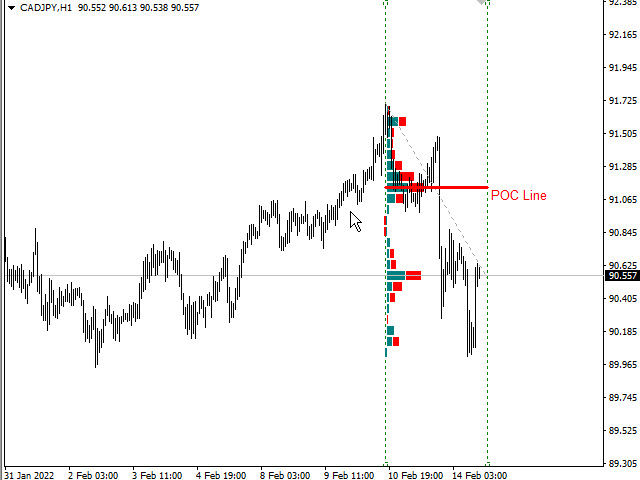
This indicator calculates volume in price levels(typical volume indicator shows only candle volumes).
With the volume of price levels, you can identify important areas that have the potential to reverse. You can also see the volume of support and resistance levels and decide on them.
Using volume profiles along with Price Action and Elliott analysis can help the trader a lot.
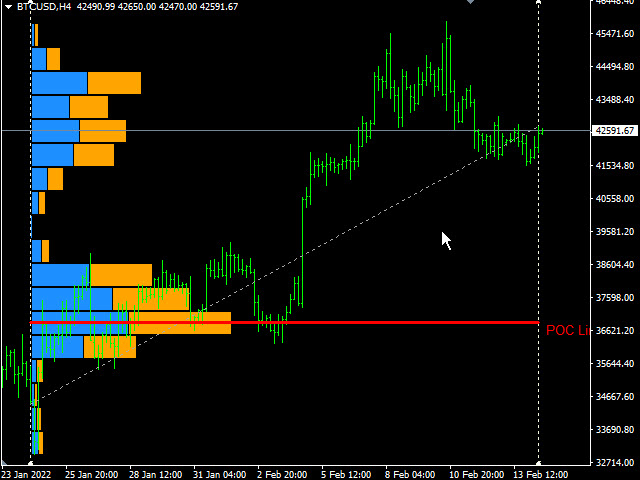
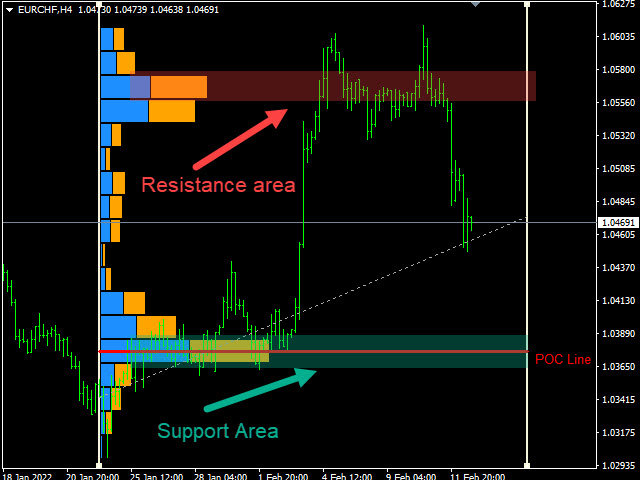
Support and Resistance Levels
The first thing that most traders will use volume profile for is identifying basic support and resistance levels.It is important to note that using Volume Profile as an identifier for support and resistance levels is a reactive method. This means that unlike proactive methods (such as trend lines and moving averages) which are based on current price action and analysis to predict future price movements, reactive methods rely on past price movements and volume behavior. Reactive methods can be useful in applying meaning or significance to price levels where the market has already visited. Basic technical analysis has shown that a support level is a price level which will support a price on its way down and a resistance level is a price level which will resist price on its way up.
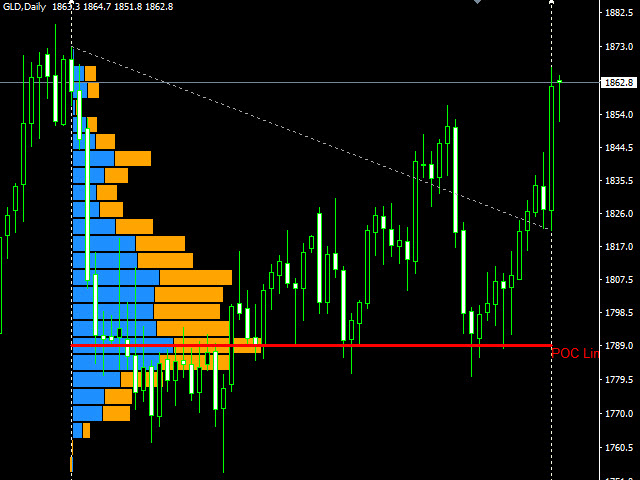
Therefore, one can conclude that a price level near the bottom of the profile which heavily favors the buy side in terms of volume is a good indication of a support level. The opposite is also true. A price level near the top of the profile which heavily favors sell side volume is a good indication of a resistance level.
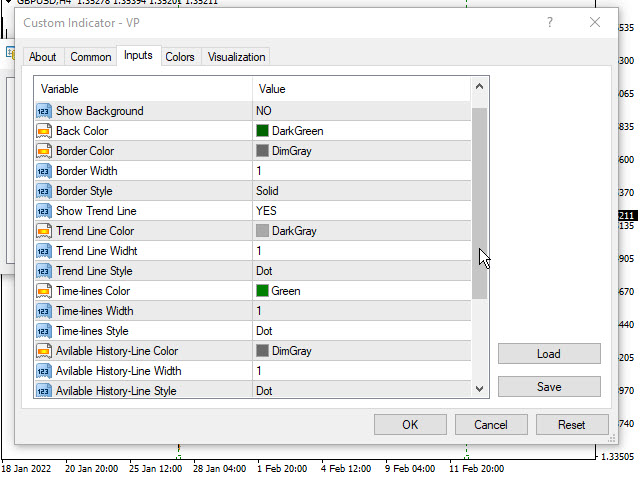
Indicator Parameters:
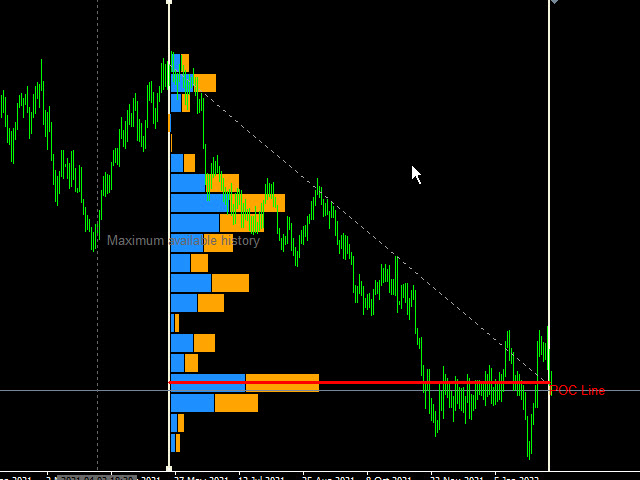
- Calculation Period: With this option, you can specify the deep search in a specific time-frame.
- M1 Minute: Calculation on M1 time-frame candles, Calculations with high accuracy but slowly.
- M5 Minute: Calculation on M5 time-frame candles, Calculations with good accuracy and fast.
- M15 Minute: Calculation on M15 time-frame candles, Calculations with low accuracy and very fast (Recommended only in time-frame H4 and above).
Other parameters are related to indicator graphics.
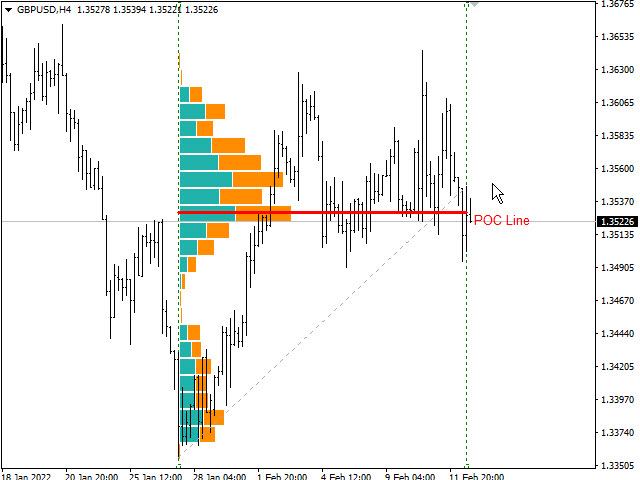
Example strategy
Just like with most other tools or studies, Volume Profile has a number of uses. There are many trading strategies out there using Volume Profile as a key component. Below are the basics of one such strategy which is based on comparing the current day’s opening price to the previous day’s Volume Profile.
- If the current day opens above the previous day’s value area (but still below the Profile High) look for price to retrace back towards the Point of Control and then proceed to rise (the direction of the day’s open). Therefore during the retracement to the Point of Control, there is a buying opportunity.
- If the current day opens below the previous day’s value area (but still above the Profile Low) look for price to retrace back towards the Point of Control and then proceed to fall (the direction of the day’s open). Therefore during the retracement to the Point of Control, there is a selling opportunity.
- If the current day’s opening price is completely outside of the previous day’s profile (above the Profile High or below the Profile Low) this can be seen as a possible runner in the direction of the opening price relative to the previous day’s profile range.


Sir,your indicator is very amazing,easy to understand market buy and sell, this is why I bought volume profile,i no regrets bought it,I am very grateful 🙏