RSI Trend

RSI Trend is a trend indicator that interprets the current market situation based on multiple RSI indicators with different periods.


Indicator Benefits

  • Displays zones of an evident trend movement, overbought/oversold zones, as well as transition zones;
  • Can be used in scalping strategies, as well as medium-term and long-term strategies;
  • Has a minimum of settings;
  • The standard line colors and selected for a comfortable operation with the black and white styles of the chart;
  • Can be used in Expert Advisors


Input Variables explained

  • Period - the average line period of the RSI indicator.


Description of indicator

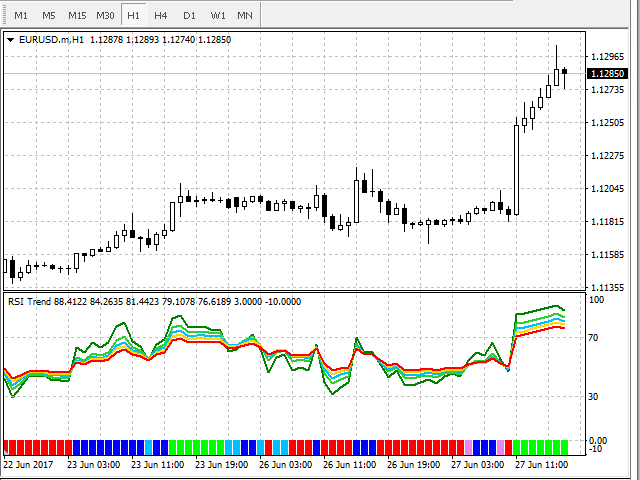
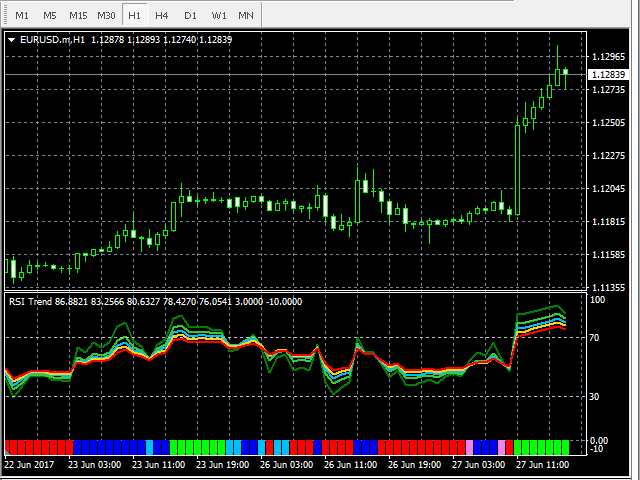
The indicator consists of RSI 5 lines with different periods and colored histograms on each candlestick, interpreting the market situation. In settings, you specify the period of the average RSI line, while the periods of other lines will be calculated automatically. Depending on the sequence of RSI lines, there 6 possible market situations, which are displayed on the chart as a histogram of different colors.

Histograms can be of 6 different colors:

  • Green - overbought zone;
  • Blue - upward trend;
  • Light blue - the price is too low;
  • Pink - the price is too high;
  • Red - downward trend;
  • Orange - oversold zone.

Zones of upward/downward trend movement.

The overbought/oversold zones occur after trend movements, indicating a decrease in the trend strength, further correction or trend reversal.

Zones with a too high/low price appear as a result of a sharp price movement against the trend, followed by either a price return to the current trend, or an attempt to form a new trend.


Using in an Expert Advisor

For convenient indicator use in the Expert Advisors, it has a buffer (buffer index "5") containing all the values ​​of the histograms:

  • "3" - green - overbought zone;
  • "2" - blue - upward trend;
  • "1" - light blue - the price is too low;
  • "-1" - pink - the price is too high;
  • "-2" - red - downward trend;
  • "-3" - orange - oversold zone;
  • "EMPTY_VALUE" - an empty valye, uncalculated bars.

Please contact me for any questions and suggestions.

Recommended products
VR Cub
Vladimir Pastushak
VR Cub is an indicator for getting high-quality entry points. The indicator was developed to facilitate mathematical calculations and simplify the search for entry points into a position. The trading strategy for which the indicator was written has been proving its effectiveness for many years. The simplicity of the trading strategy is its great advantage, which allows even novice traders to successfully trade with it. VR Cub calculates position opening points and Take Profit and Stop Loss targe
Daily Candle Predictor is an indicator that predicts the closing price of a candle. The indicator is primarily intended for use on D1 charts. This indicator is suitable for both traditional forex trading and binary options trading. The indicator can be used as a standalone trading system, or it can act as an addition to your existing trading system. This indicator analyzes the current candle, calculating certain strength factors inside the body of the candle itself, as well as the parameters of
EZZ Zig Zag MT4
Paulo Rocha
5 (1)
EZZ Elite Zig Zag is an indicator for the MetaTrader 4 terminal. This indicator traces the peak of the trend based on the market reversal, thus showing various opportunities in the financial market. EZZ Elite Zig Zag is a visual tool, intuitive, and easy to understand and use.  Test it Yourself by Downloading it for Free. Author Paulo Rocha all rights reserved
Trend Oscillator - is an advanced custom  Crypto_Forex indicator, efficient trading tool! Advanced new calculation method is used - 20 options for parameter "Price for calculation". Smoothest oscillator ever developed. Green color for upward trends,  Red color for downward trends. Oversold values: below 5, O verbought values: over 95. There are plenty of opportunities to upgrade even standard strategies with this indicator. With PC and Mobile alerts. Click here to see high quality Trading Robot
Super Reversal Pattern
Parfait Mujinga Ndalika
Super Reversal Pattern Indicator Unlock the power of advanced pattern recognition with our Super Reversal Pattern Indicator. Designed for traders seeking precision and reliability, this indicator identifies one of the most effective reversal patterns in technical analysis, offering a significant edge in your trading strategy. Key Features: Non-Repainting Accuracy: Enjoy the confidence of non-repainting technology. Once a Super Reversal Pattern is detected, it remains static, providing consiste
Noize Absorption Index MT4
Ekaterina Saltykova
5 (1)
Noize Absorption Index - is the manual trading system that measures the difference of pressure between bears forces and bulls forces. Green line - is a noize free index that showing curent situation. Zero value of index shows totally choppy/flat market.Values above zero level shows how powerfull bullish wave is and values below zero measures bearish forces.Up arrow appears on bearish market when it's ready to reverse, dn arrow appears on weak bullish market, as a result of reverse expectation. S
Infinity Trend Pro
Yaroslav Varankin
1 (1)
This is a trend indicator without redrawing Developed instead of the binary options strategy (by the color of the Martingale candlestick) Also works well in forex trading When to open trades (binary options) A signal will appear in the place with a candle signaling the current candle It is recommended to open a deal for one candle of the current timeframe M1 and M5 When a blue dot appears, open a deal up When a red dot appears, open a trade down. How to open trades on Forex. When a signal is rec
"Dynamic Scalping Oscillator" - is an advanced custom Crypto_Forex indicator - efficient Trading tool for MT4!  - New generation of Oscillators - see pictures to check how to use it. - Dynamic Scalping Oscillator has adaptive Oversold/Overbought zones. - Oscillator is an auxiliary tool to find exact entry points from dynamic OverSold/OverBought areas. - Oversold values: below Green line, Overbought values: over Orange line . - This indicator is great to combine with Price Action patterns as we
Auto Fibo Pro m
DMITRII GRIDASOV
"Auto FIBO Pro"   Crypto_Forex  indicator  - is great auxiliary tool in trading! Indicator automatically calculate and place on chart Fibo levels and local trend lines (red color). Fibonacci levels indicate key areas where price can reverse. Most important levels are 23.6%, 38.2%, 50% and 61.8%. You can use it   for reversal scalping  or for zone grid trading. There are plenty of opportunities to  improve your current system using Auto FIBO Pro indicator as well. It has Info Spread Swap Displa
"Dynamic Flow Oscillator" - is an advanced custom Crypto_Forex indicator - efficient Trading tool for MT4!  - New generation of Oscillators - see pictures to check how to use it. - Dynamic Flow Oscillator has adaptive Oversold/Overbought zones. - Indicator uses   price and volume data   for identifying oversold and overbought zones. - Oscillator is an auxiliary tool to find exact entry points from OverSold/OverBought areas. - Oversold values: below Green line, Overbought values: over Red line
RSI Speed mp
DMITRII GRIDASOV
Crypto_Forex   Indicator "RSI SPEED" for MT4 - great predictive tool , No Repaint. The calculation of this indicator is  based on equations from physics . RSI SPEED is the  1st derivative of RSI  itself. RSI SPEED is   good for scalping entries   into the direction of main trend. Use it   in combination   with suitable   trend indicator , for example HTF MA (as on pictures). RSI SPEED indicator shows how fast RSI itself changes its direction   - it is very sensitive . It is recommended to use RS
Trade with Gann on your side!! MASTER CIRCLE 360 CIRCLE CHART, originally created by Gann admitted that this is “The Mother of all charts”. It is one of the last studies that this great trader left for us. The numeric tab le is apparently quite simple like all the tables and is based on square numbers, the SQUARE OF 12 and is by evolution, one of the most important square numbers. Here we can find CYCLE, PRICE AND TIME thanks to angles and grades, to show past and future support and resistance.
Alpha Trend
Evgeny Belyaev
3 (4)
Alpha Trend is a trend indicator for the MetaTrader 4 platform; it has been developed by a group of professional traders. The Alpha Trend indicator finds the most probable tendency reversal points, which allows making trades at the very beginning of a trend. This indicator features notifications, which are generated whenever a new signal appears (alert, email, push-notification). This allows you to open a position in a timely manner. Alpha Trend does not redraw, which makes it possible to evalua
[ZhiBiCCI] indicators are suitable for all cycle use, and are also suitable for all market varieties. [ZhiBiCCI] Green solid line is a reversal of bullish divergence. The green dotted line is a classic bullish divergence. [ZhiBiCCI] The solid line to the red is a reverse bearish divergence. The red dotted line is a classical bearish divergence. [ZhiBiCCI] can be set in the parameters (Alert, Send mail, Send notification), set to (true) to send instant signals to the alarm window, email, insta
The SMC Venom Model BPR indicator is a professional tool for traders working within the Smart Money (SMC) concept. It automatically identifies two key patterns on the price chart: FVG (Fair Value Gap) is a combination of three candles, in which there is a gap between the first and third candles. It forms a zone between levels where there is no volume support, which often leads to a price correction. BPR (Balanced Price Range) is a combination of two FVG patterns that form a “bridge” - a zone of
Risk Management and Limit Monitoring Indicator for Professional Traders and Evaluation Accounts (Prop) This tool only displays precise risk management and limit information on the chart to help you make more focused decisions. The indicator does not open/close/modify trades and does not interfere with Expert Advisors (EAs). Features Monitoring daily and total drawdown Calculates and displays daily and total drawdown based on Balance or Equity (configurable). Shows the remaining percentage to th
The indicator displays the data of the Stochastic oscillator from a higher timeframe on the chart. The main and signal lines are displayed in a separate window. The stepped response is not smoothed. The indicator is useful for practicing "manual" forex trading strategies, which use the data from several screens with different timeframes of a single symbol. The indicator uses the settings that are identical to the standard ones, and a drop-down list for selecting the timeframe. Indicator Paramet
Cosmic Diviner X Planet
Olena Kondratenko
4 (2)
This unique multi-currency strategy simultaneously determines the strength of trends and market entry points, visualizing this using histograms on the chart. The indicator is optimally adapted for trading on the timeframes М5, М15, М30, Н1. For the convenience of users, the indicator renders the entry point (in the form of an arrow), recommended take profit levels (TP1, TP2 with text labels) and the recommended Stop Loss level. The take profit levels (TP1, TP2) are automatically calculated for
Fibonacci retracement and extension line drawing tool Fibonacci retracement and extended line drawing tool for MT4 platform is suitable for traders who use  golden section trading Advantages: There is no extra line, no too long line, and it is easy to observe and find trading opportunities Trial version: https://www.mql5.com/zh/market/product/35884 Main functions: 1. Multiple groups of Fibonacci turns can be drawn directly, and the relationship between important turning points can be seen
The Th3Eng PipFinite indicator is based on a very excellent analysis of the right trend direction with perfect custom algorithms. It show the true direction and the best point to start trading. With StopLoss point and Three Take Profit points. Also it show the right pivot of the price and small points to order to replace the dynamic support and resistance channel, Which surrounds the price. And Finally it draws a very helpful Box on the left side on the chart includes (take profits and Stop loss
An indicator of pattern #31 ("Long Island") from Encyclopedia of Chart Patterns by Thomas N. Bulkowski. The second gap is in the opposite direction. Parameters: Alerts - show alert when an arrow appears   Push - send a push notification when an arrow appears (requires configuration in the terminal) GapSize - minimum gap size in points ArrowType - a symbol from 1 to 17 ArrowVShift - vertical shift of arrows in points   ShowLevels - show levels ColUp - color of an upward line ColDn - color of a
The   RSI Divergence + FVG Signal   indicator combines   Relative Strength Index (RSI) Divergence   with   Fair Value Gap (FVG)   detection to generate high-probability buy and sell signals based on both momentum shifts and institutional imbalance zones. Core Features: RSI Divergence Detection : Identifies both regular and hidden bullish/bearish divergences between price and RSI. Divergences indicate potential trend reversals or continuation. FVG Zone Recognition : Detects Fair Value Gaps (imbal
First of all Its worth emphasizing here that this Trading Tool is Non-Repainting Non-Redrawing and Non-Lagging Indicator Which makes it ideal for professional trading . [Online course] ,   and   [manual] The Smart Price Action Concepts Indicator is a very powerful tool for both new and experienced traders . It packs more than 20 useful indicators into one combining advanced trading ideas like Inner Circle Trader Analysis and Smart Money Concepts Trading Strategies . This indicator focuses on Sm
Magical Arrow
Ranguni Abdulsamir Abdulmajid
Magical Arrow Indicator – Clear & Reliable Signals The Magical Arrow Indicator is a non-repainting, trend-following tool that gives you crystal-clear Buy and Sell signals . It  high-probability reversals and entries . No more guesswork – just follow the arrows on your chart! The Magical Arrow Indicator is a powerful, easy-to-use trading tool that helps you catch the most profitable Buy and Sell opportunities in the Forex market. It is designed for beginners and professional traders , giving y
Key level wedge
Presley Annais Tatenda Meck
5 (5)
The Key level wedge indicator automatically draws rising wedge pattern and falling wedge pattern for you on the chart. This pattern is really good when used as a confirmation entry at key support & resistance, supply & demand and reversal zones. Advantages  The Key level wedge block DOES NOT RE-PAINT, giving you confidence when a signal appears and also helps when looking back.  The Key level wedge includes an on/off button on the chart to easily keep the charts clean after analysis by just o
Color Stochastic Enhanced Stochastic Oscillator with Cross Detection and Visual Signal Support Overview Color Stochastic is a customized version of the classic Stochastic Oscillator designed for momentum analysis and crossover visualization. The indicator provides color-based signal marking and configurable crossover detection at user-defined overbought and oversold levels. It can be used as part of: Momentum analysis Mean reversion workflows DCA-based strategies Multi-indicator confirmation sys
Kangaroo Tailz
Brenden Caleb Luebeck
Looking for an indicator that identifies high-probability price action patterns? Love counter-trend trading? The Kangaroo Tailz indicator might be just for you. This indicator is meant to be used as a reversal detector. I personally would rather enter a position at the beginning of a trend rather than catch the last couple of moves. This indicator does a good job of alerting when price may reverse by identifying price action patterns that occur frequently in markets. Even though this indicator i
Alpha Trend sign has been a very popular trading tool in our company for a long time. It can verify our trading system and clearly indicate trading signals, and the signals will not drift. Main functions: Based on the market display of active areas, indicators can be used to intuitively determine whether the current market trend belongs to a trend market or a volatile market. And enter the market according to the indicator arrows, with green arrows indicating buy and red arrows indicating se
Gvs Undefeated Trend   indicator is designed for trend and signal trading. This indicator generates trend signals.  It uses many algorithms and indicators to generate this signal. It tries to generate a signal from the points with the highest trend potential. This indicator is a complete trading product. This indicator does not need any additional indicators.  You can only trade with this indicator. The generated signals are displayed on the graphical screen.  Thanks to the alert features you ca
Lyne
Maksim Kalachev
About the Lyne indicator Lyne is a Metatrader 4 (MT4) indicator, the essence of which is to transform the accumulated historical data. The Lyne indicator makes it possible to detect various features and patterns in price dynamics that are invisible to the naked eye. Based on this information, traders can anticipate further price movement and adjust their strategy accordingly. This indicator has proven itself in the scalping strategy. The indicator works without repainting.
Buyers of this product also purchase
Gann Made Easy
Oleg Rodin
4.83 (162)
Gann Made Easy is a professional and easy to use Forex trading system which is based on the best principles of trading using the theory of W.D. Gann. The indicator provides accurate BUY and SELL signals including Stop Loss and Take Profit levels. You can trade even on the go using PUSH notifications. PLEASE CONTACT ME AFTER PURCHASE TO GET TRADING  INSTRUCTIONS AND GREAT EXTRA INDICATORS   FOR FREE! Probably you already heard about the Gann trading methods before. Usually the Gann theory is a ve
Genesis Matrix Pro is a professional multi-timeframe trend detection indicator designed to help traders identify high-quality market alignment with clarity and structure. It combines 12 different technical indicators into one visual alignment matrix, allowing traders to quickly see when market conditions are bullish, bearish, or neutral. A signal is generated only when the selected strategies are aligned, helping reduce noise and improve decision-making. PLEASE CONTACT ME AFTER PURCHASE TO GET
The Propfolio Master Suite is the ultimate all-in-one analytical workstation for professional traders. Combining the power of the Beat The Market Maker (BTMM) methodology, Smart Money Concepts (SND/Liquidity), and Advanced Volume Profile, this suite replaces multiple different indicators with one optimized engine. Monitor up to 14 pairs simultaneously from a single chart, instantly identify market cycles, and seamlessly map institutional footprints with the click of a button. The Command Center
Scalper Inside PRO
Alexey Minkov
4.74 (69)
Scalper Inside PRO Scalper Inside PRO is an intraday trend and scalping indicator for MetaTrader 4 that uses an exclusive algorithm to quickly detect market direction and key target levels. It automatically calculates entry, exit and multiple profit targets, and shows detailed performance statistics so you can see how different instruments and strategies performed. This helps you choose the most suitable trading instruments for the current market conditions. Additionally, you can easily integrat
M1 Sniper
Oleg Rodin
5 (23)
M1 SNIPER is an easy to use trading indicator system. It is an arrow indicator which is designed for M1 time frame. The indicator can be used as a standalone system for scalping on M1 time frame and it can be used as a part of your existing trading system. Though this trading system was designed specifically for trading on M1, it still can be used with other time frames too. Originally I designed this method for trading XAUUSD and BTCUSD. But I find this method helpful in trading other markets a
PZ Harmonacci Patterns
PZ TRADING SLU
3.17 (6)
Trade smarter, not harder: Empower your trading with Harmonacci Patterns This is arguably the most complete harmonic price formation auto-recognition indicator you can find for the MetaTrader Platform. It detects 19 different patterns, takes fibonacci projections as seriously as you do, displays the Potential Reversal Zone (PRZ) and finds suitable stop-loss and take-profit levels. [ Installation Guide | Update Guide | Troubleshooting | FAQ | All Products  ] It detects 19 different harmonic pric
PRO Renko System
Oleg Rodin
5 (30)
PRO Renko System is a highly accurate trading system specially designed for trading RENKO charts. The ARROWS and Trend Indicators DO NOT REPAINT! The system effectively neutralizes so called market noise giving you access to accurate reversal signals. The indicator is very easy to use and has only one parameter responsible for signal generation. You can easily adapt the tool to any trading instrument of your choice and the size of the renko bar. I am always ready to provide extra support to help
Auto Optimized Parabolic RSI: Advanced 3D Momentum Engine Most retail indicators fail because they rely on static inputs that break the moment market volatility shifts. Auto Optimized Parabolic RSI solves the problem of "indicator decay" by continuously recalculating its own mathematical edge, bringing institutional-grade quantitative adaptation directly to your MT5 terminal. The Core Advantage: Custom In-Memory 3D Optimization   Standard auto-optimizers often freeze the MT5 platform because the
NAM Order Blocks
NAM TECH GROUP, CORP.
3.67 (3)
MT4 Multi-timeframe Order Blocks detection indicator. Features - Fully customizable on chart control panel, provides complete interaction. - Hide and show control panel wherever you want. - Detect OBs on multiple timeframes. - Select OBs quantity to display. - Different OBs user interface. - Different filters on OBs. - OB proximity alert. - ADR High and Low lines. - Notification service (Screen alerts | Push notifications). Summary Order block is a market behavior that indicates order collection
Quants HL Break
Ferhat Mutlu
5 (2)
Advanced calculation made by pure price action to find LH and HL breakouts. It will give you a great reversal points in the market. LH and HL signals can used for the traingle breakouts as well. Once breakout happens its indicate strong reversal. Nice filter for Moving Averages. I highly suggest to use that with trend indicators. Can be used as an extra confirmation for support and resistance , supply demand indicators. The indicator is not repainting. Buffers :   SetIndexBuffer ( 0 ,UpBar);
Dynamic Forex28 Navigator
Bernhard Schweigert
4.43 (7)
Specials Discount now. The Next Generation Forex Trading Tool. Dynamic Forex28 Navigator is the evolution of our long-time, popular indicators, combining the power of three into one: Advanced Currency Strength28 Indicator (695 reviews) + Advanced Currency IMPULSE with ALERT (520 reviews) + CS28 Combo Signals (recent Bonus) Details about the indicator  https://www.mql5.com/en/blogs/post/758844 What Does The Next-Generation Strength Indicator Offer? Everything you loved about the originals, now
RFI levels PRO
Roman Podpora
5 (1)
The indicator accurately shows the reversal points and price return zones where the   Major players . You see where new trends are forming and make decisions with maximum precision, maintaining control over every trade. VERSION MT5     -     Reveals its maximum potential when combined with the   TREND LINES PRO   indicator What the indicator shows: Reversal structures and reversal levels with activation at the beginning of a new trend. Display of   TAKE PROFIT   and   STOP LOSS   levels with mi
Trend Catcher ind
Ramil Minniakhmetov
TREND CATCHER INDICATOR Trend Catcher Indicator analyzes market price movements, using a combination of the author’s proprietary and customized adaptive trend-analysis indicators.  It identifies the true market direction by filtering out short-term noise and focusing on underlying momentum strength, volatility expansion, and price structure behavior.  It also uses a combination of smoothing and trend-filtering customized indicators such as moving averages, RSI, and volatility filters.   Real ope
Apollo SR Master is a Support/Resistance indicator with special features which make trading with Support/Resistance zones easier and more reliable. The indicator calculates Support/Resistance zones in real-time without any time lag by detecting local price tops and bottoms. Then to confirm the newly formed SR area, the indicator shows special signal which signalizes that the SR zone can be taken into consideration and used as an actual SELL or BUY signal. In this case the strength of the SR zone
New Update of Smart Trend Trading System MT5 For  2026 Market: If You Buy this Indicator you will Get my Professional   Trade Manager + EA  for   FREE . First of all Its worth emphasizing here that this Trading System is   Non-Repainting   , Non Redrawing and Non Lagging Indicator   Which makes it ideal from both manual and robot trading .  [Online course] ,   [manual]   and   [download presets] . The Smart Trend Trading System MT5 is a comprehensive trading solution tailored for   new   and   e
GoldRush Trend Arrow Signal V1.6 The GoldRush Trend Arrow Signal indicator V1.6 continues to provide precise, real-time trend analysis tailored for high-speed, short-term scalpers in XAU/USD , but it now has additional features and improved efficiency and reliability. Built specifically for the 1-minute time frame, this tool displays directional arrows for clear entry points, allowing scalpers to navigate volatile market conditions with confidence. The indicator consists of PRIMARY and SECONDARY
Introduction to Fractal Pattern Scanner Fractal Indicator refers to the technical indicator that makes use of the fractal geometry found in the financial market. Fractal Pattern Scanner is the advanced Fractal Indicator that brings the latest trading technology after the extensive research and development work in the fractal geometry in the financial market. The most important feature in Fractal Pattern Scanner is the ability to measure the turning point probability as well as the trend probabi
Trading Special –40% OFF Best Solution for any Newbie or Expert Trader! This Indicator is a unique, high quality and affordable trading tool because we have incorporated a number of proprietary features and a new formula. With only ONE chart you can read Currency Strength for 28 Forex pairs! Imagine how your trading will improve because you are able to pinpoint the exact trigger point of a new trend or scalping opportunity? User manual: click here That's the first one, the original! Don't buy a
Market Structure Patterns MT4
Samuel Manoel De Souza
5 (18)
Market Structure Patterns   is an indicator based on   smart money concepts   that displays   SMC/ICT   elements that can take your trading decisions to the next level. Take advantage of the   alerts ,   push notifications   and   email messages   to keep informed from when an element is formed on the chart, the price crosses a level and/or enters in a box/zone. Developers can access the values of the elements of the indicator using the   global variables  what allows the automation of trading d
Advanced Supply Demand
Bernhard Schweigert
4.91 (300)
Trading Special – 40% OFF Best Solution for any Newbie or Expert Trader! This indicator is a unique, high quality and affordable trading tool because we have incorporated a number of proprietary features and a new formula. With this update, you will be able to show double timeframe zones. You will not only be able to show a higher TF but to show both, the chart TF, PLUS the higher TF: SHOWING NESTED ZONES. All Supply Demand traders will love it. :) Important Information Revealed Maximize the pot
Advanced UT BOT ALERTS for MT4 Professional Multi-Filter Trend Detection System | Enhanced UT BOT Engine We only provide high-quality indicators.  Advanced UT BOT is built for professional use, featuring a stable signal logic and secure calculation process that prevents any delays or false updates. It does not repaint, redraw, remove, or modify past signals in any way. All BUY and SELL signals are generated only after the candle has closed , ensuring consistent accuracy and reliability. There is
Contact me after purchase to get Bonus EA based on this indicator. The Self Optimizing Double MA Strategy is a professional-grade trading tool designed to eliminate parameter guesswork. Powered by a built-in auto-optimization engine, it continuously adapts to shifting market conditions by simulating thousands of parameter combinations in the background to maintain a statistical edge. Instead of relying on static, outdated settings, the indicator dynamically updates its own logic to find the mos
If you trade Forex, having detailed information about the currency strength and currency pairs correlation can take your trading to new heights. The correlation will help to cut your risk in half, and strength analysis will help to maximize the profits. This indicator provides a hybrid approach for selecting the most appropriate currency pairs using the strength analysis and currency pairs correlation. How to use the Currency Strength Analysis Suppose your trading strategy provides a buying opp
CRT Candle Range Theory HTF MT4.   Ultimate CRT Indicator: Advanced ICT Concepts and Malaysian SnR Trading System Discounted   Price   $50  !!     Secure your lifetime access   now   before it switches to   subscription-only ! Master the Market Maker's Footprints with the Most Advanced Candle Range Theory Indicator Unlock the true power of   Smart Money Concepts (SMC)   and trade precisely like the institutions with the   Ultimate CRT Indicator . Built exclusively for serious traders, this indic
Day Trader Master is a complete trading system for traders who prefer intraday trading. The system consists of two indicators. The main indicator is the one which is represented by arrows of two colors for BUY and SELL signals. This is the indicator which you actually pay for. I provide the second indicator to my clients absolutely for free. This second indicator is actually a good trend filter indicator which works with any time frame. THE INDICATORS DO NOT REPAINT AND DO NOT LAG! The system is
KURAMA GOLD SIGNAL PRO (MT4) — Complete XAUUSD Trading System with 7-Layer Filter, Auto TP/SL, and Quality Scoring NON-REPAINTING. NON-REDRAWING. NON-LAGGING. Every signal is permanent. What you see is what you get. BONUS: Buy the lifetime license and receive AI Zone Radar ($59 value) + full PDF manual FREE. Message me after purchase. AI Zone Radar: https://www.mql5.com/en/market/product/175834 TRUSTED BY TRADERS: Already used by an active community of Gold traders. Praised for accuracy and
The " Dynamic Scalper System " indicator is designed for the scalping method of trading within trend waves. Tested on major currency pairs and gold, compatibility with other trading instruments is possible. Provides signals for short-term opening of positions along the trend with additional price movement support. The principle of the indicator. Large arrows determine the trend direction. An algorithm for generating signals for scalping in the form of small arrows operates within trend waves.
Master head and shoulders patterns for better trading decisions A head and shoulders pattern is a chart formation that resembles a baseline with three peaks, the outside two are close in height and the middle is highest. It predicts a bullish-to-bearish trend reversal and is believed to be one of the most reliable trend reversal patterns. It is one of several top patterns that signal, with varying degrees of accuracy, that a trend is nearing its end. [ Installation Guide | Update Guide | Trouble
PZ Double Top Bottom
PZ TRADING SLU
5 (1)
Trade double tops and bottoms effectively The PZ Double Top/Bottom Indicator is a technical analysis tool that helps traders identify potential price reversal patterns in the market. These patterns, known as double tops and bottoms, are characterized by two consecutive peaks or valleys in the price of an asset. Double tops and bottoms are often seen as potential reversal patterns because they can signal a change in the direction of the current trend. [ Installation Guide | Update Guide | Troubl
Apex Break PRO MT4
Kestutis Balciunas
Apex Break PRO is a non-repainting pivot trendline breakout indicator for MetaTrader 4. It detects pivot highs and pivot lows, draws dynamic sloped trendlines between consecutive pivots, and generates buy and sell signals when price breaks through those trendlines on a confirmed bar close. Every signal is filtered through up to four independent confluence layers — EMA trend, RSI boundaries, volume spike detection, and ADX trend strength — and rated with a star system so traders can immediately s
More from author
Copy Trader MT4
Denis Luchinkin
5 (1)
Copy Trader is a convenient and fast order copier for MetaTrader4. The EA performs the copying of orders from the server terminal to one or several client terminals. It monitors opening/closing, StopLoss and TakeProfit, and also pending orders. It uses a magic number for its orders, which allows to open other orders in the client terminal both manually and using other experts; It has a minimum of settings. Install the Expert Advisor in two terminals: Choose MODE - SERVER on the terminal to copy
Candlestick Patterns MT4 is a simple and convenient indicator able to define 29 candle patterns. Advantages Defines and highlights 29 candle patterns; Estimated trading direction is shown as an arrow; Each candlestick pattern can be disabled in the settings; The indicator can be used as an arrow indicator in EAs. Parameters TextSize - chart text size; TextColor - chart text color; Alert - enable/disable alerts; ---------- Candlestick Patterns ------------- - settings separator; AdvanceBlock ;
Candlestick Patterns Analytics is a powerful tool for analyzing candlestick patterns. Do you trade based on candlestick patterns? Then Candlestick Patterns Analytics is designed for you. The undeniable advantage of the indicator: Predicts trading result when trading candlestick patterns; Uses statistical data based on the history of the selected symbol and timeframe. What the indicator does Finds and marks on the chart 29 candlestick patterns; Draws arrows to indicate the classical and statist
Candlestick Patterns Custom is the lite version of the Candlestick Patterns Analytics indicator , intended for use as a conventional arrow indicator and in expert advisors. The considerable advantages of the indicator It finds and marks 29 candlestick patterns (43 variants of signal patterns) on the chart; It allows the user to configure the signal of each pattern in accordance with the analysis results of the Candlestick Patterns Analytics indicator; The indicator can also be used as an arrow
Candlestick Patterns Trade Custom is an Expert Advisor for trading candlestick patterns. The considerable advantages of the EA It allows the user to configure the signal of each pattern, it is recommended to configure the EA in accordance with the analysis results of the Candlestick Patterns Analytics indicator; It does not use Martingale; Contains the integrated Candlestick Patterns Custom indicator. Description of Input Parameters Each candlestick pattern has a drop-down menu with the option
Candlestick Patterns All Pair is a simple and convenient indicator of candlestick pattens. It is able to identify 29 candlestick patterns. It displays the latest patterns for all pairs and timeframes. The considerable advantages of the indicator It finds and marks 29 candlestick patterns; Displays a table of the last patterns for the 28 major pairs and each timeframe; It has settings for 5 extra pairs; Indicates the classic trade direction; Each candlestick patterns can be disabled in the setti
The MultiCurrency RSI indicator calculates the values of the standard RSI indicator for each of 8 major currencies: EUR, GBP, AUD, NZD, USD, CAD, CHF, JPY. Advantage of the indicator: The calculation is performed based on 8 virtual currency charts: EUR, GBP, AUD, NZD, USD, CAD, CHF, JPY; Shows the strength of currencies, not depending on the currency pair; Allows any time to determine the strongest and the weakest currency, also sorts currencies by strength; At any time it shows the current str
MultiCurrency Indicators is a multi-currency indicator which calculates the values of multiple standard indicators for each of the 8 major currencies: EUR, GBP, AUD, NZD, USD, CAD, CHF, JPY. Advantages of the indicator Calculation is performed for 8 virtual charts of the currencies: EUR, GBP, AUD, NZD, USD, CAD, CHF, JPY; Show the currency strength, which does not depend on the currency pair; It allows determining the strongest and the weakest currencies at any moment, it also sorts currencies
Future Candle One Candle is an arrow indicator of candlestick patterns, based on the calculation of historical statistics. It identifies and calculates patterns consisting of one candle. Advantages of the indicator Gives information about the next candle right now; The indicator values are based on statistical data on the history of the current instrument; Forecasts and displays the result of trading based on its signals; The colors of the indicator have been selected for a comfortable operatio
Future Candle Two Candle is an arrow indicator of candlestick patterns, based on the calculation of historical statistics. It identifies and calculates patterns consisting of two candles. Advantages of the indicator Gives information about the next candle right now; The indicator values are based on statistical data on the history of the current instrument; Forecasts and displays the result of trading based on its signals; The colors of the indicator have been selected for a comfortable operati
Future Candle Three Candle is an arrow indicator of candlestick patterns, based on the calculation of historical statistics. It identifies and calculates patterns consisting of three candles. Advantages of the indicator Gives information about the next candle right now; The indicator values are based on statistical data on the history of the current instrument; Forecasts and displays the result of trading based on its signals; The colors of the indicator have been selected for a comfortable ope
Spreads Monitoring MT4 - мощный инструмент для сбора значений спреда и записи их в файл. Позволяет "ловить" минимальные и максимальные значения спреда, рассчитывает реальное среднее значение спреда у брокера . Преимущества индикатора: Работает на всех таймфреймах; Восстанавливает ранее записанные данные для отображения на графике; Умеет запускать себя на графиках других символов по шаблону текущего графика; Имеет инструменты для удобной работы с данными; Не нагружает терминал. Параметры индикато
Pivots MT4
Denis Luchinkin
Pivots MT4 - Простой и удобный индикатор уровней pivot , рассчитывает уровни по методам  Classic , Fibonacci , DeMark , Camarilla , WooDie , Central Pivot Range . Индикатор выгодно отличается следующим Рассчитывает уровни pivot по методам  Classic ,  Fibonacci ,  DeMark ,  Camarilla ,  WooDie ,  Central Pivot Range ; Выводит на графике текущие уровни и уровни на предыдущих периодах; Выводит на графике выбранные метод и период, названия уровней и их ценовые значения. Параметры Pivot Method - Выпа
Candlestick Patterns MT5  is a simple and convenient indicator able to define 29 candle patterns. Advantages Defines and highlights 29 candle patterns; Estimated trading direction is shown as an arrow; Each candlestick pattern can be disabled in the settings; The indicator can be used as an arrow indicator in EAs. Parameters TextSize  - chart text size; TextColor  - chart text color; Alert  - enable/disable alerts; ---------- Candlestick Patterns -------------  - settings separator; AdvanceBlo
Filter:
No reviews
Reply to review