RSI Trend
- Indicadores
- Versión: 1.0
- Activaciones: 20

RSI Trend es un indicador de tendencia que interpreta la situación actual del mercado basándose en múltiples indicadores RSI con diferentes periodos.
Ventajas del indicador
- Muestra zonas de un movimiento de tendencia evidente, zonas de sobrecompra/sobreventa, así como zonas de transición;
- Puede utilizarse en estrategias de scalping, así como en estrategias a medio y largo plazo;
- Tiene un mínimo de ajustes;
- Los colores de línea estándar y seleccionados para un funcionamiento cómodo con los estilos blanco y negro del gráfico;
- Se puede utilizar en Expert Advisors
Variables de entrada explicadas
- Período - el período medio de la línea del indicador RSI.
Descripción del indicador
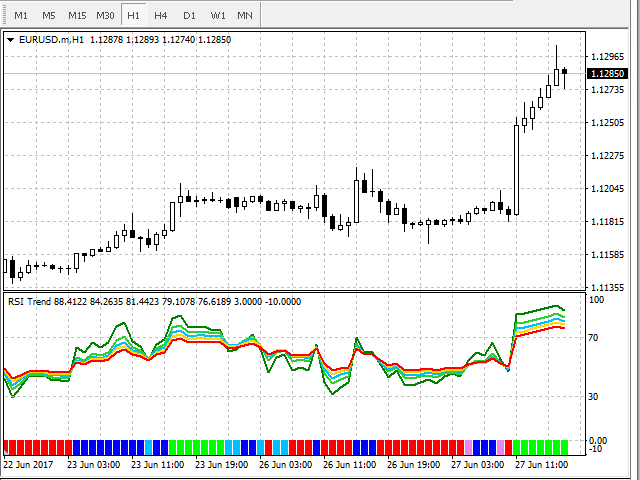
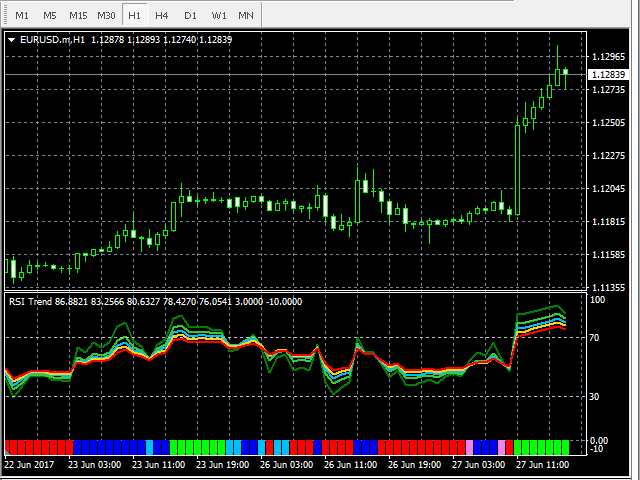
El indicador consiste en 5 líneas RSI con diferentes periodos e histogramas de colores en cada vela, interpretando la situación del mercado. En los ajustes, se especifica el periodo de la línea media del RSI, mientras que los periodos de las demás líneas se calcularán automáticamente. Dependiendo de la secuencia de líneas RSI, hay 6 posibles situaciones de mercado, que se muestran en el gráfico como un histograma de diferentes colores.
Los histogramas pueden ser de 6 colores diferentes:
- Verde - zona de sobrecompra;
- Azul - tendencia alcista;
- Azul claro - el precio es demasiado bajo;
- Rosa - el precio es demasiado alto
- Rojo - tendencia bajista;
- Naranja - zona de sobreventa.
Zonas de movimiento de tendencia alcista/bajista.
Las zonas de sobrecompra/sobreventa aparecen después de los movimientos de tendencia, lo que indica una disminución de la fuerza de la tendencia, una nueva corrección o un cambio de tendencia.
Las zonas de precio demasiado alto/bajo aparecen como resultado de un movimiento brusco del precio en contra de la tendencia, seguido de un retorno del precio a la tendencia actual o de un intento de formar una nueva tendencia.
Uso en un Asesor Experto
Para una cómoda utilización del indicador en los Asesores Expertos, dispone de un búfer (índice de búfer "5") que contiene todos los valores de los histogramas:
- " 3" - verde - zona de sobrecompra;
- "2" - azul - tendencia alcista;
- "1 "- azul claro - el precio es demasiado bajo;
- "-1" - rosa - el precio es demasiado alto;
- "-2" - rojo - tendencia bajista;
- "-3" - naranja - zona de sobreventa;
- "EMPTY_VALUE" - un valye vacío, barras sin calcular.
Por favor, póngase en contacto conmigo para cualquier pregunta y sugerencia.