JET Market Monitor US500

The stocks of the US500 in one heat map, right on your MetaTrader 5 chart.

JET Market Monitor US500 shows the stocks that make up the S&P 500 index as a heat map. Each box is a stock: its size follows the stock's weight in the index and its color follows the daily change (green up, red down, gray at 0.00%). The stocks are grouped into 11 sectors, so you can see at a glance which sectors are leading and which are lagging.

It is an indicator only: it never opens, closes or changes orders.

What you see

  • Heat map of all the stocks (about 500), box size by weight in the index.
  • Grouping by sector (11 sectors).
  • In each box: symbol, company name (can be turned off) and daily change; smaller boxes show fewer lines, and the smallest show only the color.
  • Rest the mouse on any box to see its symbol and daily change.
  • Top bar: weighted change of the US500 portfolio, number of stocks up, down and unchanged, and session status.
  • Fixed color scale (±3%) with a legend at the bottom.
  • Dark and light themes, 11 languages (automatic from the terminal), adjustable panel size.
  • X button: removes the indicator and restores the chart.
  • Updates every 2 seconds.

Works on most brokers

  • Requires a broker that offers US stocks or stock CFDs in MetaTrader 5.
  • The indicator finds the stocks automatically on most brokers; if one is missing, enter its name in the settings.
  • Prices and any quote delay depend on your broker's data feed.
  • If the account has no US stocks, the indicator opens normally and shows a notice.

System requirements

  • With about 500 stocks, the terminal receives quotes for about 500 symbols, so MetaTrader 5 uses more memory and processor than usual: in our tests, about 2–3 GB of RAM and 1 to 1.5 processor cores while the market is open. Recommended: 8 GB of RAM or more.
  • The first load of the stocks' history takes about 1–2 minutes.

Want more?

JET Market Monitor US500 PRO adds: organize by turnover (when the broker provides it) and by daily, weekly, monthly or yearly change; group by change; click to open the stock's chart; details panel; price line in each box (1 day to 1 year); list mode; your own lists; automatic color scale.

Full version: JET Market Monitor US500 PRO

JET Market Monitor US500 is not affiliated with, sponsored or endorsed by S&P Dow Jones Indices. The name S&P 500 is used only to describe the stocks displayed.

Trading involves risk of loss. The indicator displays market data; it does not predict prices and does not guarantee results.

Recommended products
Advanced MTF High Low
Felipe Monteiro Rodrigues
Advanced MTF High Low is a multi-timeframe structural analysis indicator that automatically identifies the most relevant highs and lows from different periods (Month, Week, Day, H4, H1, among others) and projects these levels directly onto the current chart in lower timeframes. The indicator was developed to help traders quickly locate important institutional support and resistance zones by using the actual extremes of higher timeframes. The levels remain visible until they are mitigated by pric
FREE
The 30 stocks of the US30 in one heat map, right on your MetaTrader 5 chart. JET Market Monitor US30 Free shows the stocks that make up the Dow Jones Industrial Average as a heat map. Each box is a stock: its size follows the stock's weight in the index and its color follows the daily change (green up, red down, gray at 0.00%). The stocks are grouped into 11 sectors, so you can see at a glance which sectors are leading and which are lagging. It is an indicator only: it never opens, closes or cha
FREE
EMA Clock
Flavio Carneiro De Barros
EMA Clock reads the slope of an exponential moving average as the hour hand of a clock. How it works The slope of the EMA over a chosen number of bars is normalized by the ATR, converted into an angle and then into a clock hour: - 12:00 - the average is rising steeply (hand pointing up) - 15:00 - the average is flat (hand pointing right) - 18:00 - the average is falling steeply (hand pointing down) Each hour equals 30 degrees. Normalizing by the ATR keeps the reading comparable across symbols
FREE
Slow RSI
Flavio Javier Jarabeck
4.8 (5)
For those who feel that regular RSI is too fast and too noisy to be used on regular trades or in EAs and want to have an alternative to meter the Momentum of the Price, here is a solution presented on the great article of the Technical Analysis of Stocks & Commodities magazine (April, 2015), by Vitali Apirine, called: Slow Relative Strenght Index . Its reading is almost the same as the regular RSI, but its levels of Overbought and Oversold are 80 and 20 instead. SRSI is very powerful to show div
FREE
How it works –   Base-departure detection — algorithmically finds consolidation bases (overlapping range with compressed volatility) followed by displacement departures. Patterns: Drop-Base-Rally, Rally-Base-Drop, Rally-Base-Rally, Drop-Base-Drop — detected structurally, not by candle names. –   Strength score (0–100) — from departure velocity, time-at-base, freshness (each revisit decays the score), higher-timeframe confluence and origin volume. –   Lifecycle — Fresh, Tested (decaying), Broken
FREE
VolumeBasedColorsBars
Henrique Magalhaes Lopes
VolumeBasedColorsBars — Free Powerful Volume Analysis for All Traders Unlock the hidden story behind every price bar! VolumeBasedColorsBars is a professional-grade, 100% FREE indicator that colorizes your chart candles based on real, adaptive volume analysis. Instantly spot surges in market activity, identify exhaustion, and catch the moves that matter. This indicator gives you:    • Dynamic color-coded bars for instant volume context    • Adaptive thresholds based on historical, session-awar
FREE
TM Liquidity Compass is a chart-based market structure and liquidity indicator for MetaTrader 5. It combines confirmed BOS and CHoCH markings, premium/equilibrium/discount areas, nearby liquidity objectives, qualified imbalance detection, and one dynamic dominant support or resistance zone. A compact panel summarizes the current structure, value area, objective, imbalance, pressure and market state. Main features: Confirmed BOS and CHoCH structure markings Green and red trade-confirmation bands
FREE
Pivot Points Indicator – a fast, reliable, and fully customizable pivot detection for MetaTrader 5. This indicator uses MetaTrader’s native iHighest and iLowest functions to identify pivot highs and lows by scanning for the highest and lowest prices within a user-defined window of bars. A pivot is confirmed only when the current bar is the absolute maximum or minimum within the selected range, ensuring accurate and timely signals based on robust built-in logic. Key Features No Repainting : Onc
FREE
TrendSync MACD Pro
Juliano Guzlinki Pacheco
TrendSync MACD Pro Zero Lag MACD signals, synchronized with the higher-timeframe trend, with a live multi-timeframe panel. Non-repainting. For MetaTrader 5. The classic MACD lags, so its crossovers often arrive after a move has already started. TrendSync MACD Pro rebuilds the MACD with a Zero Lag smoothing technique for earlier, cleaner crossovers, and then synchronizes those signals with the higher-timeframe trend so you stay on the right side of the dominant move. A built-in multi-timeframe
FREE
VFI Quantum
Nikita Berdnikov
5 (1)
Introducing VFI (Volume Flow Indicator) – a trading indicator that analyzes the relationship between volume and price movement to identify key trading opportunities. The indicator displays the strength and direction of volume flow, providing clear signals about potential entry and exit points. Signals are formed based on zero line crossovers, crossovers between the VFI line and its exponential moving average (EMA), and when the indicator exits overbought and oversold zones. Attention! This stra
FREE
Renko Heatmap Pro – ATR Renko Trend, Reversal and Trade Levels Renko Heatmap Pro is a MetaTrader 5 (MT5) Renko-style trend and volatility analysis indicator that uses Average True Range (ATR)-based calculations to visualise directional price movement, potential trend reversals, and changing market conditions on a conventional price chart. Designed for traders who want Renko-inspired analysis without relying solely on a separate offline Renko chart, the indicator presents calculated directional s
FREE
LT Force
Thiago Duarte
5 (5)
For those who like trend the Force will be a very useful indicator. This is because it is based on the famouse ADX, which measure the strenght of a trend, but without its 3 confusing lines. Force has its very simple interpretation: if the histogram is above zero level the trend is up, otherwise it is down. You can use it to find divergences too, which is very profitable. Thanks to Andre Sens for the version 1.1 idea. If you have any doubt or suggestion, please, contact me. Enjoy! MT4 version: 
FREE
Squeeze Momentum Force is an advanced technical analysis indicator designed for MetaTrader 5. It combines volatility squeeze detection with momentum analysis to identify high-probability trading opportunities. Based on John Carter's original concept, this enhanced version incorporates: Multi-Timeframe (MTF) analysis. Divergence detection. Volume weighting. Modern user interface for quick market interpretation. The indicator identifies periods of low volatility (squeeze) that typically precede si
FREE
Apex Point
Marco Engstermann
Apex Point is a trend-following indicator for MetaTrader 5, transforming complex market data into signals for traders. It displays blue dots for uptrends, red dots for downtrends, and yellow crosses at potential reversals, helping users identify momentum shifts quickly. Key features include a confirmation system requiring multiple bars (default: 3) to validate changes, reducing false signals; dynamic ATR-based offsets for adaptive trailing, with instant ratcheting in the trend direction and smo
FREE
Colored Adaptive Moving Average AMA
Flavio Javier Jarabeck
4.78 (9)
If you like to use traditional Moving Averages (like SMAs and EMAs) to provide your trades for dynamic levels of Support and Resistance, you will love the Adaptive Moving Average (AMA). Created in 1995 by Perry Kaufman and presented to the world in his book " Smarter   Trading :  Improving   Performance   in   Changing   Markets ", the Adaptive Moving Average (also known as KAMA - Kaufman Adaptive Moving Average) has the goal to be the perfect companion for following a trend without noise, but s
FREE
Rejection Zones
Paulo Henrique Faquineli Garcia
Este poderoso indicador analisa o gráfico e mostra zonas de Rejeição de Preços! Isto é, locais onde o preço foi, mas não foi aceito pelo mercado! A visualização desta zona de Rejeição, facilita o entendimento do trader na tomada de decisões de onde operar e como operar! O indicador é composto por 4 linhas, sendo classificadas em 2 grupos: Linhas Vermelha e Amarela: Denotam os extremos onde o preço conseguiu chegar, mas não foi aceito! Linhas Laranja e Azul: A partir delas, denotam o Início da z
FREE
Fibonacci Retracement Zones of the Latest Swing Leg FibRetrace Zones is the free visual companion to the FibRetrace Expert Advisor. It draws the Fibonacci retracement levels and highlights the pullback zone on the latest swing leg, so you can see where retracement entries line up before you trade. The zone is color-coded by direction: green for bullish setups, red for bearish setups. Works on any symbol and any timeframe. KEY FEATURES Automatic swing detection with adjustable lookback Classic Fi
FREE
Super Trend eu
Emin Ulucanli
4.83 (6)
SUPERTREND; It is a trend following indicator based on the SuperTrend ATR created by Olivier Seban. It can be used to detect changes in trend direction and locate stops. When the price falls below the indicator curve, it turns red and indicates a downtrend. Conversely, when the price moves above the curve, the indicator turns green, indicating an uptrend. Like other indicators, it works well on SuperTrend when used in conjunction with other indicators such as MACD, parabolik SAR, Bollinger Band
FREE
This indicator is a zero-lag indicator and displays  strength of trend change . True Trend  Oscillator Pro works best in combination with True Trend Moving Average Pro that displays exact trend as is. Oscillator value is exact price change in given direction of the trend. True Trend Moving Average Pro: https://www.mql5.com/en/market/product/103586 If you set PERIOD input parameter to 1 this indicator becomes a sharpshooter for binary options. Developers can use True Trend Oscillator in Exper
FREE
MACD Intraday Trend
JETINVEST
4.81 (57)
Free Fibonacci-tuned MACD for intraday trends. Want alerts and the full toolkit? MACD Intraday Trend PRO MACD Intraday Trend is an Indicator developed through an adaptation made of the original MACD created by Gerald Appel in the 1960s. Through years of trading it was observed that by changing the parameters of the MACD with Fibonacci proportions we achieve a better presentation of the continuity of the trend movements, making that it is possible to more efficiently detect the beginning and end
FREE
Lts Trend Strength
Gabriel Garcia Bogo
Grid baskets rarely break in a quiet market. They break when a trend starts and nobody notices it in time. LTS Trend Strength is the market-regime filter from LTS - Legacy Trading System. In one look it tells you whether the market is ranging, in transition or in a strong trend, on your chart and on four higher timeframes at the same time. It is built on the same ADX and ATR principles we use to protect our Expert Advisors, and it is free. It is a market filter, not an entry signal: it tells yo
FREE
Northstar Flow Candles MT5 is a free chart indicator for traders who use Heikin Ashi candles to review trend context. Its purpose is visual analysis, with candle states and optional markers on the MetaTrader 5 chart. This is a visual tool. It does not place trades or provide popup, push or email notifications. Chart context Five candle states: strong bullish, bullish, balanced, bearish and strong bearish. Context settings based on fast and slow exponential moving averages, ADX and ATR-normalize
FREE
QuantMatrix Candle Patterns is a free MetaTrader 5 indicator designed to identify classic candlestick formations directly on the chart. The indicator analyzes completed candles and detects recognized bullish, bearish and neutral price-action patterns. When a valid bullish or bearish formation is confirmed, the corresponding BUY or SELL signal is displayed on the following candle . This means the signal is only generated after the source pattern has been completed. The indicator also displays a c
FREE
PROMETHEUS TECHNICAN VERSION Free | By THE SONS A gift from The Sons — no strings, no trial, no expiry. Every trader deserves access to professional-grade market intelligence. That belief is why Prometheus Technical Version exists, and why it costs nothing. Consider it our handshake to the trading community. What You're Getting This is not a simplified tool dressed up as a gift. Prometheus Technican Version is a fully built, institutional-quality technical analysis indicator running a dual-model
FREE
RSI abcd
Francisco Gomes Da Silva
3.75 (4)
RSI ABCD Pattern Finder: Technical Strategy 1. How the Indicator Works Combines the classic RSI with automatic detection of ABCD harmonic patterns . Key Components Standard RSI (adjustable period) Peak and Trough Markers (arrows) ABCD Patterns (green/red lines) Overbought (70) and Oversold (30) Filters 2. MT5 Setup period = 14 ; // RSI period size = 4 ; // Maximum pattern size OverBought = 70 ; // Overbought level OverSold = 30 ; // Oversold level Filter = USE_FILTER_ YES ; // Confirmation filte
FREE
Follow The Line MT5
Oliver Gideon Amofa Appiah
4.6 (35)
This indicator obeys the popular maxim that: "THE TREND IS YOUR FRIEND" It paints a GREEN line for BUY and also paints a RED line for SELL. (you can change the colors). It gives alarms and alerts of all kinds. IT DOES NOT REPAINT and can be used for all currency pairs and timeframes. Yes, as easy and simple as that. Even a newbie can use it to make great and reliable trades. NB: For best results, get my other premium indicators for more powerful and reliable signals. Get them here: https://www.m
FREE
Sweep Liquidity
Nawal Kishor Yadav
5 (1)
Liquidity Sweep Pro v3.2 — Smart Money Liquidity Detection Professional indicator designed to detect institutional liquidity sweeps in real time. Identifies Buy-Side Liquidity (BSL) and Sell-Side Liquidity (SSL) sweeps with automatic Strong and Weak classification. Main Features: • Real-time detection of BSL and SSL sweeps • Strong vs Weak sweep classification based on wick ratio, body close, and volume • Built-in quality filters:    - Wick Ratio Filter (adjustable for Strong & Weak)    - Vo
FREE
Description: NR4 & NR7 Inside Bar Highlighter is an indicator that automatically detects price compression patterns based on a combination of NR4 or NR7 with an Inside Bar. The NR4 (Narrow Range 4) pattern identifies the candle with the smallest range among the last 4 bars, while NR7 considers the last 7. When this narrow-range condition occurs alongside an Inside Bar (a candle completely contained within the previous one), it often signals a low-volatility phase that may precede a strong breako
FREE
Color Trend
Bruno Goncalves Mascarenhas
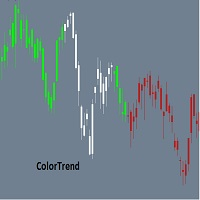
Combining the best of Price Action , Directional Movement , and Divergence / Convergence analysis, the Candle Color Trend is the easy and reliable way to identify the direction of the trend. The indicator automatically paints the candles according to the premise that the upward trend is defined by prices that form a series of ascending tops and bottoms. On the other hand, the downward trend is defined by prices that form a series of descending tops and bottoms. Color Trend is certainly one of
FREE
MACD Enhanced
Nikita Berdnikov
4 (4)
Introducing the MACD  Enhanced – an advanced MACD (Moving Average Convergence Divergence) indicator that provides traders with extended capabilities for trend and momentum analysis in financial markets. The indicator uses the difference between the fast and slow exponential moving averages to determine momentum, direction, and strength of the trend, creating clear visual signals for potential entry and exit points. Attention! To achieve the best results, it is recommended to adapt the indicator
FREE
Buyers of this product also purchase
Trend Sniper X
Sarvarbek Abduvoxobov
4.86 (44)
Trend Sniper X is a multi-timeframe trend-following indicator for MetaTrader 5 that helps traders identify trend direction and potential reversal points with clarity and precision. for MT4: https://www.mql5.com/en/market/product/193245 Price Information: The current price is promotional and is subject to change as upcoming updates and new features are released. Bonus Offer: To get the FREE Auto-Trade Assistant EA for this indicator, please message the author after purchasing. Code2Profit Channe
A new King in town - Indicator + Order management indications(tp1+tp2+tp3) + Optional Telegram Signal sender   INCLUDED (FREE) + Bonus EA Robot ( FULL TRADING  and SIGNAL SYSTEM ) Our best EA for Gold: Gold Slayer TRY > Reversion Queen  Expert advisor >JOIN Community Channel < NEW Free Automation EA link < click here ( disclaimer: this is new and still on testing and phase , use at your risk on demo) Free Telegram Bridge < click here  This indicator includes an advanced Strategy, a trading sys
Smart Trend Trading System — MetaTrader 5 Message me on MQL5 after purchase to receive Smart Universal Expert Advisor for FREE, plus the online course, PDF manual, and private group access. STTS brings trend direction, entry and exit signals, reversal zones, and important price levels together on your chart. Follow the system manually, or connect a separate compatible EA for automated execution using your chosen settings. ONE SYSTEM. FOUR TRADING APPROACHES. STTS organizes its trading approaches
Zoryk Gold
Reda El Koutbane
4.78 (18)
discount ends SOON next price 69 $ ZORYK — Advanced XAUUSD Signal System for MetaTrader 5 You know the feeling. You spend time analyzing gold. You wait for the entry. You finally open the trade, and price immediately moves against you. You close too early, move the Stop Loss or hesitate for a few seconds. Then the market reaches the exact destination you originally expected without you. The direction was not always the problem. The real problem was uncertainty. You did not know exactly where th
M5 Sniper
MeanFX
5 (4)
Get your trading edge in the line of sight M5 Sniper   is a new indicator by MeanFX. It combines   precise trading signals   with   adaptive TP/SL levels   - creating best possible statistical trades as a result! The price increases every 5 purchases, the next price is 79$ Message me after purchase to receive tips/guide and bonus EA plus trading methodology Auto Optimisation only works on LIVE chart , needs data feed >JOIN Community Channel < What makes it stand out?   Proven statistical per
Entry Points Pro shows you where to enter, where to put the stop and what lot to trade — before you place the order. PRICE Now 199 USD: 10 copies at this price, then 249 USD. The final price is 349 USD. I make my money trading the markets, and I show it, so I don't need to sell this indicator to everyone. It is a tool for traders who think for themselves, not a magic button. The arrow appears when the candle closes and does not repaint. Two settings: your deposit and your risk per trade. Chec
Ultra Indicator
Ihor Otkydach
5 (1)
ULTRA is a technical indicator that operates on an “all-in-one” basis—it independently analyzes the market, generates trading signals, displays levels for setting stop-loss orders, and suggests when to close trades to lock in profits or minimize losses. In other words, it doesn't matter if you don't know how to analyze the market, determine levels—where to set your stop-loss—or struggle with money management. ULTRA will do all of that for you! BUYER BONUS: After purchasing the ULTRA indicator, s
Gann Made Easy   is a professional and easy to use Forex trading system which is based on the best principles of trading using the theory of W.D. Gann. The indicator provides accurate BUY and SELL signals including Stop Loss and Take Profit levels. You can trade even on the go using PUSH notifications. PLEASE CONTACT ME AFTER PURCHASE TO GET TRADING  INSTRUCTIONS   AND GREAT EXTRA INDICATORS  FOR FREE! Probably you already heard about the Gann trading methods before. Usually the Gann theory is a
SuperScalp Pro
Van Minh Nguyen
4.54 (37)
SuperScalp Pro - Professional Multi-Layer Confluence Scalping System SuperScalp Pro is an advanced scalping indicator that upgrades the classic Supertrend with multiple intelligent confirmation filters. It helps you identify higher-probability Buy/Sell opportunities while significantly reducing false signals. Clear Buy and Sell arrows appear directly on the chart, along with automatic ATR-based Stop Loss and Take Profit levels calculated in real time. After purchase, please message me on MQL5 to
GoldenX Entry MT5
VividMind Digital Solutions
5 (17)
Price will increase by $20 every 10 buyers to maintain premium value. After purchase, contact via   MQL5 inbox   to receive your buyer kit and bonus. You have probably tested dozens of indicators before. But we are not here to be “just another signals indicator.” Behind GoldenX Entry is intensive research & development focused on building sophisticated algorithms designed to adapt to the real behavior of every instrument — not generic signals recycled everywhere else. From advanced Auto Optim
Gold Trend Coach MT5
Cristhian Alexander Gaibor Cuasquer
4.27 (11)
Non-repainting buy and sell signals for gold (XAUUSD) on MetaTrader 5. Every signal comes with a stop loss and three take profits. A Smart Money Concepts filter with BOS and CHoCH, so you trade with the structure, not against it. A live Mentor on your panel that guides every step from the entry to TP3. And alerts straight to your phone and your own Telegram channel. That is Gold Trend Coach. Never trade alone again. FREE BUYER KIT with your purchase: 1. Telegram Alert Bridge: your signals go to
SMC Intraday Formula
VividMind Digital Solutions
5 (26)
Secure the Lowest Price Today. After purchase, contact via   MQL5 inbox   to receive your buyer kit and bonus. Let's be honest first. No indicator will make you profitable on its own. If someone tells you otherwise, they're selling you a dream. Every indicator that shows perfect buy/sell arrows can be made to look flawless — just zoom into the right window of history and screenshot the winners. We won't do that. SMC Intraday Formula is a tool. It reads the market structure for you, maps the hig
Boba Analysis Suite
Trade Ready Solutions LLC
5 (2)
Boba Analysis Suite Boba Analysis Suite is an analytical indicator for MetaTrader 5. It brings market structure, relevant price zones and broader market context together in a single chart view. Developed through practical experience as a trader and trading coach, it supports a structured analysis process: assessing market direction, identifying important levels and considering multiple timeframes together. Analysis in Context Individual signals gain meaning through context. Boba Analysis Suite h
Gold Entry Sniper
Tahir Mehmood
5 (23)
Gold Entry Sniper – Professional Multi-Timeframe ATR Dashboard for Gold Scalping & Swing Trading Gold Entry Sniper is a cutting-edge MetaTrader 5 indicator designed to give traders precise buy/sell signals for XAUUSD and other symbols, powered by ATR Trailing Stop logic and a multi-timeframe analysis dashboard . Built for both scalpers and swing traders, it combines real-time market direction , dynamic stop levels , and professional visual dashboards to help you identify high-probability gold en
Welcome to Entry In The Zone & SMC Multi Timeframe —  COMPLETE SMC ANALYSIS SYSTEM — ALL IN ONE INDICATOR Entry In The Zone & SMC Multi Timeframe  An indicator designed for market analysis based on Smart Money Concepts (SMC), displaying Market Structure, Key Zones (Order Blocks, Supply & Demand Zones, and Fair Value Gaps), Liquidity, and real-time BUY / SELL signals. It supports both Single-Timeframe and Multi-Timeframe analysis, along with the Confluence at Zone feature, which helps you evaluat
FX Power MT5 NG
Daniel Stein
5 (33)
FX Power: Analyze Currency Strength for Smarter Trading Decisions Overview FX Power is your go-to tool for understanding the real strength of currencies and Gold in any market condition. By identifying strong currencies to buy and weak ones to sell, FX Power simplifies trading decisions and uncovers high-probability opportunities. Whether you’re looking to follow trends or anticipate reversals using extreme delta values, this tool adapts seamlessly to your trading style. Don’t just trade—trade
M1 Sniper MT5
Oleg Rodin
5 (7)
M1 SNIPER  is an easy to use trading indicator system. It is an arrow indicator which is designed for M1 time frame. The indicator can be used as a standalone system for scalping on M1 time frame and it can be used as a part of your existing trading system. Though this trading system was designed specifically for short-term trading, it still can be helpful for all traders. This trading system can be used with any forex pair and time frame, though lower time frames are recommended from M1 up to M
FiboSniper Pro
Van Minh Nguyen
5 (4)
FiboSniper Pro - Multi-Filter Fibonacci System with Auto SL/TP and Control Panel FiboSniper Pro is a technical indicator that combines dynamic Fibonacci Envelopes with multiple confirmation filters to generate selective Buy and Sell signals. Fibonacci levels are calculated from Moving Average and ATR, then filtered by ADX, EMA, RSI, ATR, Volume, Time and Candle structure. The indicator displays automatic ATR-based Stop Loss and Take Profit levels directly on the chart, along with an interactive
Auto Optimized SpeedAngle is an institutional-grade momentum vectoring system that eliminates curve-fitting through continuous Walk-Forward Optimization (WFO). Rather than relying on static inputs that degrade when market regimes shift, the indicator dynamically recalibrates its parameters using Out-of-Sample (OOS) validation, ensuring the displayed signals represent genuine statistical edges rather than historical anomalies. By shifting the focus from subjective visual angles to normalized, qua
SQN Max indicator for MT5 by ITC
Renaud Herve Francois Candel
Sqn Max Indicator Sqn Max is an exclusive indicator to trade the market with high effectiveness. The indicator is based on price action, volatility and trend. This indicator is as simple as possible but not too simple. The indicator can generate alerts to ease the trading process. You don't have to stay all day in front of your screen. The indicator can be used with any class of assets and with any time frame. It is possible to achieve better results trading our list of selected assets. We achi
Smc Pro ToolKit
Talal N Z Aljarusha
5 (14)
SMC PRO TOOLKIT — SMART MONEY ANALYSIS & STRUCTURED TRADE PLANNING SMC Pro ToolKit is a professional Smart Money Concepts analysis workspace for MetaTrader 5. It combines market structure, multi-timeframe analysis, institutional price zones, setup evaluation, confirmation tools, volume context, alerts, and risk planning inside one organized chart environment. One workspace. Multiple layers of confirmation. One structured trading plan. OPEN COMPLETE USER GUIDE MULTI-CONDITION SETUP ENGINE At
SIO Oscillator: Self-Optimizing Semivariance Imbalance Oscillator Buy the indicator and get the Expert Advisor based on it for FREE. Most oscillators treat all price movement the same. SIO separates upside and downside market pressure and measures the imbalance between them, showing which side is really in control: buyers or sellers. When the imbalance reaches an extreme, SIO prints a clear signal with entry, Stop Loss and Take Profit levels. What makes SIO different is that it doesn’t rely on f
Power Candles MT5
Daniel Stein
4.58 (12)
Power Candles - Self-Optimizing Strength Indicator Strength usually lives in a sub-window. The line runs below, the candle above, and your eye keeps connecting the two. Power Candles puts the strength into the candle itself, colored from dark red to dark green, so the chart reads at a glance and the sub-window stays closed. The indicator also finds its own settings for the symbol and timeframe in front of you. One click on [ Apply Best ] draws entry, Stop Loss and Take Profit at the exact prices
Atomic Analyst MT5
Issam Kassas
4.51 (65)
Atomic Analyst — MetaTrader 5 Message me on MQL5 after purchase to receive Smart Universal Expert Advisor for FREE, plus the online course, PDF manual, and private group access. Atomic Analyst brings price action, trend direction, entry and exit signals, Stop Loss and multiple Take Profit levels together on your chart. SEE THE SIGNAL. UNDERSTAND THE SETUP. Atomic Analyst organizes its analysis into clear visual information: • Buy and sell arrows to identify potential entries. • Stop Loss and mul
Unix Scalper
Issam Kassas
4 (4)
Unix Scalper — MetaTrader 5 Message me on MQL5 after purchase to receive Smart Universal Expert Advisor for FREE, plus the online course, PDF manual, and private group access. Find the setup. See the plan. Choose how to trade it. UNIX Scalper brings market analysis, BUY/SELL/WAIT decisions and Entry, Stop Loss, TP1 and TP2 levels into one organized panel. SEE THE SIGNAL AND THE PLAN • Clear decisions: BUY, SELL or WAIT. • Defined levels: Entry, Stop Loss, TP1 and TP2. • Multi-timeframe overvie
Tokyo mt5 Indicator
Vasiliy Strukov
5 (15)
Tokyo Indicator provides a clear visual overview of trend direction, potential trading signals, and market conditions. Its colour-coded, stepped trend line distinguishes bullish phases in blue from bearish phases in magenta. Matching directional arrows highlight potential buying and selling opportunities when the displayed trend changes. An integrated dashboard brings together the current signal, market bias, momentum, volatility, and signal quality in one convenient view. This allows traders t
Astral Structure
Ottaviano De Cicco
Astral Structure Assess the setup. See the initial plan. Launch Special - $99. $149 after launch. A structure setup raises several questions at once: does the wider view agree, where is the stop reference, and how are targets defined? Astral Structure brings those questions into one workspace for discretionary traders who build their decisions around market structure. Focus on the relevant setup. Review the latest eligible setup, its direction and qualification together. See the wider agreement.
Crystal Heikin Ashi Signals
Muhammad Jawad Shabir
5 (5)
Crystal Heikin Ashi Signals—Professional Trend & Signal Detection Indicator Advanced Heikin Ashi Visualization with Intelligent Signal System for Manual & Automated Trading Final Price: $149 ---------> Price goes up $10 after every 10 sales . Limited slots available — act fast . Overview User Guide PDF Crystal Heikin Ashi Signals is a professional-grade MetaTrader 5 indicator that combines pure Heikin Ashi candle visualization with an advanced momentum-shift detection system. Designed for both m
Trend Catcher ind mt5
Ramil Minniakhmetov
5 (18)
TREND CATCHER INDICATOR Trend Catcher Indicator analyzes market price movements, using a combination of the author’s proprietary and customized adaptive trend-analysis indicators.  It identifies the true market direction by filtering out short-term noise and focusing on underlying momentum strength, volatility expansion, and price structure behavior.  It also uses a combination of smoothing and trend-filtering customized indicators such as moving averages, RSI, and volatility filters.   Real ope
Multi Currency Strength and Momentum Indicator MT5 Dynamic Forex28 Navigator is the evolution of our long-time, popular indicators, combining the power of five in one: Advanced Currency Strength28 Indicator (700 reviews) Advanced Currency IMPULSE with ALERT (530 reviews) Currency Strength EXOTICS GOLD Impulse with Alert CS28 Combo Signals (recent Bonus) No need to buy four indicators and stack them on your charts. All of it is merged into one powerful indicator: the strength of the 28 Forex pair
More from author
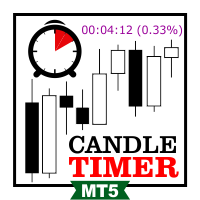
Candle Timer Countdown shows how much time is left to close the current candle. It updates every second, even when no new tick arrives, using the broker server clock. Want the same countdown on your order ticket? OCO Panel PRO shows it in its footer, next to one-click orders and saved OCO exits. WHAT IT SHOWS Time left as mm:ss, h:mm:ss, or days on D1, W1 and MN. "Market closed" when the symbol is outside its trading session. Daily % change, symbol and timeframe (each one can be turned on or off
FREE
Order Book Heatmap B3 PRO: visual order book and live liquidity heatmap for B3 futures and stocks in MetaTrader 5, with alerts for big lots, pulled lots and strong imbalance. WHAT IT SHOWS Every live level your broker sends (up to 64 per side), drawn on the right side of the chart and aligned to the price scale. Extended book: levels seen earlier beyond the live depth stay on the book, faded, with the last size seen. They are forgotten after 120 minutes (adjustable). Liquidity heatmap behind the
MACD Intraday Trend
JETINVEST
4.81 (57)
Free Fibonacci-tuned MACD for intraday trends. Want alerts and the full toolkit? MACD Intraday Trend PRO MACD Intraday Trend is an Indicator developed through an adaptation made of the original MACD created by Gerald Appel in the 1960s. Through years of trading it was observed that by changing the parameters of the MACD with Fibonacci proportions we achieve a better presentation of the continuity of the trend movements, making that it is possible to more efficiently detect the beginning and end
FREE
Candle Timer Countdown shows how much time is left to close the current candle. It updates every second, even when no new tick arrives, using the broker server clock. WHAT IT SHOWS Time left as mm:ss, h:mm:ss, or days on D1, W1 and MN. "Market closed" when the symbol is outside its trading session. Daily % change, symbol and timeframe (each one can be turned on or off), and your own text before the timer. POSITION Any corner, top or bottom center, or next to the current price. Drag it with the m
FREE
Order Book B3: a free visual order book for B3 futures and stocks in MetaTrader 5, drawn on the right side of the chart and aligned to the price scale. WHAT IT SHOWS The 4 best buy levels and the 4 best sell levels of the book, with lot sizes. Big lots highlighted in gold. Buy/sell imbalance bar at the top of the book. Two layouts: Aligned (each level at its price on the chart) and Ladder (fixed rows centered on the spread). Auto picks the one that fits the chart zoom. Light and dark chart backg
FREE
Free Tabajara setup for B3. Trading WIN? See our Trend WIN B3 robot. Setup Tabajara was created by a Brazilian trader known as  "The OGRO of Wall Street" . The idea of this setup is to indicate to the trader the current trend of prices and  the type of operation should be looked for in the graph. Operation It does this through the positioning of the closing of the candles and the  vwap until 10:40am and after by the arithmetic mean of 20 periods painting the candles in 4 possible colors: Green
FREE
Up to 7 Fibonacci pivot levels per side. For graded supply/demand zones with retest count: Supply Demand RSJ PRO Pivot Point Fibo RSJ draws the daily pivot point and its support and resistance levels calculated with Fibonacci ratios. It plots up to 7 support levels and 7 resistance levels from the previous day's high, low and close. Traders use these levels as reference areas to plan entries, exits and stop placement during the day. Features Up to 7 levels of support and 7 levels of resistance F
FREE
Candle Counter RSJ prints the number of each candle counted from the first candle of the day. The first candle of the day is number 1 and each new candle adds 1 to the count. Input Parameters Show even, odd or all numbers Distance between the candle and the number Text font size Text font color How to use Counting candles helps when a setup depends on the number of bars since the market opened, for example a rule that only takes trades after the third candle of the day, or a review of what happe
FREE
Supply Demand RSJ Zones draws supply and demand zones on any symbol and timeframe, with two strength levels. WHAT IT DOES Finds the turning points of price and turns them into supply and demand zones. Strong zones are drawn in the full color: the most significant zones on the chart. Weak zones are drawn in a faded tone: zones of lower significance. Zones that are no longer valid are removed. Overlapping zones are merged. Supply zones are red and demand zones green by default. Zones are recalcula
FREE
Weis Waves RSJ
JETINVEST
4.64 (11)
Weis Waves RSJ adds up the volume of each price wave and plots it as a histogram of cumulative volume for the alternating up and down waves. This lets you compare the effort (volume) of each wave with its result (price progress) and see when a move is supported by volume or is losing strength. How to read it Each bar of the histogram is the total volume traded during one price wave. When a trend is healthy, the waves in the direction of the trend usually show more volume than the corrections. Wh
FREE
Daily Volume Profile RSJ: free volume profile of the current day for any symbol, with POC, VAH and VAL. WHAT IT SHOWS - Volume profile of today, updated during the day. - POC (price with the most volume), VAH and VAL (value area, 70% by default) with labels. - Value area rows highlighted. - Small panel with today's POC, VAH, VAL and total volume. - Lines and texts adapt to light and dark chart backgrounds. DATA Built from 1-minute bars: real volume when the feed has it (stocks, futures), tick
FREE
Delta Aggression Volume shows, candle by candle, whether aggressive buyers or aggressive sellers traded more, on symbols with real trades such as B3 and CME futures. WHAT IT DOES Computes the aggression delta of each candle: volume of aggressive buys minus volume of aggressive sells. Plots the balance of every candle in a separate window, colored by the side that won. REQUIREMENTS Exchange symbols with real trades: B3 futures and stocks (WIN, WDO, PETR4 …) and CME futures (ES, NQ, CL, GC and the
FREE
Tabajara Ogro
JETINVEST
4.77 (13)
Free Tabajara setup for B3. Trading WIN? See our Trend WIN B3 robot. The Tabajara setup was created by a Brazilian trader known as "The OGRO of Wall Street". It shows the current trend and the type of trade to look for on the chart. How it works The indicator compares the closing price with the 20-period simple moving average and paints the candles in 4 colors: Green: price rising in an uptrend (look for buy entries) Black: price correcting in an uptrend (look for buy entries) Red: price falling
FREE
VWAP Fibo Bands RSJ
JETINVEST
4.83 (12)
VWAP Fibo Bands RSJ draws the VWAP of the selected period and builds bands around it using Fibonacci proportions. The indicator plots 10 band levels around the VWAP. The bands show how far price has moved from the volume weighted average price and can be used as reference levels to plan entries, exits and stops. The bands are easiest to read on timeframes of 30 minutes and below. Inputs Calculation Volume Type Calculation Price Type VWAP Period Time Each band is drawn at a fixed Fibonacci distan
FREE
MACD Intraday Trend PRO shows when an intraday trend starts and when it runs out of strength, using a MACD re-tuned with Fibonacci proportions. Works on any symbol, any timeframe and on Renko charts. The free version is rated 4.8 by 56 traders. PRO is the full toolkit built on the same engine. What it does Fibonacci-proportioned MACD settings that keep trend moves readable instead of choppy Highlights trend start and trend exhaustion on the indicator window Same logic as the free MACD Intraday T
Free Fibonacci-tuned MACD for intraday trends. Want alerts and the full toolkit? MACD Intraday Trend PRO MT4 MACD Intraday Trend is an Indicator developed through an adaptation made of the original MACD created by Gerald Appel in the 1960s. Through years of trading it was observed that by changing the parameters of the MACD with Fibonacci proportions we achieve a better presentation of the continuity of the trend movements, making that it is possible to more efficiently detect the beginning and
FREE
Aggression Wave RSJ adds up the difference between buy and sell aggression candle after candle and plots it as waves, so you can see which side is controlling the order flow during the day. WHAT IT DOES Computes the aggression delta of each candle (aggressive buys minus aggressive sells) and accumulates it into waves. Colors each wave by direction, so a change of control between buyers and sellers is visible at a glance. Draws a signal line over the waves to show the direction of the flow. REQUI
FREE
Up to 7 Fibonacci pivot levels per side. For graded supply/demand zones with retest count: Supply Demand RSJ PRO Pivot Point Fibo RSJ draws the daily pivot point and its support and resistance levels calculated with Fibonacci ratios. It plots up to 7 support levels and 7 resistance levels from the previous day's high, low and close. Traders use these levels as reference areas to plan entries, exits and stop placement during the day. Features Up to 7 levels of support and 7 levels of resistance F
FREE
Vwap RSJ
JETINVEST
4.82 (11)
VWAP RSJ plots the hourly, daily, weekly and monthly VWAP lines on the same chart. Large institutional buyers and funds use the VWAP to enter and exit positions with the smallest possible market impact. They usually try to buy below the VWAP and sell above it, which tends to pull price back toward the average. This indicator combines the four VWAP periods so you can see where price stands against each of them. How to read it Each VWAP line starts again at the beginning of its period: the hourly
FREE
Volume By Color RSJ paints the volume bar in a darker color when the traded volume is above its own moving average, so candles with unusual activity stand out. An optional four-color mode shows the strength of each candle's volume in steps. By default the indicator compares each bar with the 20-period simple average of the volume. The average type and period can be changed in the inputs. How to use The colored bars make it easy to spot breakouts, rejections and climax candles that happen with vo
FREE
Volume By Color RSJ paints the volume bar in a darker color when the traded volume is above its own moving average, so candles with unusual activity stand out. An optional four-color mode shows the strength of each candle's volume in steps. By default the indicator compares each bar with the 20-period simple average of the volume. The average type and period can be changed in the inputs. How to use The colored bars make it easy to spot breakouts, rejections and climax candles that happen with vo
FREE
MACD Intraday Trend PRO is an Indicator developed through an adaptation made of the original MACD created by Gerald Appel in the 1960s. Through years of trading it was observed that by changing the parameters of the MACD with Fibonacci proportions we achieve a better presentation of the continuity of the trend movements, making that it is possible to more efficiently detect the beginning and end of a price trend. Due to its efficiency in detecting price trends, it is also possible to identify ve
JET Trade Assistant PRO is a complete trade panel and trade manager for MetaTrader 4. Choose your risk, draw the trade on the chart and send it in one click — the panel calculates the volume and manages the trade until the last exit. Same panel, inputs and texts as the MetaTrader 5 version 3.00. HIGHLIGHTS Reverse: close the open side of the symbol and open the opposite one in one click (or Shift + V), confirmed by a second click; mirrored stop loss and take profit; same volume or recalculated f
B3 AND CME FUTURES (WIN, WDO, B3 STOCKS, ES, NQ, CL, GC) Aggression Wave PRO adds up, candle after candle, the difference between buy and sell aggression since the start of the day and plots it as a wave, so you can see which side has been controlling the order flow during the session. It needs a broker that delivers the real trades of the symbol with their aggressor side (buy or sell). Forex, CFD and most crypto feeds have no trades, so on a live chart of these symbols the window stays empty. U
B3 AND CME FUTURES (WIN, WDO, B3 STOCKS, ES, NQ, CL, GC) Delta Aggression Volume PRO shows, candle by candle, whether aggressive buyers or aggressive sellers traded more, and marks the candles where aggression and price disagree. It needs a broker that delivers the real trades of the symbol with their aggressor side (buy or sell). Forex, CFD and most crypto feeds have no trades, so on a live chart of these symbols the window stays empty. Use the free Delta Aggression Volume to see the basic per-
Supply Demand RSJ PRO draws supply and demand zones automatically, grades each one (Weak, Strong, Verified, Proven) and counts how many times price has retested it. Any symbol, any timeframe. What it does Supply zones: where selling overwhelmed buying and pushed price down Demand zones: where buying overwhelmed selling and pushed price up Zone grading in 4 levels: Weak, Strong, Verified, Proven Labels with zone type and retest count, so you see which levels the market keeps respecting Zone filte
Session & Killzones PRO draws the Asia, London and New York sessions and the ICT killzones on your chart, with the range of each session, previous day high/low and ADR projections. Daylight saving is handled per market, so the boxes stay in the right place all year without changing any setting. WHAT IT DOES Session boxes: Asia (Tokyo 09:00-18:00), London (08:00-17:00) and New York (08:00-17:00), each in its own local time US and UK daylight saving applied separately: the 2 to 3 weeks a year when
FVG and Structure PRO marks market structure (BOS / CHoCH), fair value gaps, order blocks and equal highs/lows on your chart: the price action concepts used by ICT and Smart Money traders. Every element is confirmed on a closed candle, so nothing on the chart is redrawn after it appears. WHAT IT DOES Swing highs and lows with adjustable strength; BOS (continuation) and CHoCH (change of character) drawn on candle close Optional HH / HL / LH / LL labels on every swing Fair value gaps (three-candle
Want more? Upgrade to JET Trade Assistant PRO — partial exits with drag-and-drop lines, 4 break-even levels, 8 trailing stops, hidden stops, virtual orders, prop firm rules, day breakeven line and statistics. Trade Panel and Risk Manager PRO places and manages orders from the chart, with the lot size calculated from the risk you choose. Type the risk in percent and click BUY or SELL: stop loss, take profit and lot size are set in one step. Or drag the entry, stop and target lines and the panel c
Prop Firm Risk Guard PRO watches your whole account and enforces the limits of a prop firm challenge or of your own risk plan. When a limit is hit, it closes every position, deletes pending orders and keeps the account flat until the next trading day. WHAT IT DOES Daily loss limit, measured from the balance at the start of the trading day (or the higher of balance and equity), with open profit and loss included. Maximum drawdown: static from the initial balance, or trailing from the highest bala
Filter:
No reviews
Reply to review