Advanced MTF High Low
- Indicators
- Version: 1.0

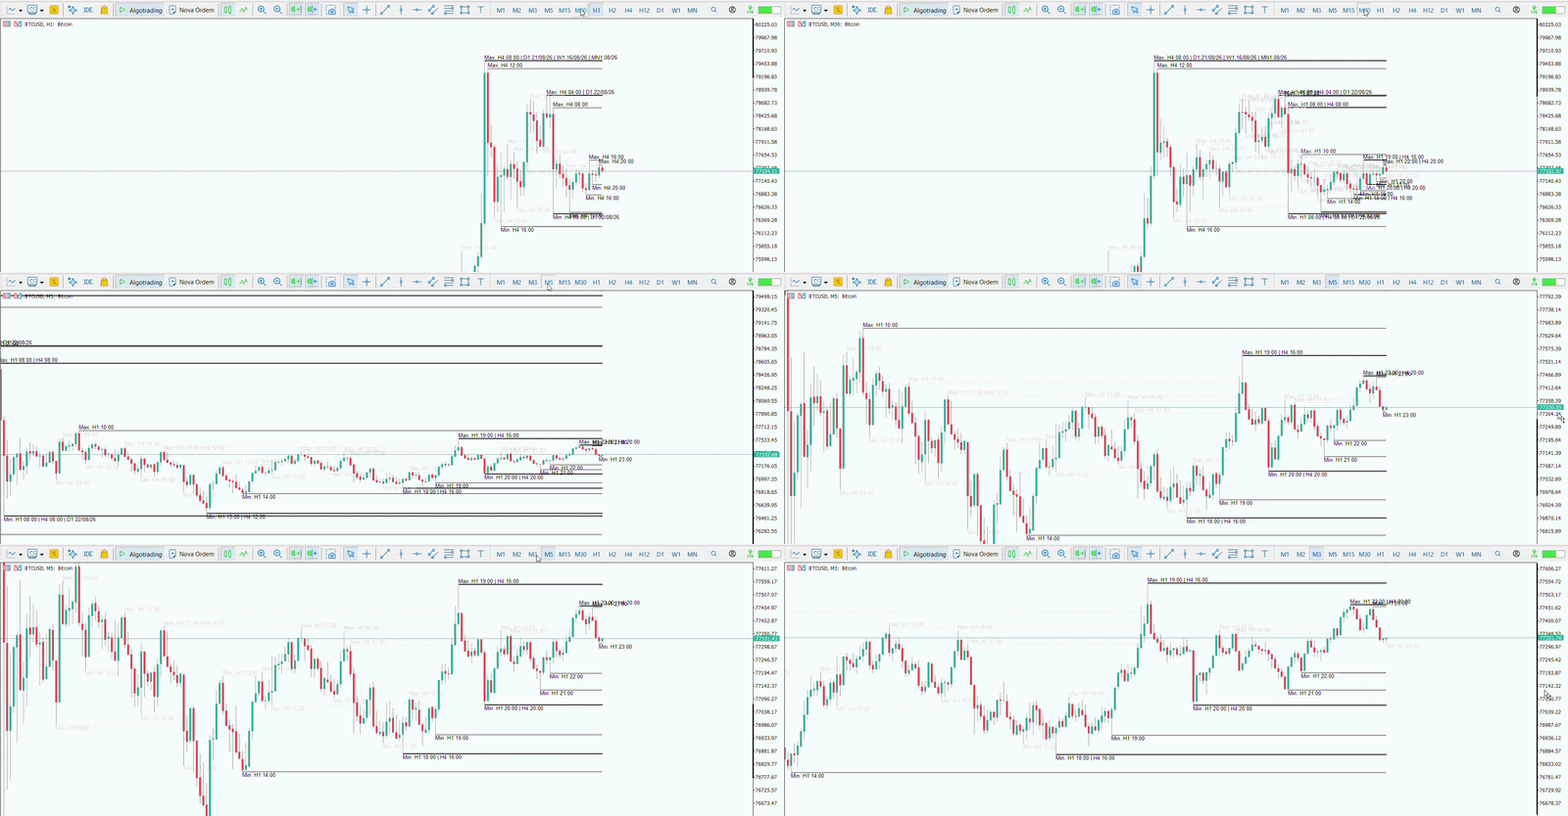
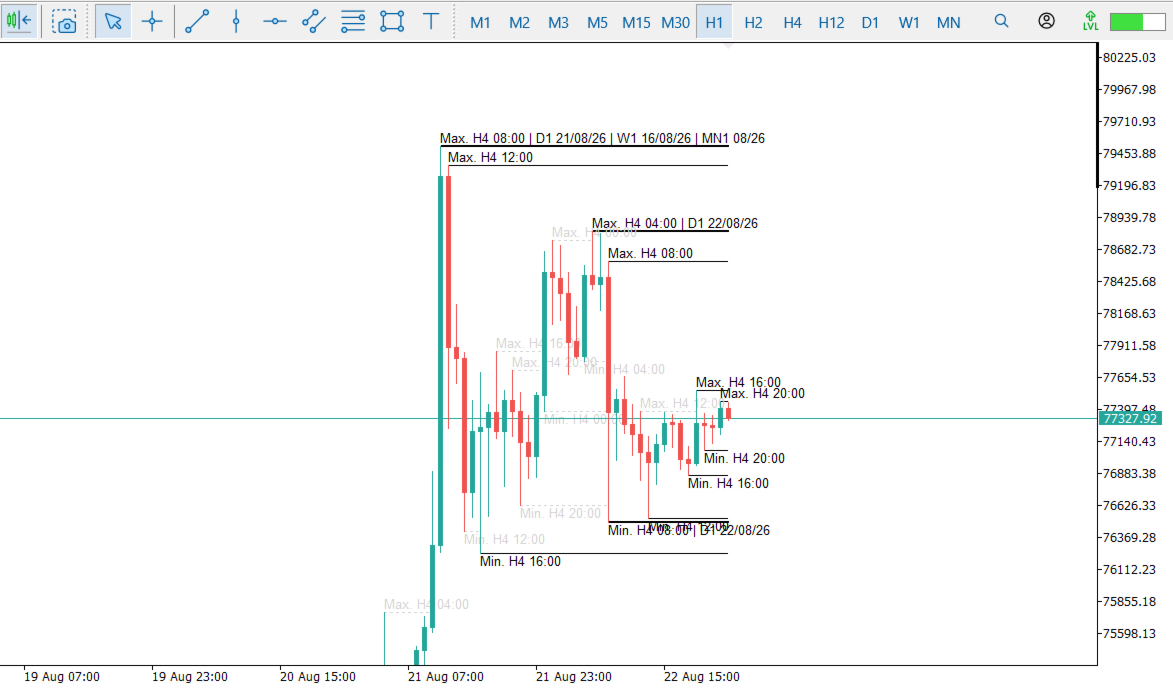
Advanced MTF High Low is a multi-timeframe structural analysis indicator that automatically identifies the most relevant highs and lows from different periods (Month, Week, Day, H4, H1, among others) and projects these levels directly onto the current chart in lower timeframes.
The indicator was developed to help traders quickly locate important institutional support and resistance zones by using the actual extremes of higher timeframes. The levels remain visible until they are mitigated by price, providing a clear view of liquidity and market structure.
Main Features
- Automatic detection of highs and lows from multiple timeframes.
- Simultaneous display of monthly, weekly, daily, and intraday levels.
- Visual identification of the origin of each level (source timeframe).
- Dynamic and efficient updates with low CPU consumption.
- Intelligent mitigation system that removes levels already tested or broken by price.
- Compatible with any asset and timeframe in MetaTrader 5.
- Configurable hotkey to instantly show or hide all indicator levels (currently the N key).
Confluence System
The indicator automatically identifies when two or more timeframes have highs or lows very close to each other, creating areas of greater structural relevance.
Thin Lines
- Represent highs or lows belonging to only one higher timeframe.
- Example: only the H4 high or only the Daily low.
Thick Lines
- Represent confluence regions where two or more highs or lows from different timeframes are concentrated on the same candle of a lower timeframe.
- Example: a weekly high near a monthly high, or a daily low near an H4 low.
These confluence regions often have greater operational importance because they indicate areas observed simultaneously by participants from different market horizons.