Reversal Probability MT4
- Indicators
-
Agus Santoso
 DISCLAIMER ON : The author of EA will not be held responsible for your losses or problems of any kind if the EA is directly or indirectly responsible for any losses.
Our software is provided “as is”, without any warranty or condition of any kind, express, implied or statutory. - Version: 1.0
- Activations: 5
MQL5 Blogs = https://www.mql5.com/en/blogs/post/775942
MT4 Version = https://www.mql5.com/en/market/product/196315
MT5 Version = https://www.mql5.com/en/market/product/196316
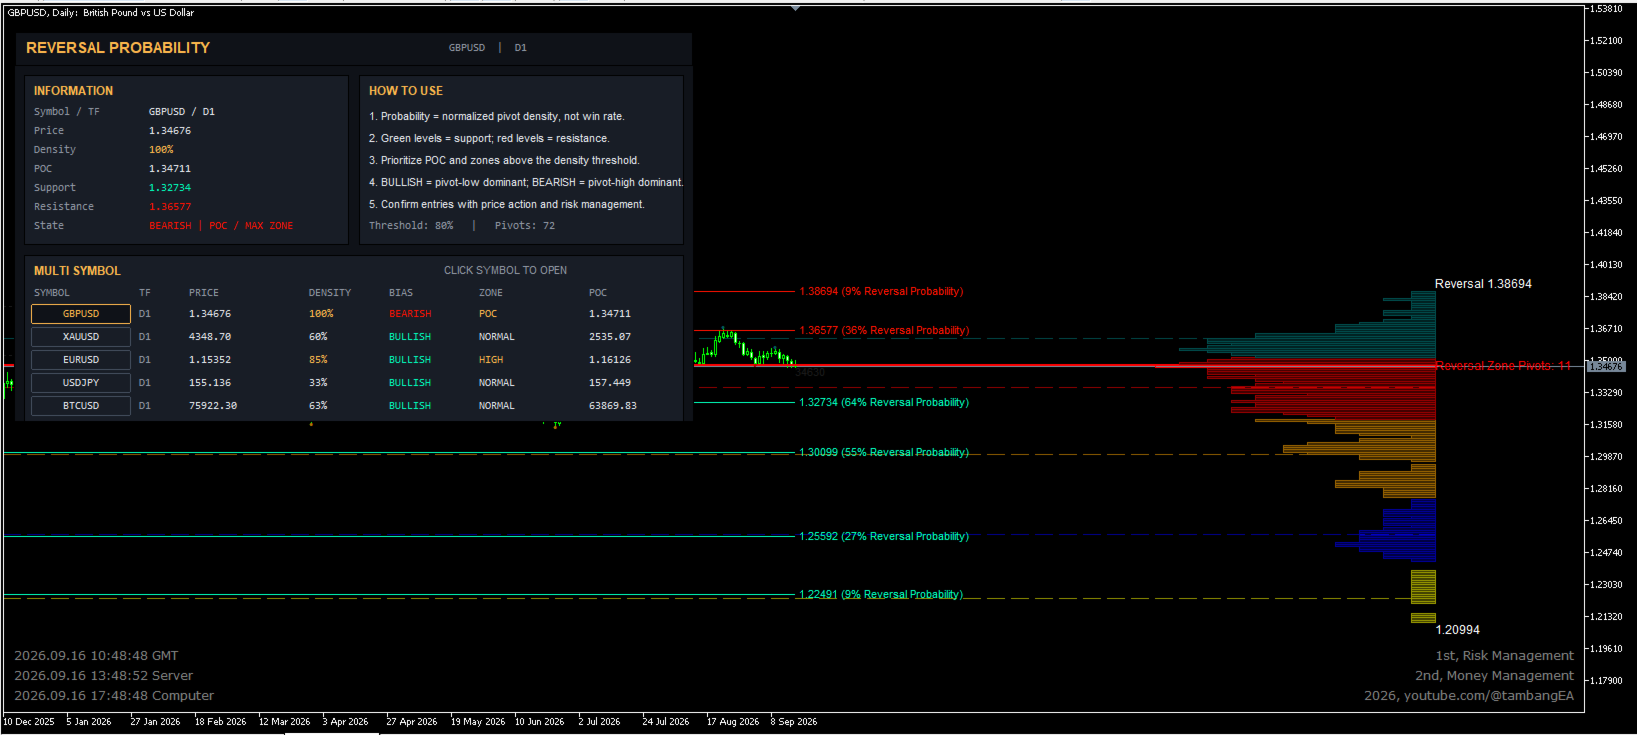
Reversal Probability is an advanced market-analysis indicator designed to identify price areas where historical turning points are concentrated.
Instead of relying on a single support or resistance level, the indicator builds a dynamic Reversal Probability from confirmed market pivots and organizes them into meaningful price zones. This allows traders to see where the market has historically shown a higher concentration of reversal activity and where current price is positioned relative to those areas.
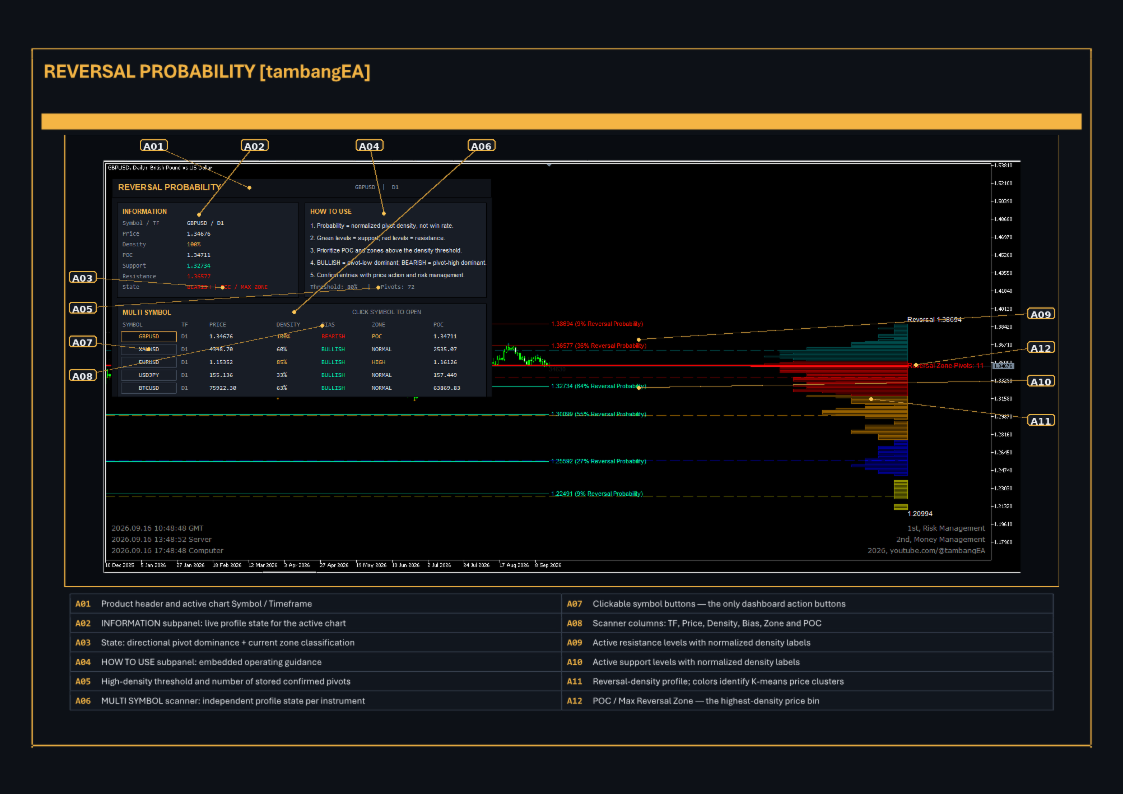
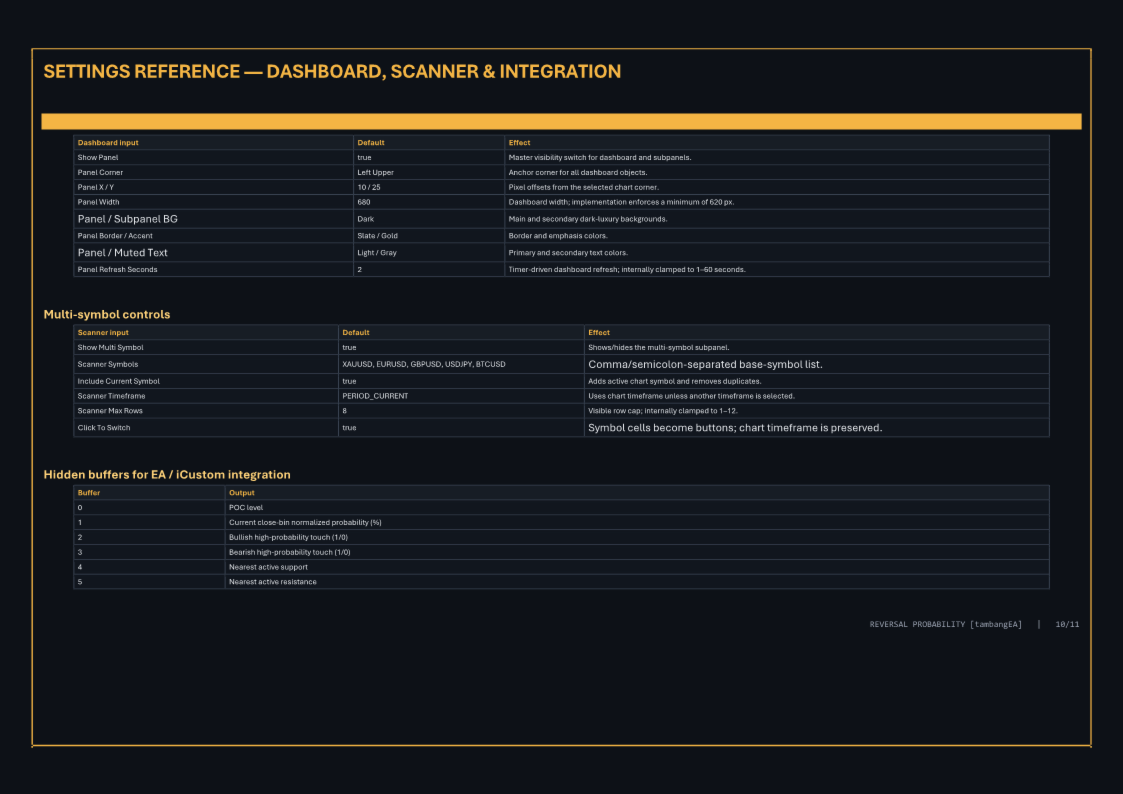
The indicator combines pivot analysis, price-density profiling, dynamic support and resistance, cluster visualization and a professional multi-symbol dashboard in one trading workspace.
Key Features
Reversal Probability
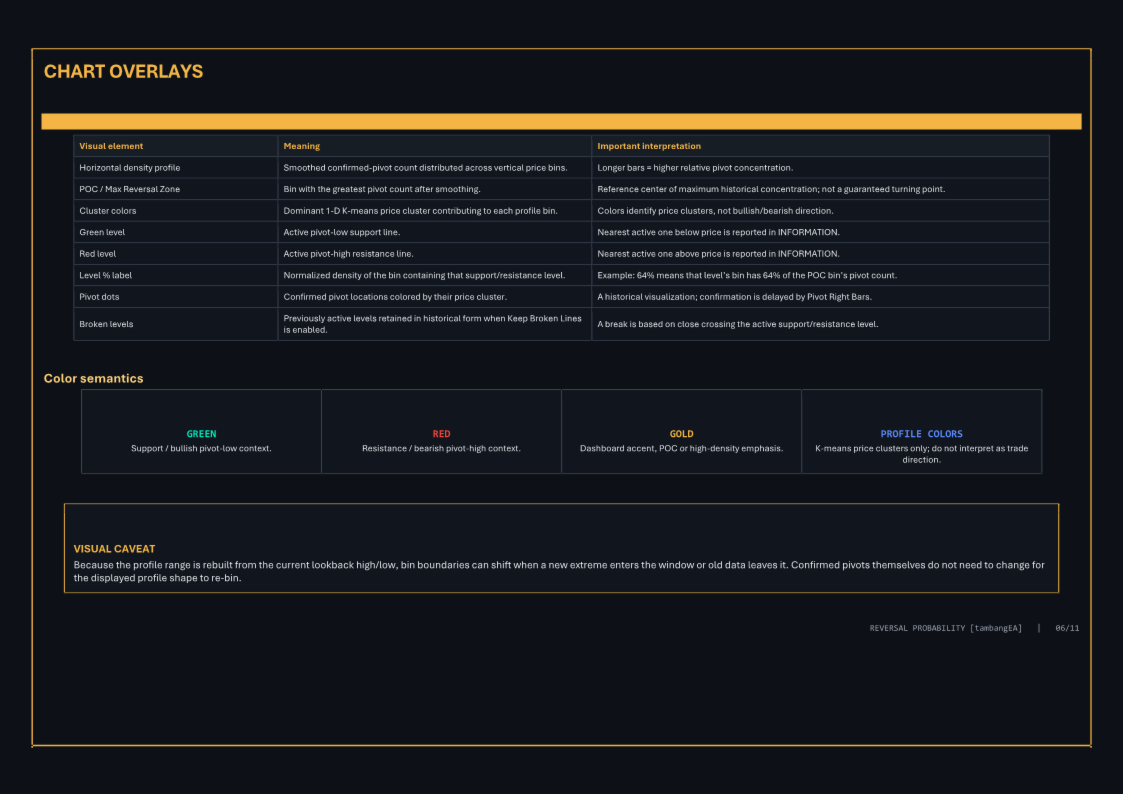
Visualizes the concentration of confirmed historical pivot points across different price levels.
Maximum Reversal Zone / POC
Automatically identifies the price zone containing the highest concentration of historical pivots.
Dynamic Support & Resistance
Confirmed pivot lows are used to identify support areas, while confirmed pivot highs are used to identify resistance areas.
Normalized Density Reading
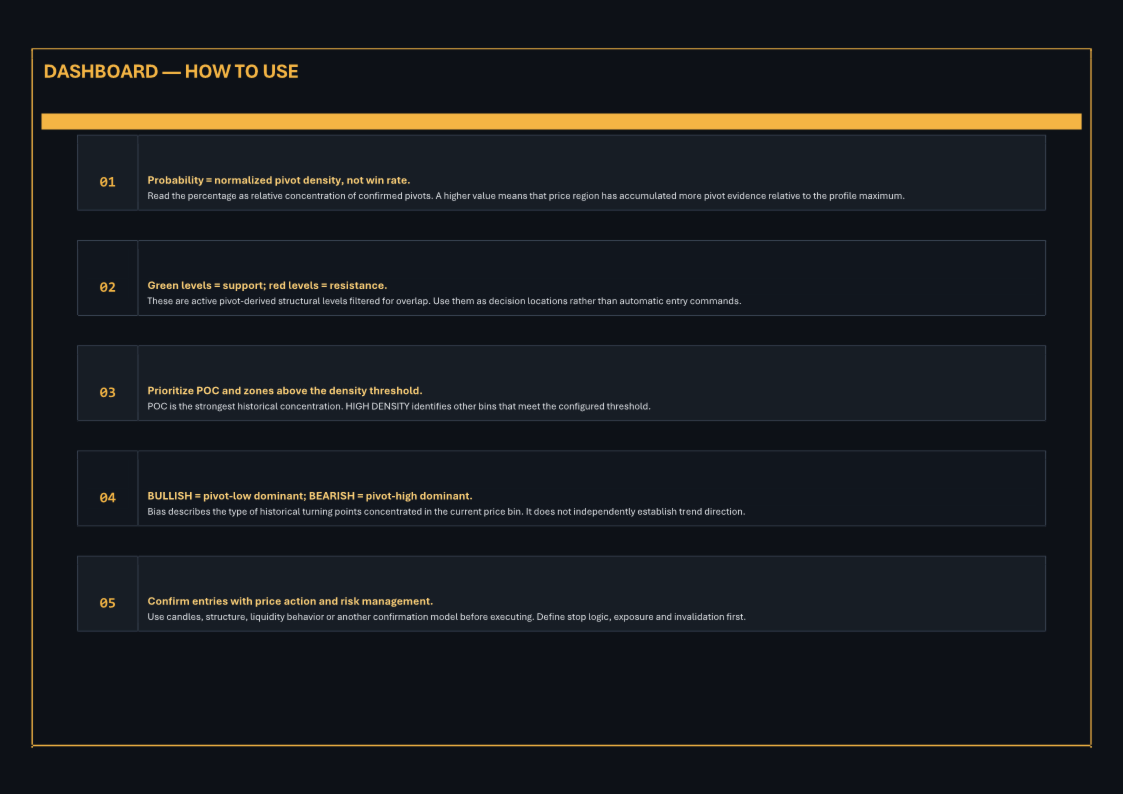
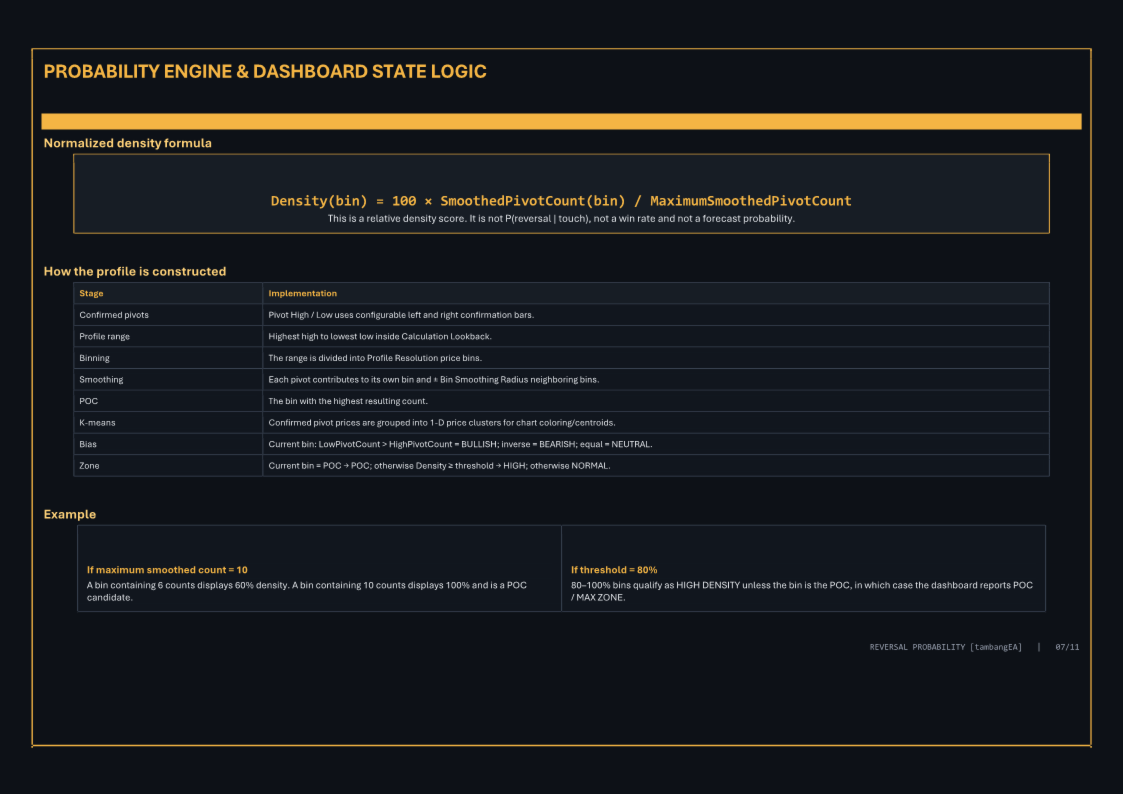
Each relevant price area receives a normalized density value from 0% to 100%, making it easier to compare reversal concentration across the active market range.
Bullish / Bearish Pivot Dominance
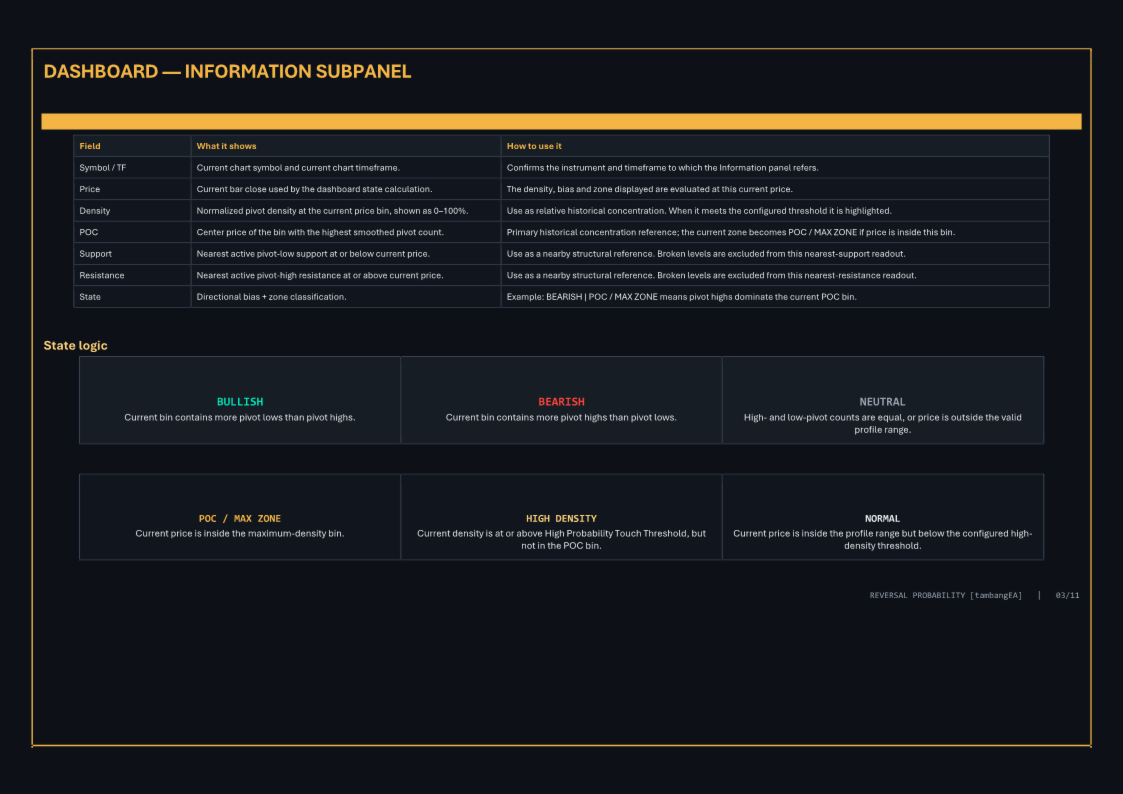
The indicator evaluates whether a price zone contains a greater concentration of historical pivot lows or pivot highs and displays the current market context as BULLISH, BEARISH or NEUTRAL.
Advanced Price Clustering
A multidimensional visual profile uses price clustering to organize historical pivot structures into clearly identifiable market regions.
Pivot Filtering with ATR
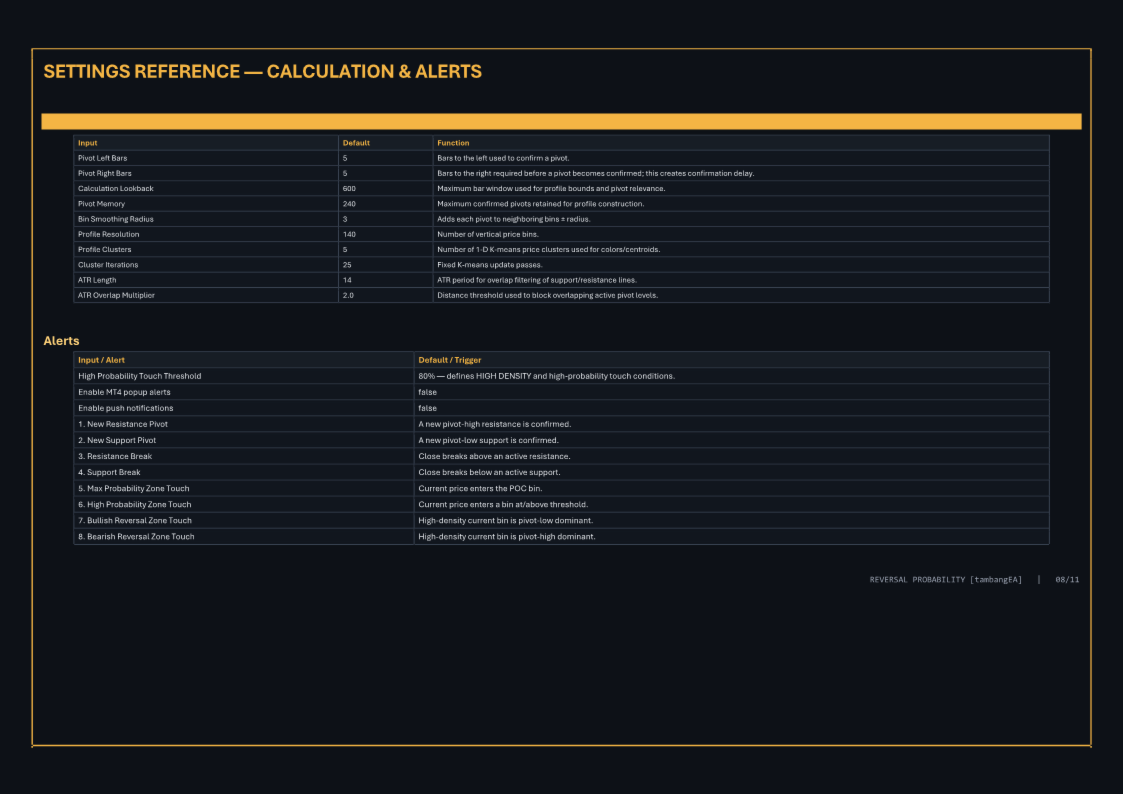
ATR-based overlap filtering helps reduce unnecessary duplicate support and resistance levels.
Historical Broken Levels
Previously active support and resistance levels can remain visible after they have been broken, helping traders review previous market structure.
Pivot Visualization
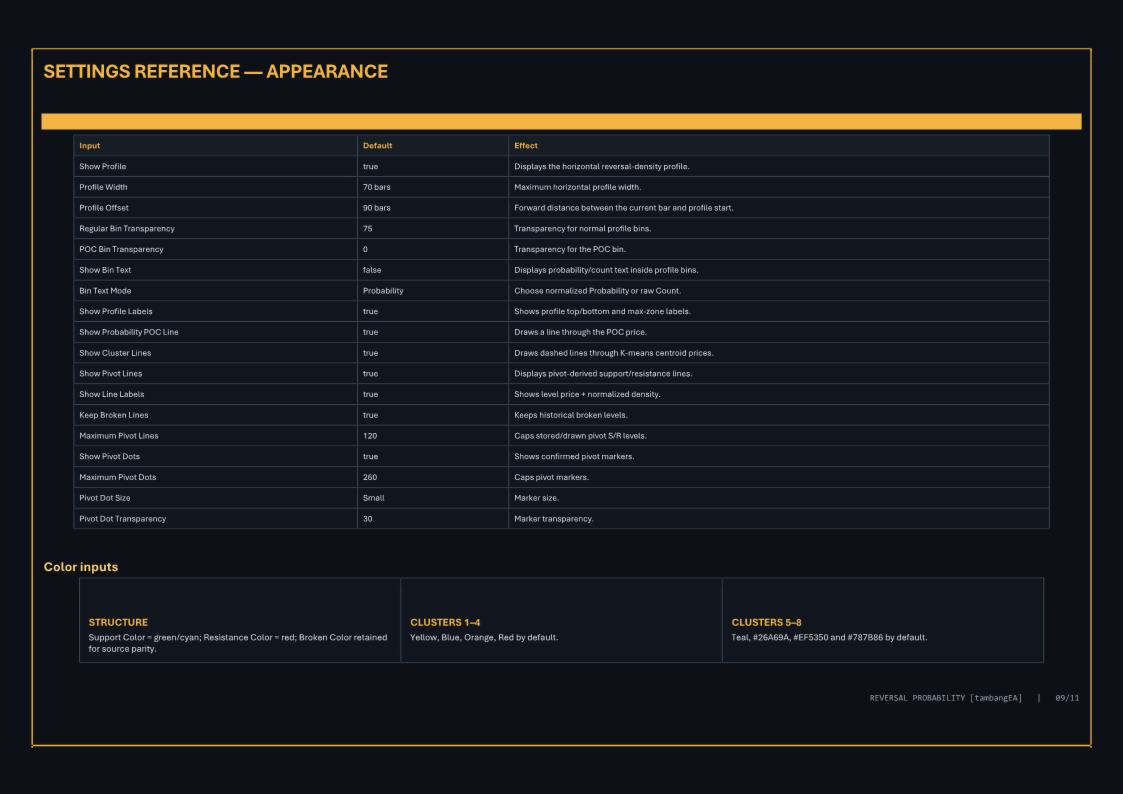
Confirmed pivot locations can be displayed directly on the chart with configurable size, transparency and cluster colors.
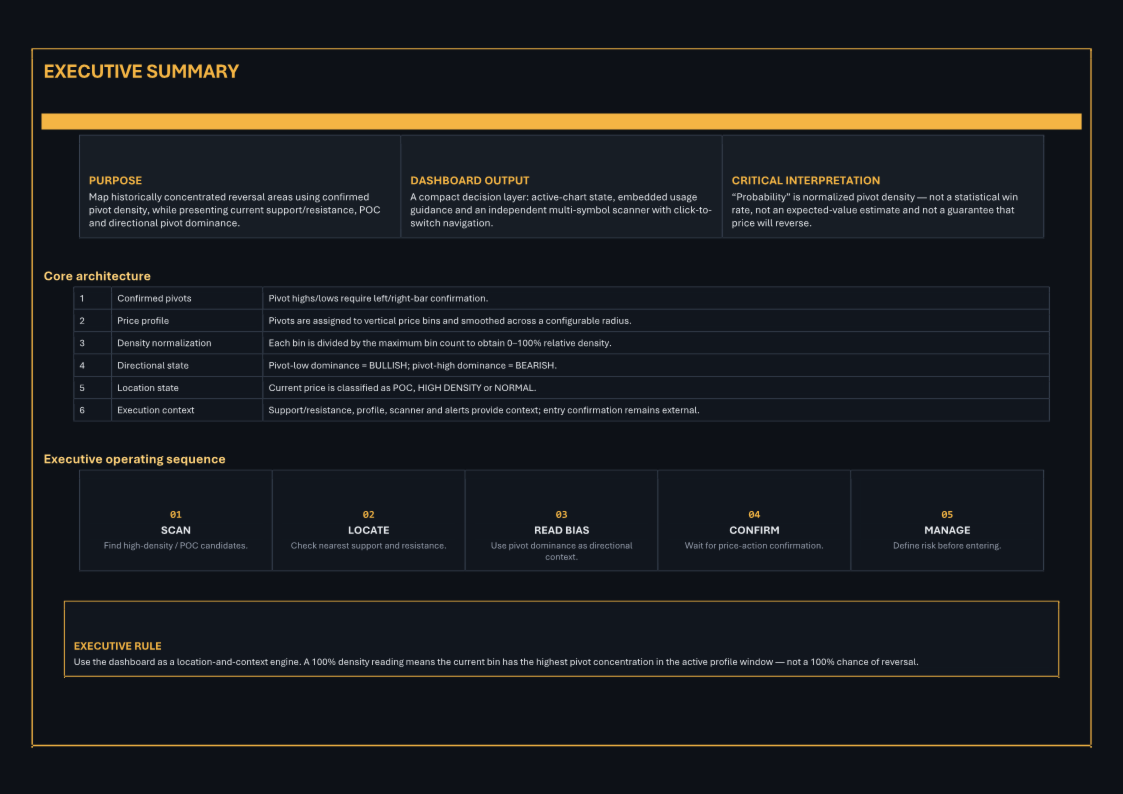
The underlying implementation uses confirmed pivots, price-bin smoothing, one-dimensional K-means clustering and ATR-based overlap filtering.