Vortex Indicator MTF

  • Indicators
  • Evgenii Sutulov
    Evgenii Sutulov
    I build trading indicators, strategies, and dashboards that don't repaint.
    Seven years doing this. MetaTrader 4, MetaTrader 5, TradingView.
    Closed bars only. What you see is what happened.
    The bar being formed never changes a published value.
  • Version: 1.3

Two lines that measure the actual rotation of a market rather than the shape of an average. Vortex Indicator MTF sums the upward and downward vortex movements over a window, divides each by the true range, and takes its signal from the crossing of the resulting pair, which is a direction change measured from the bars themselves. It carries no recursion at all, so a continuation from any bar is exact by construction. It is free: no trial, no locked features, no upgrade page.

Over a window three sums are taken: the distance from this bar's high to the previous low, which is upward vortex movement, the distance from this bar's low to the previous high, which is downward, and the true range. Each of the first two divided by the third gives VI plus and VI minus. Both oscillate around one, and their crossing is the signal.

There is no recursion anywhere in this port. The two lines are pure functions of a window over the input highs, lows and closes, which is why a continuation from any bar is exact by construction rather than approximately so. The strength level only grades a crossing two instead of one and marks the strengthening and fading of the vortex as its own event; it filters nothing, and every crossing is published.

What is on the chart

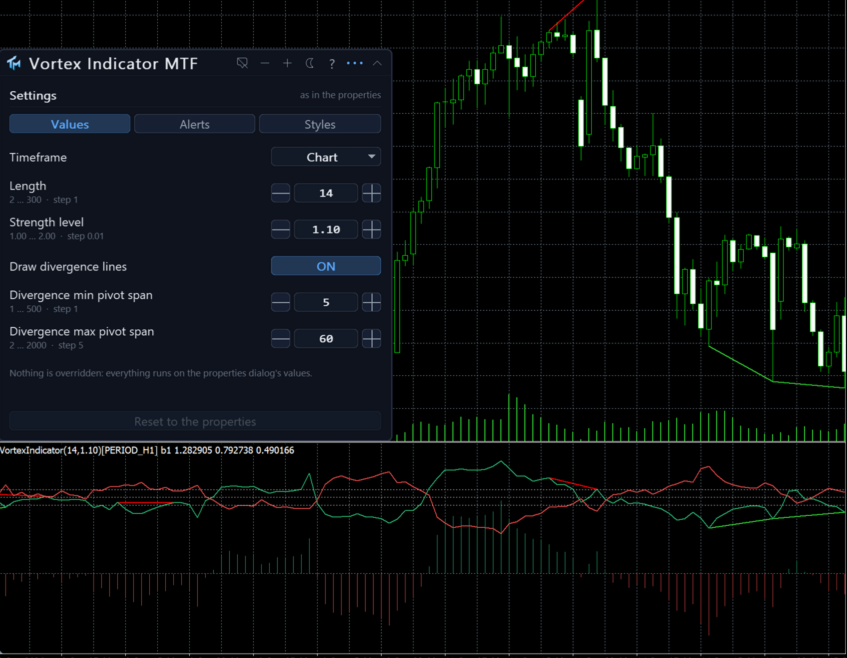
In its own sub window: VI plus and VI minus as two lines around the one level, and the spread between them as a histogram, coloured by whether it is expanding or fading. Divergence lines are drawn on the pair and, if you want them, between the matching pivots on the price chart as well.

The panel

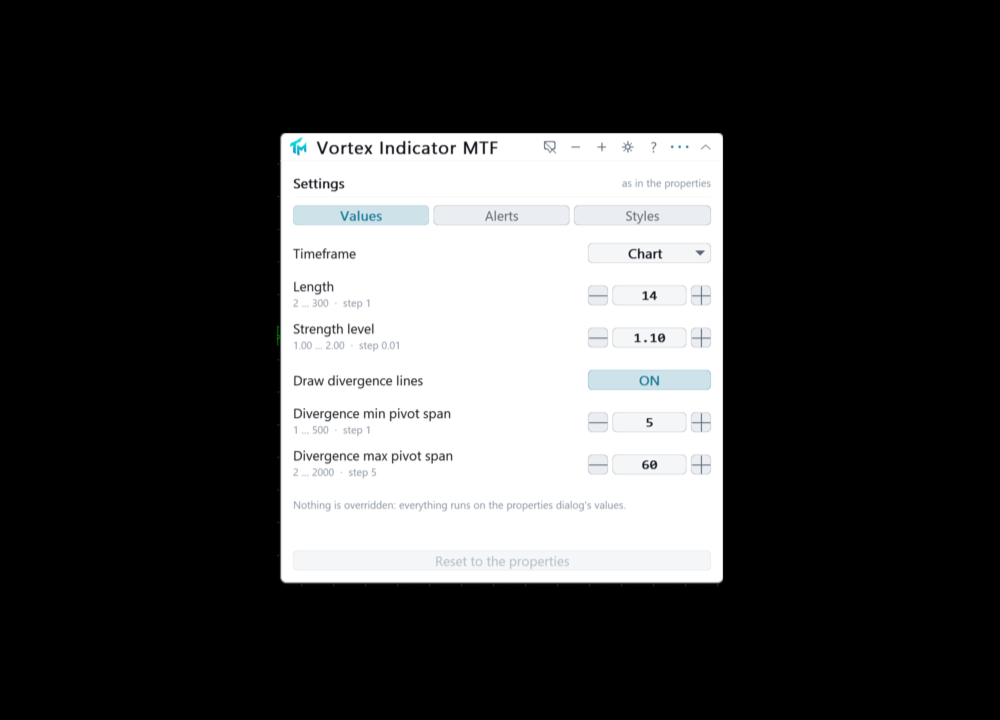
A canvas panel on the price chart, draggable, collapsible, closeable. It shows the timeframe in force and the setting values actually being used. It says what the last closed bar was: a BUY signal, a SELL signal, or neither. And it says whether the numbers on screen came from the properties dialog or from the panel, and how many of them were changed by hand.

Below that sit the settings the panel can move, with their current values. The gear opens a three-tab sheet.

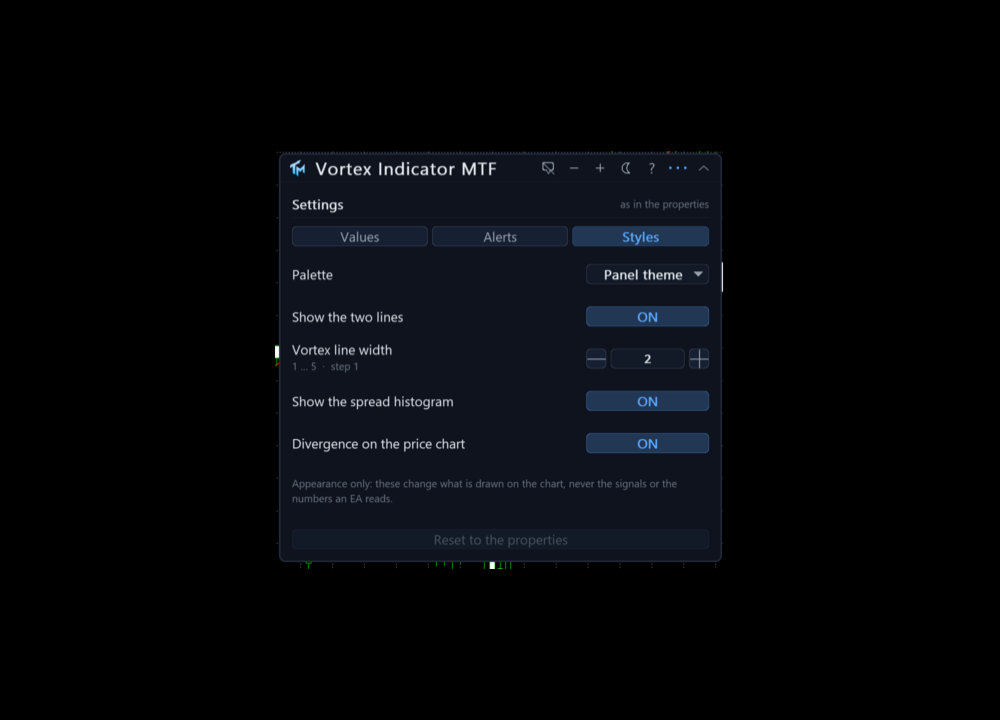
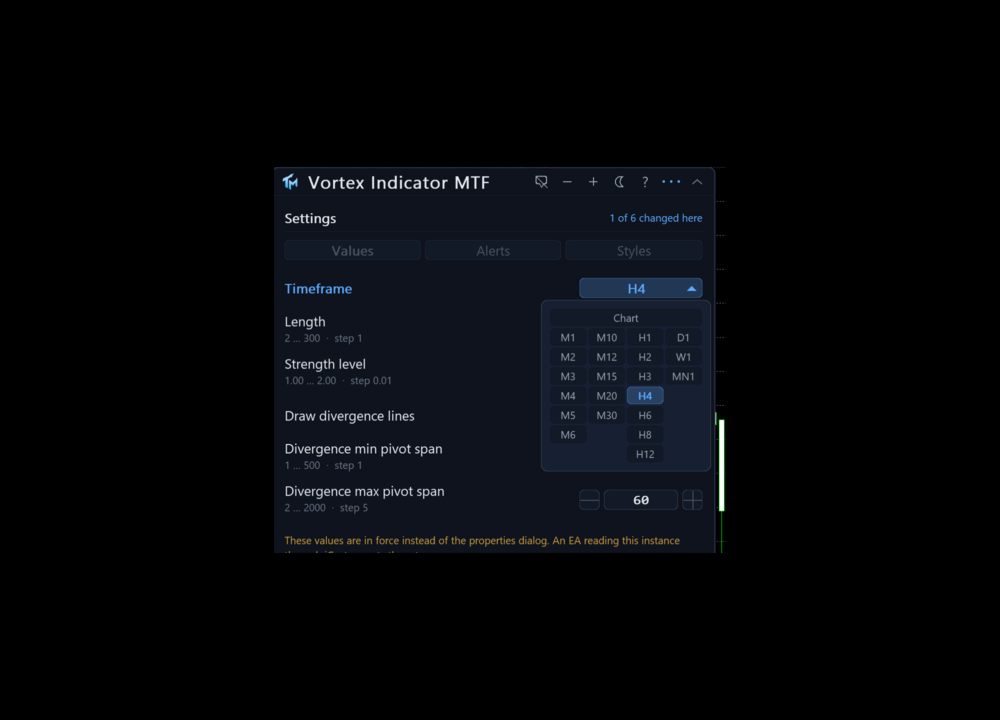
Values covers the timeframe, the length the three sums are taken over, fourteen by default, the strength level of 1.10 which grades a crossing two instead of one, and the three divergence rows. Styles covers the palette, the two lines and their width, and the spread histogram. Every Values row has steppers, a range and a sentence of help.

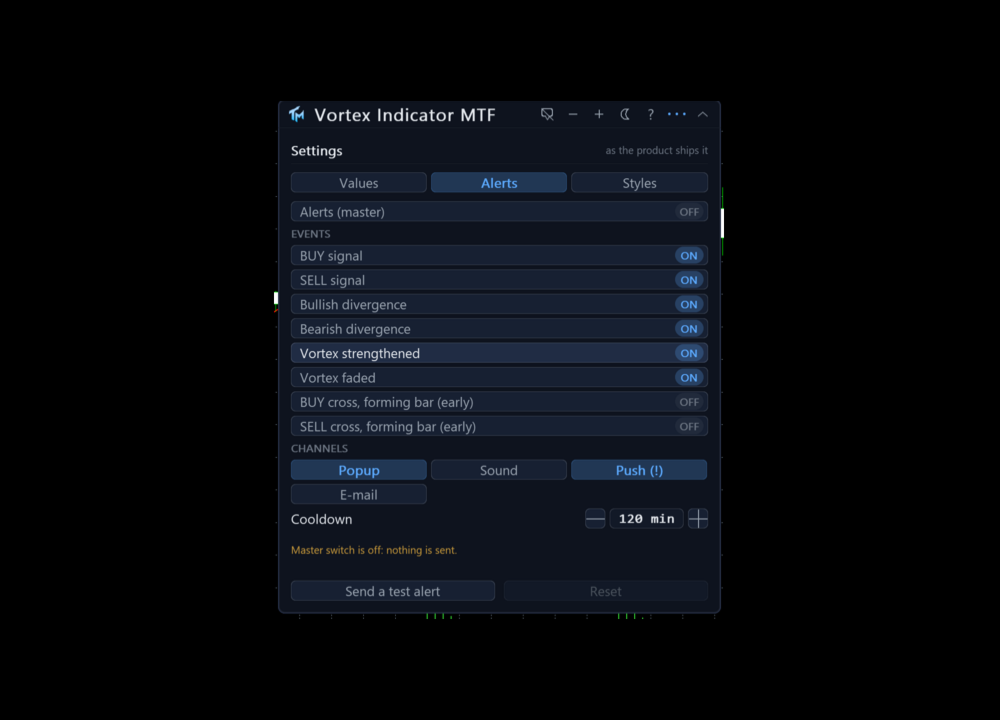
The Alerts tab covers the master switch, the per event switches, the channels, the cooldown in minutes and a test alert.

Three colour schemes: dark, light, and a colour-blind safe one that uses blue and orange rather than red and green. Everything about the panel, including every value changed on the sheet, is stored per chart and survives a timeframe change and a terminal restart. The interface is English.

Alerts

Off out of the box. Six events: a BUY signal, a SELL signal, a bullish divergence, a bearish divergence, the vortex strengthening, and the vortex fading. Each has a switch of its own.

Channels: a popup window, a sound, a push to the mobile terminal and e-mail. There are per-event and per-channel switches, and a cooldown that defaults to two hours.

Alerts fire on the last closed bar. Two further alerts, off by default, speak on the forming bar within a chosen number of seconds of its close, and they are labelled early because a flip that exists mid-bar can un-happen. Telegram is not part of this product.

Multi-timeframe

The Timeframe setting computes on a higher timeframe and draws the result here. Only closed senior bars are read: a chart bar shows the newest senior bar that had already closed by that chart bar's own close, so the flip lands on the bar that closes together with the senior bar, and nothing is drawn that could not have been known in real time.

The foreign series is built in the background. The first read of it can come back empty, the indicator retries, and the panel says whether it is waiting for a download or looking at a genuine shortage of history. It never fails initialisation over missing bars.

Reading it from an EA

Nine buffers, all readable through iCustom and CopyBuffer. Buffer 0 is VI plus, the upward vortex movement and buffer 1 is VI minus, the downward one. Buffer 2 is the spread between the two, drawn as a histogram, and buffer 3 is the colour index that paints it. Buffer 4, Signal, is +1 on a BUY bar, -1 on a SELL bar and 0 otherwise. Buffer 5 is the grade of that signal. Buffer 6 carries the divergence marks, +1 bullish and -1 bearish. Buffer 7 is the zero line and buffer 8 is Override.

This product has no separate Buy and Sell price buffers, because there is no price to put an arrow at in a sub window. The signal is buffer 4 and it is the contract: filled on every pass whatever the Styles tab says, and present in the Data Window. Hiding a plot is done by taking its colour away and never by emptying a buffer, so every index above stays readable with the display switches off.

An instance created by iCustom is read only and always uses the parameters you passed. The Override buffer lets a strategy detect that a chart instance is running on numbers changed by hand from the panel.

Provenance

This is a port of the Vortex Indicator by Botes and Siepman, published in Technical Analysis of Stocks and Commodities in 2010. The mathematics is public and the indicator is built into TradingView, which makes a port by formula admissible. One deviation is declared: the sums are progressive on the first bars where Pine returns nothing, and the very first bar has zero vortex movement because it has no bar before it.

The product is called Vortex Indicator MTF because that is the name of the method, not because authorship of the method is claimed here. The original work belongs to its author.

Honest limits

The oscillator is live on the forming bar. A cross that exists mid-bar can be absent at the close, and the panel line and the grade go with it. Closed bars do not change.

A crossing of the two lines is a change in which rotation dominates. In a range they cross often, and each of those crossings is a real crossing and a poor trade.

The strength level describes how far the leading line stood above one at the moment of the cross. It is a description of the reading, not a probability.

The single length setting moves every crossing the product will ever show. A short window crosses constantly, a long one rarely, and neither is the correct setting.

No profit figure, win rate or backtest result is claimed here.
Recommended products
Important Lines
Terence Gronowski
4.88 (24)
This indicator displays Pivot-Lines, preday high and low, preday close and the minimum and maximum of the previous hour. You just have to put this single indicator to the chart to have all these important lines, no need to setup many single indicators. Why certain lines are important Preday high and low : These are watched by traders who trade in a daily chart. Very often, if price climbs over or falls under a preday low/high there is an acceleration in buying/selling. It is a breakout out of a
FREE
Follow The Line MT5
Oliver Gideon Amofa Appiah
4.6 (35)
This indicator obeys the popular maxim that: "THE TREND IS YOUR FRIEND" It paints a GREEN line for BUY and also paints a RED line for SELL. (you can change the colors). It gives alarms and alerts of all kinds. IT DOES NOT REPAINT and can be used for all currency pairs and timeframes. Yes, as easy and simple as that. Even a newbie can use it to make great and reliable trades. NB: For best results, get my other premium indicators for more powerful and reliable signals. Get them here: https://www.m
FREE
KMB Smart Pattern Analyzer PRO
Karwan Msto Mohammed Mohammed
Product Overview KMB Smart Pattern Analyzer PRO is an advanced technical analysis indicator designed to detect and rank high-probability market patterns inside a user-defined chart range. The indicator combines multiple analysis engines in one professional tool: Candlestick pattern analysis Classic chart pattern recognition Harmonic structure detection Smart market structure / SMC-style analysis Instead of showing random signals across the full chart, the indicator allows the user to focus on a
FREE
MACD Enhanced
Nikita Berdnikov
4 (4)
Introducing the MACD  Enhanced – an advanced MACD (Moving Average Convergence Divergence) indicator that provides traders with extended capabilities for trend and momentum analysis in financial markets. The indicator uses the difference between the fast and slow exponential moving averages to determine momentum, direction, and strength of the trend, creating clear visual signals for potential entry and exit points. Attention! To achieve the best results, it is recommended to adapt the indicator
FREE
The indicator identifies when a divergence occurs between price and an indicator or oscillator. It identifies both regular and hidden divergences. Combined with your own rules and techniques, this indicator will allow you to create (or enhance) your own powerful system. For higher probability setups I can recommend you to use my Supply Demand indicator and trade only if the divergence occurs inside a zone. Supply zone for bearish div and demand zone for bullish div. The optimal scenario is if it
FREE
The indicator detects and displays М. Gartley's Butterfly pattern. The pattern is plotted by the extreme values of the ZigZag indicator (included in the resources, no need to install). After detecting the pattern, the indicator notifies of that by the pop-up window, a mobile notification and an email. The pattern and wave parameters are displayed on the screenshots. The default parameters are used for demonstration purposes only in order to increase the amount of detected patterns. Parameters z
Fractals Alligator Filter is an indicator for MetaTrader 5 that detects fractals and filters them according to their position relative to the Alligator lines. There is also the HotkeyFractalsEA utility designed to simplify trading. The indicator automatically separates fractals   into valid and invalid fractals: valid fractals are displayed with colored arrows; invalid fractals can be displayed separately or hidden in the settings. Two filtering modes are available: filtering relative to the Tee
FREE
MA Flow No.2 See the Flow of Bulls & Bears at a Glance, and Keep the Rhythm of the Market in Your Hands Tired of staring at dozens of moving averages until your eyes blur? Unsure when to enter, or where to place your stop? MA Flow No.2 upgrades the humble moving average into a complete trend-trading system. No more scattered lines on your chart — instead, a living "river of bulls and bears". Up to 100 moving averages roll together in real time. On every single bar, you can see at a glance w
Free automatic Fibonacci is an indicator that automatically plots a Fibonacci retracement based on the number of bars you select on the BarsToScan setting in the indicator. The Fibonacci is automatically updated in real time as new highest and lowest values appears amongst the selected bars. You can select which level values to be displayed in the indicator settings. You can also select the color of the levels thus enabling the trader to be able to attach the indicator several times with differe
FREE
Multi-timeframe trend indicator based on the ADX / ADXWilder indicator with Fibonacci levels The indicator shows trend areas using ADX or ADXWilder indicator data from multiple timeframes. The impulse mode of the indicator allows you to catch the beginning of a trend, and several "Screens" with different timeframes allow you to filter out market noise. Fibonacci levels are added to the price chart, which have flexible settings. How the indicator works: if PDI is greater than NDI, then   it`s
FREE
Donchian Breakout And Rsi
Mattia Impicciatore
4.5 (2)
General Description This indicator is an enhanced version of the classic Donchian Channel , upgraded with practical trading functions. In addition to the standard three lines (high, low, and middle), the system detects breakouts and displays them visually with arrows on the chart, showing only the line opposite to the current trend direction for a cleaner view. The indicator includes: Visual signals : colored arrows on breakout Automatic notifications : popup, push, and email RSI filter : to val
FREE
Mitimom
Danil Poletavkin
The indicator is based on Robert Miner's methodology described in his book "High probability trading strategies" and displays signals along with momentum of 2 timeframes. A Stochastic oscillator is used as a momentum indicator. The settings speak for themselves period_1 is the current timeframe, 'current' period_2 is indicated - the senior timeframe is 4 or 5 times larger than the current one. For example, if the current one is 5 minutes, then the older one will be 20 minutes The rest of the s
FREE
VolumeBasedColorsBars
Henrique Magalhaes Lopes
VolumeBasedColorsBars — Free Powerful Volume Analysis for All Traders Unlock the hidden story behind every price bar! VolumeBasedColorsBars is a professional-grade, 100% FREE indicator that colorizes your chart candles based on real, adaptive volume analysis. Instantly spot surges in market activity, identify exhaustion, and catch the moves that matter. This indicator gives you:    • Dynamic color-coded bars for instant volume context    • Adaptive thresholds based on historical, session-awar
FREE
JAC Trend Color Candle
Eduardo Da Costa Custodio Santos
The indicator "JAC Trend Color Candle" for Meta Trader 5, was created to visually facilitate the trend for the trader. It is based on three parameters, which identifies the uptrend, downtrend and non-trending market. The colors are trader-configurable, and the average trader-configurable as well. trend parameters cannot be configured as they are the indicator's differential.
Enhance your trading analysis with the Haiken Ashi MT5 indicator. This powerful tool transforms standard price data into smoother, trend-following candlesticks, making it easier to identify market trends and potential reversal points.    Key Features: Clear Trend Identification: Visually distinguish between uptrends and downtrends with distinct candle colors. Reduced Noise: Filter out price fluctuations, providing a clearer view of underlying market movements. Early Trend Detection: Anticipate
FREE
HMA Color with Alerts MT5
Pavel Zamoshnikov
4.77 (61)
Hull Moving Average (HMA) is well-deservedly popular among traders because of the effective averaging of market noise and a relatively small delay. The current MetaTrader 5 version changes its color when the movement direction changes. Sound and text signals are available. It also supports sending email and push messages. It is possible to trigger a signal on the current incomplete bar, although such a signal may be canceled before completion if conditions are no longer appropriate. One of the p
FREE
Indicator and Expert Adviser  EA Available in the comments section of this product. Download with Indicator must have indicator installed for EA to work. Mt5 indicator alerts for bollinger band and envelope extremes occurring at the same time. Buy signal alerts occur when A bullish candle has formed below both the lower bollinger band and the lower envelope  Bar must open and close below both these indicators. Sell signal occur when A bear bar is formed above the upper bollinger band and upper
FREE
Master SmoothedHMA Color
Som Prakash Gehlot
5 (5)
HMA Color – Master Smoothed Overview HMA Color – Master Smoothed is a MetaTrader 5 indicator based on a Hull Moving Average calculation with an additional smoothing layer. The indicator displays market direction using a color-changing HMA line and optional visual candle representation. The objective is to provide a simplified visual view of trend direction while reducing short-term fluctuations in the displayed curve. Features • Hull Moving Average calculation • Additional smoothing layer • Aut
FREE
Renko subwindow
Alexandre Vincent Traber
Overview Renko SubWindow plots a Renko brick chart as colored candles inside a separate indicator window, without affecting the main chart. Brick size can be fixed in points or calculated dynamically from ATR for adaptive volatility-based bricks. How it works Reconstructs Renko bricks from closing prices of the current symbol/timeframe history. Each brick forms once price moves beyond the defined brick size from the last brick's close. Bricks are rendered as colored candles: bullish (up) and bea
FREE
Reversal Composite Candles
MetaQuotes Ltd.
3.69 (16)
The idea of the system is to indentify the reversal patterns using the calculation of the composite candle. The reversal patterns is similar to the "Hammer" and "Hanging Man" patterns in Japanese candlestick analysis. But it uses the composite candle instead the single candle and doesn't need the small body of the composite candle to confirm the reversal. Input parameters: Range - maximal number of bars, used in the calculation of the composite candle. Minimum - minimal size of the composite can
FREE
Super Trend Strategy
Minh Khoa Nguyen
4.5 (4)
The SuperTrend Strategy is a widely-used technical indicator based on the Average True Range (ATR), primarily employed as a trailing stop tool to identify prevailing market trends. The indicator is designed for ease of use while providing reliable insights into the current market trend. It operates based on two key parameters: the period and the multiplier . By default, it uses a period of 15  for the ATR calculation and a multiplier of 3 . The Average True Range (ATR) plays a crucial role in th
FREE
MA Cross Signals
Quang Vinh Nguyen
5 (1)
MA Cross Marker helps traders visualize market direction with two customizable moving averages and clear crossover signals. It can display MA lines from one selected timeframe on the current chart and mark bullish or bearish crosses automatically. Designed for traders who want a lightweight, easy-to-read MA crossover tool. Key Features Display two customizable Moving Averages Automatic Buy/Sell signals on MA crossover Single timeframe MA selection (including higher timeframe display) Clean and
FREE
This indicator is an automated version of the Fibonacci retracement (Fib) indicator. Deciding the best areas to use when drawing the fib can be tricky and this  indicator was made with that in mind. When you drop it on the chart it will automatically choose the best points to draw the fib with, but in case you aren't satisfied with those regions, you can adjust it as you wish.
FREE
Easy GOLD MT5
Franck Martin
3.87 (45)
Easy Gold is the latest addition to the BotGPT family. It is surprising and very powerful. It is ideal for beginners due to its simplicity.  There is absolutely nothing to do, it's 100% automated, simply indicate the percentage of risk you want to take per trade and the EA is ready. Whatever your capital, the EA takes care of everything. Optimized on (XAUUSD).  Unleash all the power with the professional version (AGI Gold) and its connection to the neural network, available in my store. My othe
FREE
GDS Renko Gold Dollar XAUUSD Renko Macro Pressure Context for MetaTrader 5 GDS Renko Gold Dollar is a premium MetaTrader 5 indicator designed for traders who analyze XAUUSD with Renko charts and want to compare gold movement with US dollar pressure. The indicator does not give buy or sell signals. It does not predict gold price movement. It provides a visual context layer that helps the trader understand whether gold-side pressure or dollar-side pressure appears more dominant in the current mark
Dynamic Supply and Demand indicator automatically identifies and displays Supply and Demand Zones on your chart based on price action patterns and market structure.  These zones represent areas where institutional buying or selling pressure has historically occurred, making them key levels for potential price reactions. This form of indicator takes inspiration from ICT as well as traditional Support & Resistance formation. **For the first 50 candles (number depends on LookBackCandles) when indic
FREE
This indicator is a zero-lag indicator and displays  strength of trend change . True Trend  Oscillator Pro works best in combination with True Trend Moving Average Pro that displays exact trend as is. Oscillator value is exact price change in given direction of the trend. True Trend Moving Average Pro: https://www.mql5.com/en/market/product/103586 If you set PERIOD input parameter to 1 this indicator becomes a sharpshooter for binary options. Developers can use True Trend Oscillator in Exper
FREE
Daily Entry M1 – MT5 Indicator Daily Entry M1 is a MetaTrader 5 indicator created for traders who focus on short-term intraday opportunities on the M1 timeframe. The indicator analyzes market conditions and displays clear BUY and SELL arrows directly on the chart when its internal entry conditions are confirmed. The indicator is designed to look for potential market turning areas and attempts to identify entries close to an intraday top or bottom, helping traders focus on possible reversal oppo
FREE
The MACD indicator in MetaTrader 5 does not look like MACD as it was designed. That is because the MetaTrader 5 version of MACD displays the MACD line as a histogram when it is traditionally displayed as a line. Additionally, the MetaTrader 5 version computes the Signal line using an SMA, while according to MACD definition it is supposed to be an EMA. The MetaTrader 5 version also does not compute a true MACD Histogram (the difference between the MACD/Signal lines). This can be confusing for peo
FREE
Haven Key Levels PDH PDL
Maksim Tarutin
4.92 (12)
The   "Haven Key Levels PDH PDL"   indicator helps traders visualize key levels on the chart. It automatically marks the following levels: DO (Daily Open)   — the daily open level. NYM (New York Midnight)   — the New York midnight level. PDH (Previous Day High)   — the previous day's high. PDL (Previous Day Low)   — the previous day's low. WO (Weekly Open)   — the weekly open level. MO (Monthly Open)   — the monthly open level. PWH (Previous Week High)   — the previous week's high. PWL (Previou
FREE
Buyers of this product also purchase
Trend Sniper X
Sarvarbek Abduvoxobov
4.9 (41)
Trend Sniper X is a multi-timeframe trend-following indicator for MetaTrader 5 that helps traders identify trend direction and potential reversal points with clarity and precision. for MT4: https://www.mql5.com/en/market/product/193245 Price Information: The current price is promotional and is subject to change as upcoming updates and new features are released. Bonus Offer: To get the FREE Auto-Trade Assistant EA for this indicator, please message the author after purchasing. Code2Profit Channe
Smart Trend Trading System — MetaTrader 5 Message me on MQL5 after purchase to receive Smart Universal Expert Advisor for FREE, plus the online course, PDF manual, and private group access. STTS brings trend direction, entry and exit signals, reversal zones, and important price levels together on your chart. Follow the system manually, or connect a separate compatible EA for automated execution using your chosen settings. ONE SYSTEM. FOUR TRADING APPROACHES. STTS organizes its trading approaches
Zoryk Gold
Reda El Koutbane
5 (15)
discount ends SOON next price 69 $ ZORYK — Advanced XAUUSD Signal System for MetaTrader 5 You know the feeling. You spend time analyzing gold. You wait for the entry. You finally open the trade, and price immediately moves against you. You close too early, move the Stop Loss or hesitate for a few seconds. Then the market reaches the exact destination you originally expected without you. The direction was not always the problem. The real problem was uncertainty. You did not know exactly where th
SuperScalp Pro
Van Minh Nguyen
4.56 (36)
SuperScalp Pro - Professional Multi-Layer Confluence Scalping System SuperScalp Pro is an advanced scalping indicator that upgrades classic Supertrend with multiple intelligent confirmation filters. It helps you identify higher-probability Buy/Sell opportunities while significantly reducing false signals. Clear Buy and Sell arrows appear directly on the chart, with automatic ATR-based Stop Loss and Take Profit levels calculated in real time. After purchase, contact me for setup guidance and reco
A new King in town - Indicator + Order management indications(tp1+tp2+tp3) + Optional Telegram Signal sender   INCLUDED (FREE) ( FULL TRADING  and SIGNAL SYSTEM ) Our best EA for Gold: Gold Slayer TRY > Reversion Queen  Expert advisor NEW Free Automation EA link < click here ( disclaimer: this is new and still on testing and phase , use at your risk on demo) Free Telegram Bridge < click here  This indicator includes an advanced Strategy, a trading system with customisable order management and a
SMC Intraday Formula
VividMind Digital Solutions
5 (26)
Secure the Lowest Price Today. After purchase, contact via   MQL5 inbox   to receive your buyer kit and bonus. Let's be honest first. No indicator will make you profitable on its own. If someone tells you otherwise, they're selling you a dream. Every indicator that shows perfect buy/sell arrows can be made to look flawless — just zoom into the right window of history and screenshot the winners. We won't do that. SMC Intraday Formula is a tool. It reads the market structure for you, maps the hig
Entry Points Pro 10 — the legend of the MQL5 Market. Three years in the Market's Top-3. 595 reviews across two versions. Over 31,000 demo downloads. Thousands of traders open their charts with it every morning. Built and traded by an author who has been in the market since 1999. Version 10 is the biggest rebuild in the indicator's history: I read every review from five years — and built the answers into the code. WHAT IT DOES It shows the entry point in advance — strictly without repainting. The
GoldenX Entry MT5
VividMind Digital Solutions
5 (16)
Price will increase by $20 every 10 buyers to maintain premium value. After purchase, contact via   MQL5 inbox   to receive your buyer kit and bonus. You have probably tested dozens of indicators before. But we are not here to be “just another signals indicator.” Behind GoldenX Entry is intensive research & development focused on building sophisticated algorithms designed to adapt to the real behavior of every instrument — not generic signals recycled everywhere else. From advanced Auto Optim
Gann Made Easy   is a professional and easy to use Forex trading system which is based on the best principles of trading using the theory of W.D. Gann. The indicator provides accurate BUY and SELL signals including Stop Loss and Take Profit levels. You can trade even on the go using PUSH notifications. PLEASE CONTACT ME AFTER PURCHASE TO GET TRADING  INSTRUCTIONS   AND GREAT EXTRA INDICATORS  FOR FREE! Probably you already heard about the Gann trading methods before. Usually the Gann theory is a
ARIPoint
Temirlan Kdyrkhan
1 (4)
ARIPoint is a powerful trading companion designed to generate high-probability entry signals with dynamic TP/SL/DP levels based on volatility. Built-in performance tracking shows win/loss stats, PP1/PP2 hits, and success rates all updated live. Key Features: Buy/Sell signals with adaptive volatility bands Real-time TP/SL/DP levels based on ATR Built-in MA Filter with optional ATR/StdDev volatility Performance stats panel (Success, Profit/Loss, PP1/PP2) Alerts via popup, sound, push, or email Cu
Auto Optimized SpeedAngle is an institutional-grade momentum vectoring system that eliminates curve-fitting through continuous Walk-Forward Optimization (WFO). Rather than relying on static inputs that degrade when market regimes shift, the indicator dynamically recalibrates its parameters using Out-of-Sample (OOS) validation, ensuring the displayed signals represent genuine statistical edges rather than historical anomalies. By shifting the focus from subjective visual angles to normalized, qua
Neuro Poseidon MT5
Daria Rezueva
4.75 (52)
Neuro Poseidon is a new indicator by Daria Rezueva. It combines precise trading signals with adaptive TP/SL levels - creating best possible trades as a result! Message me and get  Neuro Poseidon Assistant  as a gift to automize your trading process! What makes it stand out? 1. Proven profitability on all assets and timeframes 2. Only confirmed BUY and SELL signals present on the chart 3. Adaptive TP & SL levels generated by the software for each trade 4. Easy to understand - suitable for al
Welcome to ENTRY IN THE ZONE AND SMC MULTI TIMEFRAME  SPECIAL BENEFIT / FOR OUR MQL5 CUSTOMERS FREE ACCESS TO THE NEW TOOL  — COMING SOON — Learn more on our official website  : https://www.fableedge.net Entry In The Zone and SMC Multi Timeframe is a real-time market analysis tool based on Smart Money Concepts (SMC) , designed to analyze market structure, price direction, and key trading zones. It supports both Single-Timeframe and Multi-Timeframe Analysis , providing a clearer view of overall m
Get your trading edge in the line of sight M5 Sniper   is a new indicator by MeanFX. It combines   precise trading signals   with   adaptive TP/SL levels   - creating best possible statistical trades as a result! The price increases every 5 purchases, the next price is 79$ Message me after purchase to receive tips/guide and bonus EA What makes it stand out?   Proven statistical performance   on Gold XAUUSD ( works almost on every asset focusing on mastering one timeframe instead of trying to
Gold Entry Sniper
Tahir Mehmood
5 (21)
Gold Entry Sniper – Professional Multi-Timeframe ATR Dashboard for Gold Scalping & Swing Trading Gold Entry Sniper is a cutting-edge MetaTrader 5 indicator designed to give traders precise buy/sell signals for XAUUSD and other symbols, powered by ATR Trailing Stop logic and a multi-timeframe analysis dashboard . Built for both scalpers and swing traders, it combines real-time market direction , dynamic stop levels , and professional visual dashboards to help you identify high-probability gold en
M1 Sniper MT5
Oleg Rodin
5 (7)
M1 SNIPER  is an easy to use trading indicator system. It is an arrow indicator which is designed for M1 time frame. The indicator can be used as a standalone system for scalping on M1 time frame and it can be used as a part of your existing trading system. Though this trading system was designed specifically for short-term trading, it still can be helpful for all traders. This trading system can be used with any forex pair and time frame, though lower time frames are recommended from M1 up to M
Unix Scalper
Issam Kassas
4 (4)
Unix Scalper — MetaTrader 5 Message me on MQL5 after purchase to receive Smart Universal Expert Advisor for FREE, plus the online course, PDF manual, and private group access. Find the setup. See the plan. Choose how to trade it. UNIX Scalper brings market analysis, BUY/SELL/WAIT decisions and Entry, Stop Loss, TP1 and TP2 levels into one organized panel. SEE THE SIGNAL AND THE PLAN • Clear decisions: BUY, SELL or WAIT. • Defined levels: Entry, Stop Loss, TP1 and TP2. • Multi-timeframe overvie
Scalper Vault   is a professional scalping system which provides you with everything you need for successful scalping. This indicator is a complete trading system which can be used by forex and binary options traders. The recommended time frame is M5. The system provides you with accurate arrow signals in the direction of the trend. It also provides you with top and bottom signals and Gann market levels. The indicator provides all types of alerts including PUSH notifications. PLEASE CONTACT ME A
Divergence Bomber
Ihor Otkydach
4.89 (94)
Each buyer of this indicator also receives the following for free: The custom utility "Bomber Utility", which automatically manages every trade, sets Stop Loss and Take Profit levels, and closes trades according to the rules of this strategy Set files for configuring the indicator for various assets Set files for configuring Bomber Utility in the following modes: "Minimum Risk", "Balanced Risk", and "Wait-and-See Strategy" A step-by-step video manual to help you quickly install, configure, and
RelicusRoad Pro MT5
Relicus LLC
4.96 (25)
Stop guessing your trades. Know when to enter, where to get out and which way the market leans, all on one chart. RelicusRoad Pro brings nearly twenty tools into one indicator, and you switch on the ones that fit the way you trade. Clear entries. Clear exits. A plan on every chart. Sound familiar? You buy, and price turns against you a minute later. You close too early, then watch the move carry on without you. Five indicators on the chart, five different answers. Your stop loss is a guess. Why
Tokyo mt5 Indicator
Vasiliy Strukov
5 (7)
Tokyo Indicator provides a clear visual overview of trend direction, potential trading signals, and market conditions. Its colour-coded, stepped trend line distinguishes bullish phases in blue from bearish phases in magenta. Matching directional arrows highlight potential buying and selling opportunities when the displayed trend changes. An integrated dashboard brings together the current signal, market bias, momentum, volatility, and signal quality in one convenient view. This allows traders t
FX Trend MT5 NG
Daniel Stein
5 (6)
FX Trend NG: The Next Generation Multi-Market Trend Intelligence Overview FX Trend NG is a professional multi-timeframe trend and market monitoring tool designed to give you a complete structural overview of the market in seconds. Instead of switching between dozens of charts, you instantly see which symbols are trending, where momentum is fading, and where strong alignment exists across timeframes. This tool is part of the Stein Investments ecosystem - 18+ tools plus Max, your 1-on-1 AI tradi
FiboSniper Pro
Van Minh Nguyen
5 (3)
FiboSniper Pro - Multi-Filter Fibonacci System with Auto SL/TP and Control Panel FiboSniper Pro is a technical indicator that combines dynamic Fibonacci Envelopes with multiple confirmation filters to generate selective Buy and Sell signals. Fibonacci levels are calculated from Moving Average and ATR, then filtered by ADX, EMA, RSI, ATR, Volume, Time and Candle structure. The indicator displays automatic ATR-based Stop Loss and Take Profit levels directly on the chart, along with an interactive
Market Structure Order Block Dashboard MT5 is an MT5 indicator designed for traders who want to read market structure and the main price reaction zones directly on the chart. It combines BOS, ChoCH, Order Blocks, Fair Value Gaps (FVG), Liquidity, Kill Zones, Volume Profile, and a compact dashboard for quick analysis. This indicator targets traders who use market structure, ICT and Smart Money concepts as a decision framework. It can help spot trend continuations, possible reversals, price imbala
Hi Trader, Most retail traders rely on lagging, web-based scripts. To trade with a true edge, you need institutional architecture. The Astro AI Indicator is not a standard chart overlay. It is a compiled, dual-agent neural network running directly on your terminal. Here is the exact technology driving the system: 1. Agent 1: The Analyst (Graph Neural Networks - GNN) Markets are not just isolated price bars; they are interconnected networks of data. The Function: Agent 1 utilizes a Graph Neural
Adaptive Price Action Engine Buy Indicator- Get EA Based on it for FREE. Self-Optimizing Multi-Timeframe Trend & Candlestick Intelligence Markets do not behave the same way all the time—and not every price-action pattern has the same value in every market regime. Adaptive Price Action Engine is designed to adapt to changing market conditions by combining trend structure, multi-timeframe analysis, candlestick patterns, and statistical optimization into one analytical framework. Two Adaptive Mode
Introducing   Quantum Breakout PRO , the groundbreaking MQL5 Indicator that's transforming the way you trade Breakout Zones! Developed by a team of experienced traders with trading experience of over 13 years,   Quantum Breakout PRO   is designed to propel your trading journey to new heights with its innovative and dynamic breakout zone strategy. Quantum Breakout Indicator will give you signal arrows on breakout zones with 5 profit target zones and stop loss suggestion based on the breakout b
Trend Catcher ind mt5
Ramil Minniakhmetov
5 (18)
TREND CATCHER INDICATOR Trend Catcher Indicator analyzes market price movements, using a combination of the author’s proprietary and customized adaptive trend-analysis indicators.  It identifies the true market direction by filtering out short-term noise and focusing on underlying momentum strength, volatility expansion, and price structure behavior.  It also uses a combination of smoothing and trend-filtering customized indicators such as moving averages, RSI, and volatility filters.   Real ope
Quant Direction MT5
Georgios Kalomoiropoulos
Quant Direction is a 3 dimensional market analysis tool. It provides a purely objective, algorithmic view of the market by calculating exact percentage-based biases across multiple dimensions simultaneously. Developed utilizing advanced AI modeling tools and subjected to thorough testing, this algorithm is engineered to read the market with unique precision. It can analyze any currency pair or financial instrument available on your platform.  Quant Direction is the ideal tool whether you are a S
Quantum TrendPulse
Bogdan Ion Puscasu
5 (26)
Introducing Quantum TrendPulse , the ultimate trading tool that combines the power of SuperTrend , RSI , and Stochastic into one comprehensive indicator to maximize your trading potential. Designed for traders who seek precision and efficiency, this indicator helps you identify market trends, momentum shifts, and optimal entry and exit points with confidence. Key Features: SuperTrend Integration: Easily follow the prevailing market trend and ride the wave of profitability. RSI Precision: Detect
More from author
Currency Strength Pro ranks the eight major currencies by relative strength, read from up to 28 pairs, on a multi-timeframe composite, then ranks the basket's own pairs into a graded scanner. Closed bars only, never on a tick. The idea is simple: trade a strong currency against a weak one, instead of the chart that happens to look nice today. The strength table answers "which currency". The scanner and its A/B/C grade answer "which pair, and how clean is the setup". What it does The panel ranks
A trailing stop that speeds up and slows down with the market instead of ignoring it. Var Trail Tracker MTF drives its support average with VIDYA, whose weight follows a momentum measure, then trails a percentage stop around it and compares the two with the original's own two bar delay. Signals are the support average crossing that delayed line, exactly as the method defines them. It is free: no trial, no locked features, no upgrade page. The support average is a VAR, that is a variable index dy
FREE
Signals from your Telegram channels, copied to MetaTrader 4 and MetaTrader 5 within seconds. TradingMind Signal Bridge reads the channels and groups you choose, recognises each signal with fast built in rules, hands the messy ones to an AI model, including signals posted as screenshots, and passes the order to an expert advisor on your terminal. A news filter, prop firm account protection and a Telegram bot for remote control keep the decision about what gets traded with you. What this product i
An average without the lag, and a band that refuses to flip the trend on a quiet bar. Zero-Lag Trend MTF feeds the average price plus its own recent change, which removes most of the delay, then wraps it in a band whose width is the highest ATR of the recent past rather than the current one, so a lull cannot turn the trend around. The side changes only on a break of the band, never on a touch. It is free: no trial, no locked features, no upgrade page. A zero lag average removes delay by feeding
FREE
Alpha Trend MTF
Evgenii Sutulov
3 (1)
A trailing stop line that asks where the money is going before it decides which side to hold. Alpha Trend MTF builds its trail from ATR and lets money flow choose the side, then takes its signals from the line crossing its own copy two bars back, which is what keeps it quiet in a chop that shakes ordinary trailing stops out. Signals from a higher timeframe can be drawn on any chart, and only closed senior bars are read. It is free: no trial, no locked features, no upgrade page. Two trail levels
FREE
Half Trend MTF draws a stepped trend line that holds its level until the market takes it out, and flips to the other side when it does. Around it sits an ATR channel. The decision it supports is a simple one, and it is stated plainly: the line says which side the trend is currently held on, the flip says the moment that changed, and the channel says how much room the current volatility gives price before the flip is likely to matter. Because the line only moves when the extremes of the last N ba
FREE
Know before you take the trade how much of today's move is already gone. ADR Levels MTF prints the two prices a normal day can still reach, marks the bar where the range was fully spent, and puts the per cent already used on the panel, so a late entry stops looking like a fresh one. It builds its days from the bars of the chart you are on, which means the same numbers on M5 and on H4 and no second data feed to wait for. It is free: no trial, no locked features, no upgrade page. The average daily
FREE
It stays silent until something actually happens. Volatility Explosion MTF measures the change in momentum bar by bar and reports it only when it clears two thresholds at once: the width of a Bollinger band and a dead zone built from a hundred bar true range. A bar that clears both is a real expansion of volatility with a side, and everything below them is nothing at all. It is free: no trial, no locked features, no upgrade page. The burst is the difference between this bar's MACD and the previo
FREE
The average price everyone who entered after the last swing is holding, drawn without you having to click an anchor. Anchored VWAP MTF finds the last confirmed swing itself, runs the volume weighted average from there, and puts deviation bands around it so a retest can be told from a breakaway. There is no calendar in it anywhere, so it behaves the same on any symbol and any broker session. It is free: no trial, no locked features, no upgrade page. The volume weighted average price is accumulate
FREE
Nadaraya Watson Envelope MTF draws a smooth centre line through price and an envelope around it, then marks the bars where price came back inside that envelope after having traded outside it. The question it answers is narrow and it is the only one it claims to answer: price has stretched away from its own recent centre, and it has just stopped stretching. Whether you treat that as a mean-reversion entry, as a place to take profit on a trend position, or as nothing at all is your decision. The i
FREE
A fear index for instruments that do not have one. Williams Vix Fix MTF measures how far below the recent highest close a bar's low fell, which is the thing a VIX gives an index, and opens a panic zone when that reading clears its own Bollinger band or comes close to its own recent high. Larry Williams built it to find capitulation, and this port adds the mirrored side so a board can show both. It is free: no trial, no locked features, no upgrade page. The gauge is one subtraction: how far below
FREE
UT Bot MTF
Evgenii Sutulov
UT Bot MTF is an ATR trailing stop and the flip signals it produces. The stop follows price at a distance of a chosen multiple of ATR, ratchets in the direction of the move and never gives ground back. When price closes through it, the stop flips to the other side and the indicator marks a BUY or a SELL. That is the whole engine, and it is deliberately simple. What this product adds around it is the part that decides whether you can actually use it: four independent filters, an honest account of
FREE
A trend line that refuses to wander. Half Trend MTF holds its level while the market pushes at it and flips only when the extremes of the last N bars actually take it out, so it sits still through the chop that makes a moving average look like a signal generator. Around it an ATR channel shows how much room today's volatility gives price before that flip is likely to matter. Free, no trial, no locked features. The decision it supports is a simple one, and it is stated plainly: the line says whic
FREE
One line, six weighted averages deep, that changes direction instead of crossing something. Cascade WMA Trend MTF chains six weighted moving averages whose periods grow the way a Fibonacci sequence does, which smooths the result far past what a single average of the same length would do, and takes its signal from the finished line turning. Any higher timeframe can be drawn on any chart, closed senior bars only. It is free: no trial, no locked features, no upgrade page. Six weighted moving averag
FREE
QQE Mod MTF
Evgenii Sutulov
QQE Mod MTF is a momentum oscillator in its own sub-window. It runs two independent QQE blocks over RSI and turns them into one readable histogram. QQE, which stands for Qualitative Quantitative Estimation, smooths RSI and then builds a trailing band around it from the smoothed average of the RSI's own absolute changes. The band does not move against the trend, which is what makes a QQE cross slower and less noisy than an RSI cross. This product runs two of those blocks at once and publishes wha
FREE
Wave Trend Oscillator MTF is a two-line momentum oscillator in its own sub-window. The fast line measures how far the typical price has run from its own smoothed centre, relative to its recent average deviation, and a slower average of that fast line is drawn beside it. The event is a cross between the two lines inside a zone the market has actually reached. Crosses in the middle of the range are not signals, and that single rule is what separates this product from a plain oscillator. Three thin
FREE
A trailing stop that never gives ground, and the exact bar it turns. UT Bot MTF draws the ATR stop on your chart, marks every BUY and SELL flip, and then does the part almost no version of it does: it tells you how many signals its filters threw away and which filter threw them, and it warns you, in colour, while the arrow on the current bar can still disappear. Free, no trial, no locked features. The engine is deliberately simple. The stop follows price at a chosen multiple of ATR, ratchets in
FREE
The market goes quiet before it moves, and this window shows both halves of that sentence. Squeeze Momentum MTF marks the bars where Bollinger Bands sit entirely inside the Keltner Channel, prints the exact bar where that compression releases, and colours a momentum histogram so you see which side the stored energy was on when it let go, on this timeframe or a higher one drawn right here. Free, no trial, no locked functions. The first question it answers is whether the market is compressed. Boll
FREE
Currency Strength Flux ranks the eight major currencies by relative strength, read from up to 28 pairs, on a four-timeframe composite that only ever uses closed bars. The idea is simple: trade a strong currency against a weak one, instead of the chart that happens to look nice today. Everything on the panel serves that one decision. What it does The panel ranks EUR, GBP, AUD, NZD, USD, CAD, CHF and JPY from strongest to weakest. Every reading is built from the pairs your broker actually quotes.
FREE
Currency Strength Pro ranks the eight major currencies by relative strength, read from up to 28 pairs, on a multi-timeframe composite, then ranks the basket's own pairs into a graded scanner. Closed bars only, never on a tick. The idea is simple: trade a strong currency against a weak one, instead of the chart that happens to look nice today. The strength table answers "which currency". The scanner and its A/B/C grade answer "which pair, and how clean is the setup". What it does The panel ranks
Squeeze Momentum MTF answers two questions at once, in one sub-window. The first is whether the market is compressed. Bollinger Bands are compared with a Keltner Channel: when the Bollinger Bands sit entirely inside the Keltner Channel, volatility has contracted and the market is in a squeeze. When they push back outside it, the squeeze has released. The second is which way the compressed energy is pointing. A detrended price series is fitted by linear regression and the endpoint of that fit is
FREE
Momentum you can read at a glance, and a product that tells you when it is not sure. QQE Mod MTF runs two independent QQE blocks over RSI and prints one histogram: bright when both blocks agree on a direction, grey when they do not. That grey is the point. Most oscillators give you a colour on every bar and leave you to guess how much it is worth; this one says out loud when there is no confirmation. Free, no trial, no locked features. QQE, which stands for Qualitative Quantitative Estimation, s
FREE
Currency Strength Flux
Evgenii Sutulov
2 (1)
Currency Strength Flux ranks the eight major currencies by relative strength, read from up to 28 pairs, on a four-timeframe composite that only ever uses closed bars. The idea is simple: trade a strong currency against a weak one, instead of the chart that happens to look nice today. Everything on the panel serves that one decision. What it does The panel ranks EUR, GBP, AUD, NZD, USD, CAD, CHF and JPY from strongest to weakest. Every reading is built from the pairs your broker actually quotes.
FREE
A kernel regression that does not repaint, which is the whole point. Nadaraya Watson Envelope MTF draws a smooth centre line through price and an error envelope around it, marks the bars where price came back inside after stretching out, and computes every bar from the bars behind it only, so a closed bar never moves. The usual charting-site version of this line is fitted two-sided and rewrites itself under your feet; this one is causal by construction. Free, no trial, no locked functions. The q
FREE
An oscillator that ignores every cross in the middle of the range. Wave Trend Oscillator MTF publishes a cross only when it happens inside a zone the market has actually reached, grades it by how deep that zone was, finds divergences on the fast line and can draw them on the price chart where you trade, and it can compute all of this on a higher timeframe while you watch your own. Free, no trial, no locked functions. The fast line measures how far the typical price has run from its own smoothed
FREE
Exhaustion Count MTF counts. It does not predict direction and it does not tell you which way to trade. It answers one question: has this move been going on long enough that it is running out of participants. Two independent phases run on the chart, a setup and a countdown, each with its own rules, its own cancellation conditions and its own place in the buffers an Expert Advisor can read. The setup Nine consecutive closes on one side of the close four bars back, started by a price flip. A bar t
FREE
Nine closes, thirteen counts, and the discipline most implementations quietly drop. Exhaustion Count MTF runs the classic setup and countdown pair with the full cancellation and recycling rules, marks the perfected nines, leaves the Setup Barrier levels on the chart, and never prints a number on a bar that has not closed, so nothing here repaints, ever. Free, no trial, no locked functions. It counts. It does not predict direction and it does not tell you which way to trade. It answers one questi
FREE
QQE Mod Scanner is two products in one file. The first is the QQE Mod oscillator itself, in this chart's own sub-window: two independent QQE blocks over RSI, reduced to one histogram, a trailing line drawn around zero and a Bollinger filter on that line. The state it publishes is the combination of the two, bright when both blocks agree on a direction and grey when they do not. The second is a board that runs the same calculation across a list of symbols on several timeframes at once. The board
Squeeze Momentum Scanner is two products in one file. The first is Squeeze Momentum MTF itself, in this chart's own sub-window: the momentum histogram coloured by expansion and fading, and the row of squeeze dots that says whether the Bollinger Bands are inside the Keltner Channel, outside it, or have just come out. The second is a board that runs the same calculation across a list of symbols on several timeframes at once. A squeeze release is a short-lived event and it happens on different inst
An arrow tells you to buy. Obsidian Scalper Pro tells you where to buy, where the stop goes, where the three targets are, how big the position should be for your risk, and how good the setup is out of 100. Every signal arrives as a finished trade plan drawn on the chart, and a built in statistics window shows the honest result of the last hundred of them, win rate with a confidence interval and all. Every decision is made on a closed bar, so the history you are looking at is the history you woul
Filter:
No reviews
Reply to review